The algorithm for the Greenland Ice Sheet Today daily melt extent has been revised to account for unusually warm winter snow layers and residual meltwater deep in the snow. Meltwater from last summer’s intense melt season did not completely re-freeze through at least mid December. The adjusted algorithm shows greatly reduced melt extent for early 2013. This much lower extent is more consistent with available weather and climate records.
Melt extent and distribution
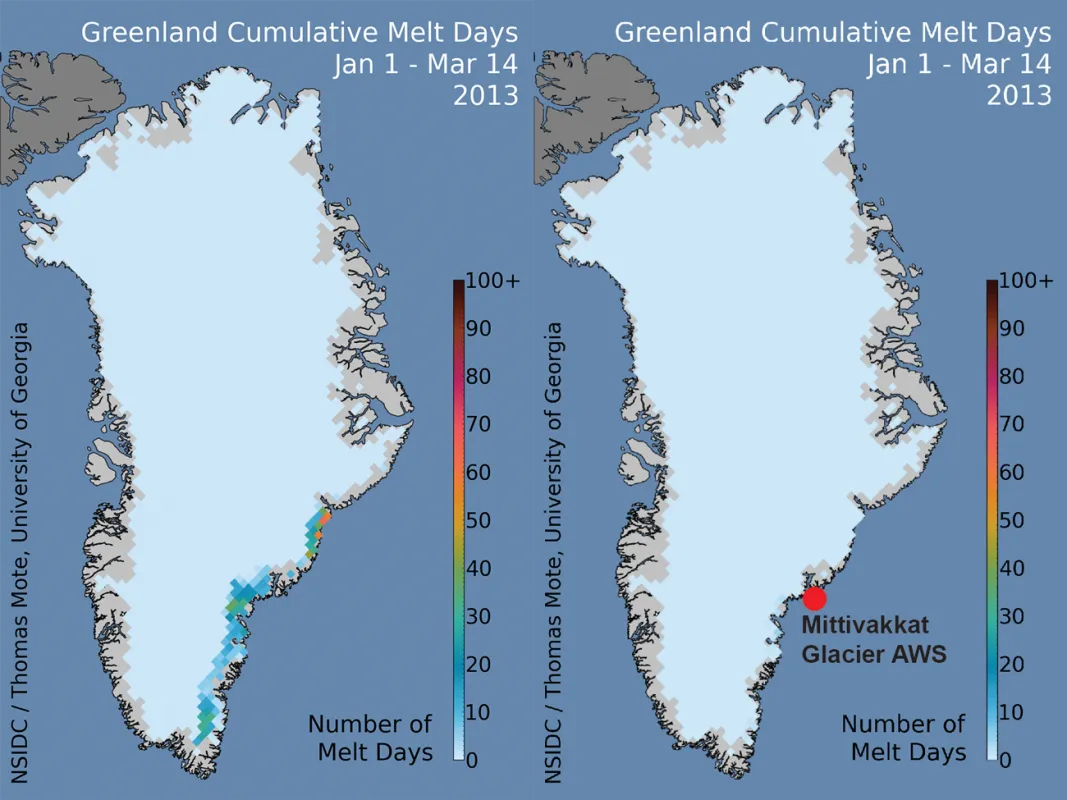
As shown in Figure 1, the adjustment to the algorithm resulted in fewer melt days than previously indicated. The revised image at right shows new surface melting in 2013 in a few small areas along the central southeastern Greenland coast, within the region of earlier spurious melt signals but greatly reduced.
Conditions in context
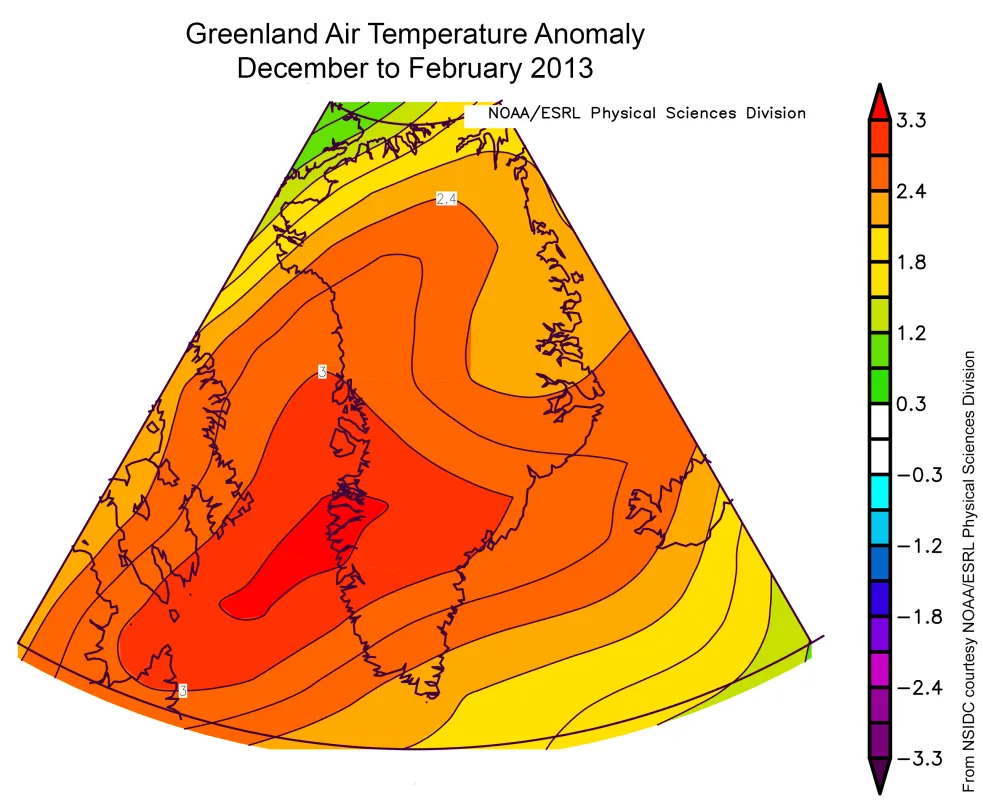
Temperatures in Greenland have been higher than average this winter, with air temperatures near the coast averaging 2.0 to 3.5 degrees Celsius (4 to 6 degrees Fahrenheit) warmer than the 1981 to 2010 average. This has in part been a result of the persistent circulation pattern for the Arctic this winter, characterized by a negative Arctic Oscillation (AO). The AO is a measure of the intensity of the general pattern of low pressure over the northern high latitudes. A negative AO indicates higher-than-average pressures near the North Pole, allowing more frequent southward cold air outbreaks, and more intrusions of warm air masses from higher temperature areas. Despite these anomalously high temperatures along the Greenland coast, temperatures were not high enough to result in melting.
Adjusted algorithm and melt images
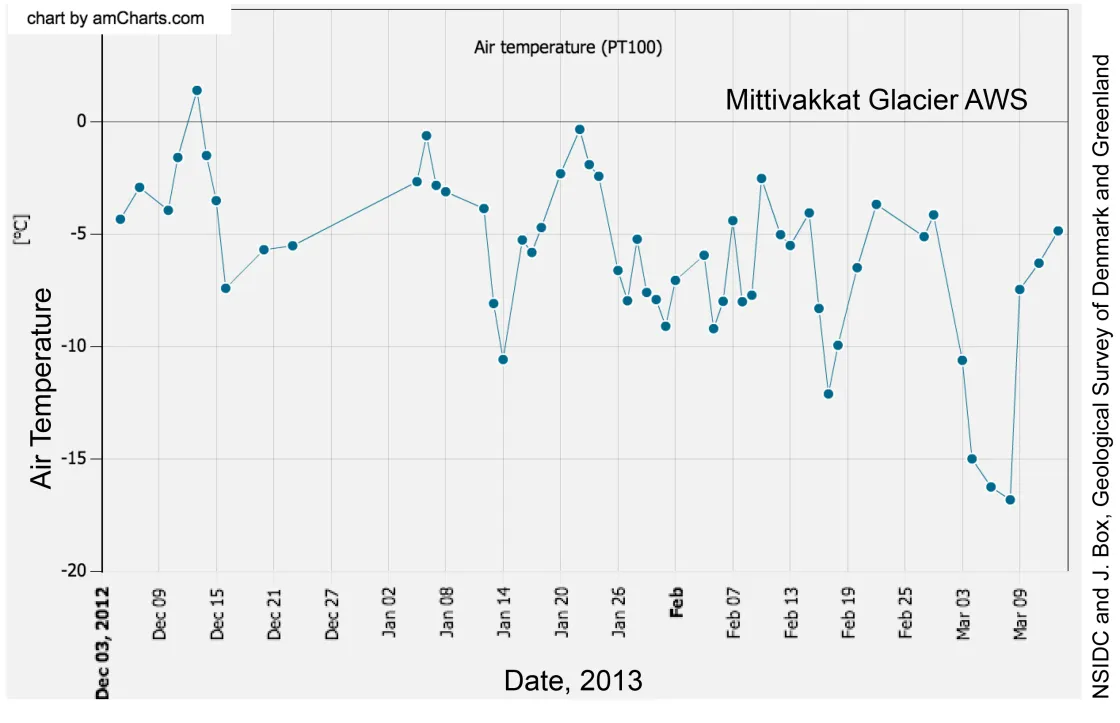
The melt extent algorithm used by Greenland Ice Sheet Today has been overestimating the melt extent, and as a result, daily images posted on this site in February and March may have indicated melt where none occurred. While the algorithm was indicating some coastal melt in February and early March, a comparison with weather data for Nuuk (the Greenland capital city, located along the southwest of the island) and data from the Programme for Monitoring of the Greenland Ice Sheet (PROMICE) suggested these might be spurious melt readings. The local Automated Weather Station (AWS) data from a glacier along the southeastern coast (the Mittivakkat glacier AWS, shown by a red dot in Figure 1; data in Figure 3) indicate that the air temperature did not rise to the melting point (0 degrees Celsius, or 32 degrees Fahrenheit) in February or early March.
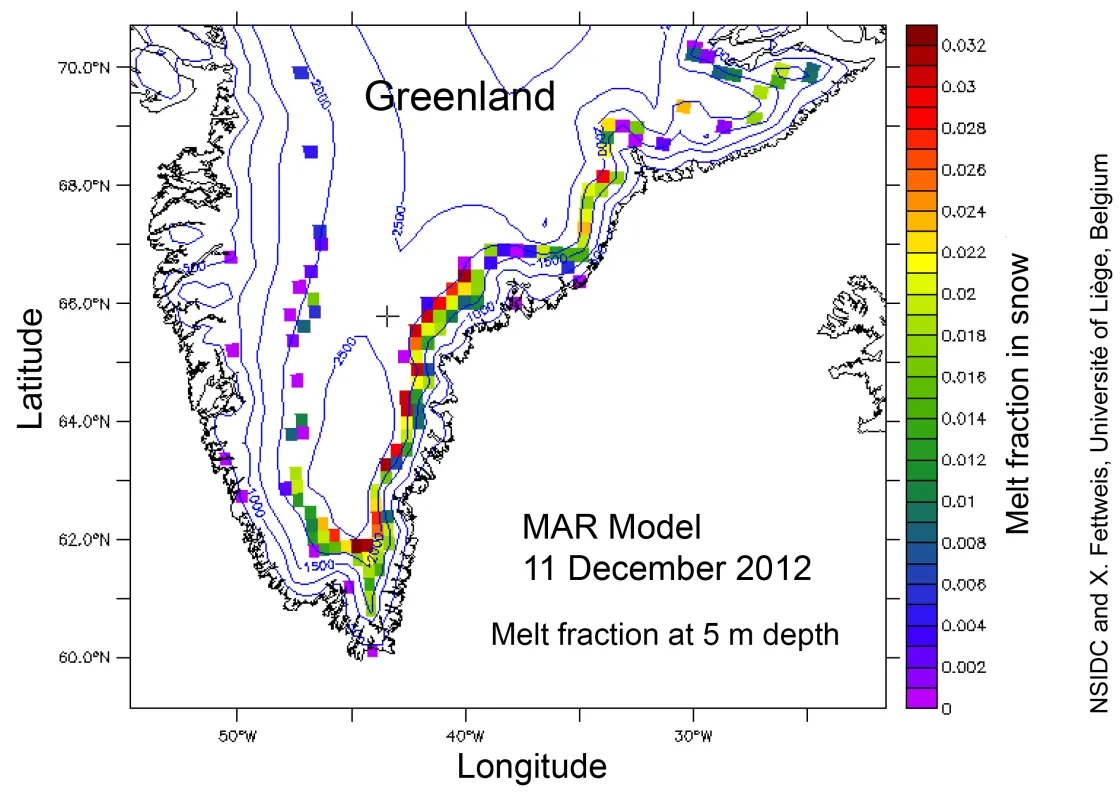
During this period, starting around mid-February in southeast Greenland, the brightness temperatures in the upper few meters of the snowpack were 2 to 10 degrees Celsius (4 to 18 degrees Fahrenheit) higher than those observed during any other year in the 34-year record (1979 to 2012). While surface melt is not unprecedented in Greenland near the coast in February and March, the totals posted prior to March 14 were a result of these unusual snow temperature conditions, and not ongoing surface melt. This winter has seen unusually warm snow at depth on the ice sheet, following the intense melting that occurred last summer. The melt detection method, based on passive microwave emissions, is primarily sensitive to near-surface conditions, but has some input from the snowpack down several meters (10 to 20 feet). Heavy snow fell during the relatively warm winter, burying and insulating deeper snow. This contributed to anomalously high temperatures for the uppermost layers of snow this winter. Additionally, models based on snowpack properties suggested that some 2012 meltwater remained unfrozen at 5 meters depth (approximately 16 feet) in mid-December. The model results are consistent with observations from JAXA’s AMSR-2 sensor. The algorithm was adjusted by combining the trend of observed brightness temperatures with a model of the expected microwave emission in the channels used for melt detection (the SSM/I sensor’s 37 GHz Horizontal polarization channel). This adjustment is generally performed every year in March to calibrate the melt detection thresholds. However, because of the unusual condition of the snowpack, the adjustment needed to be made much earlier than ever before.
Further information
Fettweis, X., M. Tedesco, M. van den Broeke, and J. Ettema, 2011. Melting trends over the Greenland ice sheet (1958-2009) from spaceborne microwave data and regional climate models. The Cryosphere 5, 359-375, https://doi.org/10.5194/tc-5-359-2011.
Programme for Monitoring of the Greenland Ice sheet (PROMICE)


