By Michon Scott
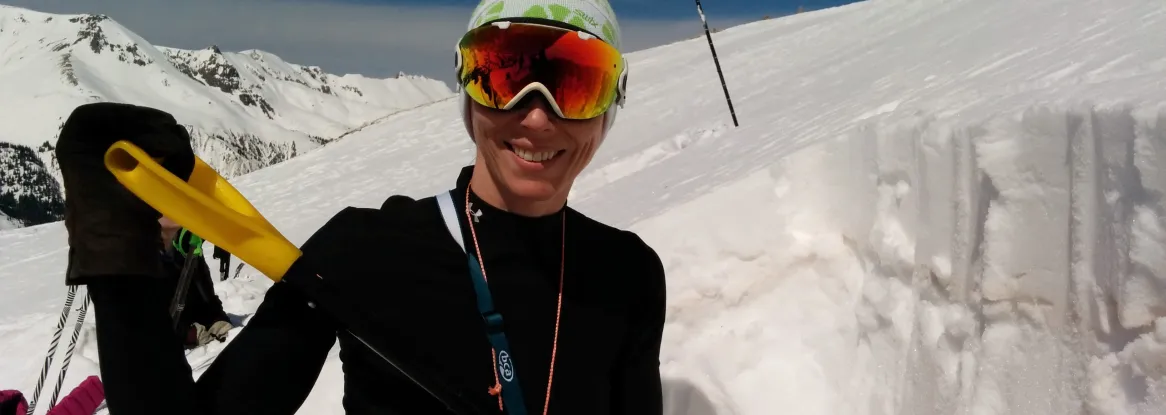
In September 2021, a gaggle of NSIDC employees visited Colorado’s Arapaho Glacier, camping overnight, and taking measurements and photos. One snapshot of the trip featured NSIDC’s Ann Windnagel surveying the glacier, by that point a shriveled ghost of its former self.
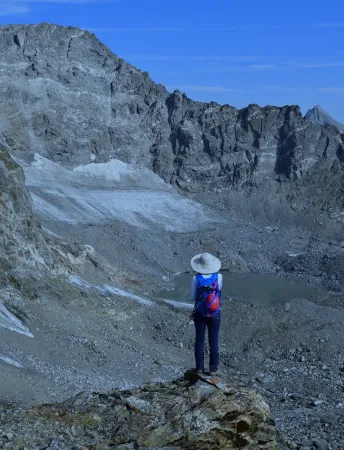
Arapaho Glacier is practically in Windnagel’s backyard, compared to other glaciers she has researched; a few years earlier, she was investigating glaciers in the Alps. Glacier treks are just one facet of her contributions to NSIDC. Windnagel is a project manager at NSIDC, funded primarily by the National Oceanic and Atmospheric Administration’s program (NOAA@NSIDC). Her contributions span data set development, interactive applications, and research related to glaciers, sea ice, and snow. In this Q&A, she describes the many hats she has worn over the years, her biggest challenges, and her biggest rewards. This interview has been lightly edited for length and clarity.
Q: When did you start working at NSIDC and what drew you to the data center?
I came here in July 2007. I had been working at the University of Colorado’s Laboratory for Atmospheric and Space Physics (LASP), where I was doing computer programming. I was tired of programming and started looking around wondering, “Well, what else can I do?” I’m a good writer, and I noticed an opening in NSIDC’s technical writing group. That’s how I got my foot in the door. After I was here about a year, Florence Fetterer, NOAA@NSIDC’s program manager, recruited me to her team. I’ve been working for her ever since.
Q: What roles have you filled here?
Technical writer, data curator, product lead, programming, and data analysis when it’s needed. I wear all the hats, whatever NOAA needs. The software developers do the major developing, but I’ve earned a data analysis certificate from Earth Lab and, utilizing my previous computer programming experience from earlier in my career, I’ve learned Python so I can do analysis on the data products when needed.
NSIDC offers a wealth of sea ice data products and visualization tools. Windnagel has contributed to several of them.
Q: You’ve worked with multiple sea ice products at NSIDC, such as the Sea Ice Index, Charctic, MASIE, SCICEX. What were your biggest challenges and rewards?
The Sea Ice Index is one of NSIDC’s biggest products. It’s rewarding working on that, just from the number of people who rely on it. I’ve helped to guide its evolution. When I got here, we were in Sea Ice Index Version 1. I think my first major project-management role working with software developers was updating to Version 2. Then we started getting user comments about the climatology. We were only using a 20-year climatology, and many people felt we should be using a 30-year one. We brought sea ice trends and anomalies into the new climatology range the science community was requesting. So that was big. It culminated in an NSIDC Special Report I wrote, and I was listed as an author of the Sea Ice Index product. Just to listen to the users and then to make changes based on community feedback was cool.
Q: Are there hidden gems in NSIDC sea ice products?
SCICEX is cool because the data come from submarines. This data product is not a consistent record from year to year, but it has data from upward-looking sonar. It’s a good product for validation because the passive microwave sensors we rely on to monitor sea ice have limitations. In general, they have a resolution of only about 25 kilometers (16 miles), though some of the newer-generation sensors are better. Upward-looking sonar provides high-resolution data derived from pings along submarine tracks. You can use this data product to confirm that the satellites and algorithms you’re using to create your data are working.
The Sea Ice Analysis Tool is another cool application that relies on the Sea Ice Index It’s fulfilling to create applications that allow users to visualize data.
Snow Today is a NASA-funded research project offering data and information about current, recent, and historical snow cover. Windnagel has overseen development of the Daily Snow Viewer application.
Q: How did you get involved in Snow Today?
I got asked to do the project management of it because I managed lots of other things. I could help with the web application development side of it because I’d done that before. I was familiar with managing developers.
Up to now, Snow Today has focused on the western contiguous United States. The Snow Today scientists want to add more regions of the world. Already in progress are Alaska, Canada, and High Mountain Asia, but to add others, they need more funding for that. I know that US watershed managers already use it to track snow water equivalent.
Windnagel undertook a major research project identifying the world’s largest glaciers and glacier complexes starting in 2019.
Q: Did you know when you set out for Switzerland that the results would include a new data set, a special report, and a peer-reviewed paper?
I did. I went there with the expressed purpose of working with the World Glacier Monitoring Service at the University of Zurich to tackle this problem: What are the biggest glaciers in the world? It’s a question that the World Glacier Monitoring Service and NSIDC get asked frequently, but there really was no definitive answer. You could Google it and you might get answers such as Thwaites Glacier but Thwaites and Pine Island Glaciers are outlet glaciers for the Antarctic Ice Sheet, so they’re considered part of that ice sheet.
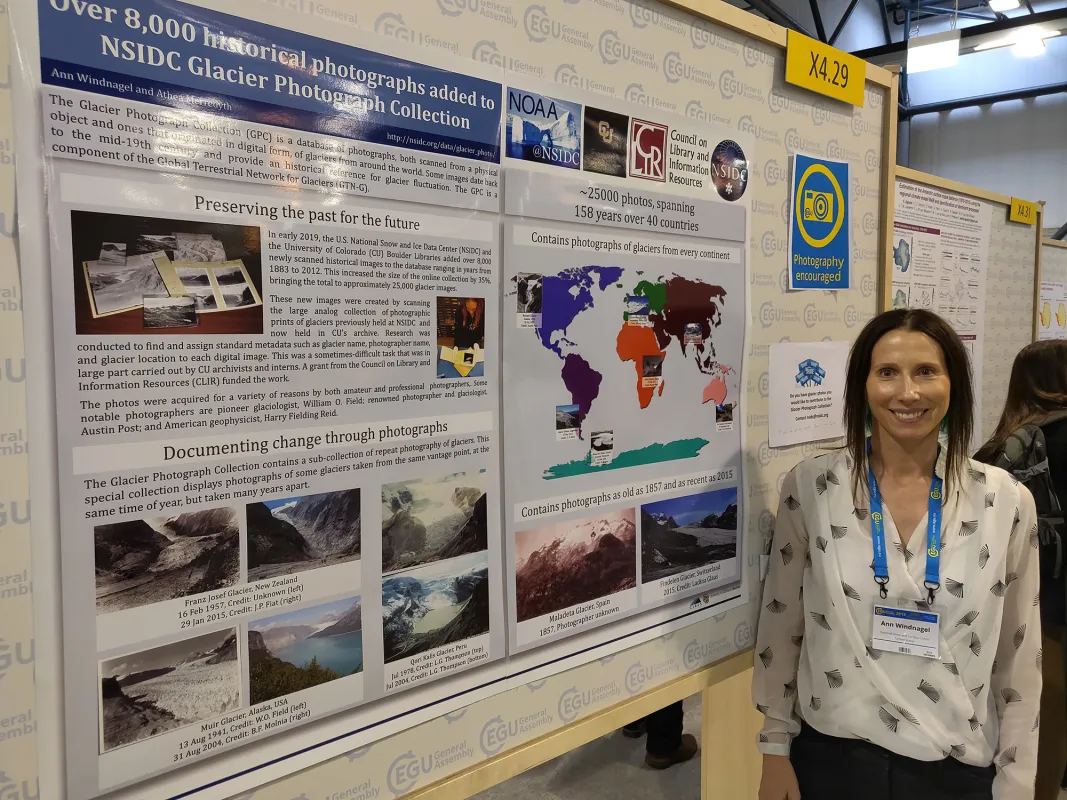
I worked with Michael Zemp at the World Glacier Monitoring Service. NOAA@NSIDC and the monitoring service have had a long history of collaboration through the Glacier Photograph Collection and through a grad student exchange program. Some students from Switzerland visited NSIDC for a couple of weeks, some stayed for a couple of months to work on adding glaciers to the project and updating metadata. We did that for years, and one day I mentioned to Michael, “You keep sending us students. Could I come there?” And he said, “Yeah, and what I really would love you to work on is determining what are the largest glaciers in the world.” So, I went there for two months. The trip started in Vienna at the European Geophysical Union meeting. I had an initial poster just describing the work I was going to be doing, and then went on to Zurich where I stayed for six weeks and started on this project. I utilized my Python skills, and the two data sets that I used were the Randolph Glacier Inventory (RGI) and Global Land Ice Measurements from Space (GLIMS).
Q: How did you carry out your glacier research?
How I did it is fairly straightforward, but it required a lot more thought and effort than I expected. When Michael first said, “Hey, what are the biggest glaciers in the world? Query these two databases for them,” I thought, “Well that sounds easy; I’ll be done in a month.” But it didn't turn out that way.
First off, those two databases are different. Randolph Glacier Inventory (RGI) is just a snapshot in time, at about the same time. I used RGI 6.0 at the time, with data from around the year 2000. GLIMS is a time series of outlines so you can see the glaciers changing, retreating, or a few that are advancing. To compare them, I had to write a lot of code and compare dates. Then I queried each of them for the largest and compared the results. That work was a little more manual. It wasn’t hard. It’s a straightforward thing, just time consuming.
To compare glaciers, we used glacier area. That’s what RGI and GLIMS have. There are other measurements you could use. One could say volume is more accurate because you also get the thickness of the glacier, but we just don’t have the volume of all the glaciers of the world. RGI and GLIMS both have about 80 percent of the glaciers outlined. My NSIDC Special Report has a little section on an attempt to measure volume based on a proxy estimate. I did a quick analysis of some glaciers and found I was getting similar answers.
GLIMS and RGI are both databases of shapefiles. I’d load a glacier region from the Global Terrestrial Network for Glaciers into my Python notebook, and then I would load GLIMS and I would query, “What are all the glaciers that are within this region?”
I also identified glacier complexes, basically glaciers that are touching. I had to write a little piece of code to merge all glaciers that were touching into one gigantic entity. We had a big discussion about this, the whole team, especially when we started writing the paper, about what do you call a glacier complex? We make this very clear in our paper: Some of our complexes are outside of how the science community normally describes them, usually split into drainage basins. But we were interested in all ice that is touching.
Q: Do you anticipate future work on the world’s biggest glaciers?
RGI 7.0 was just released this past summer, and I believe GLIMS has a new version as well. I have plans to rerun my code with the latest RGI and GLIMS, and to see if there are any changes. I think the rankings themselves will probably stay about the same, but I would imagine some of the areas have decreased.
Q: What would you like people to know about NOAA@NSIDC?
We’ve got great satellite-era data sets, but we also have unique data sets that go back further in time than satellite-era ones. We’ve got sea ice back to 1850 that uses data from old ship logbooks. We have the Glacier Photograph Collection that goes back to the mid-nineteenth century. We have freeze and thaw times for lakes and rivers that goes back centuries. That’s what’s neat about NOAA@NSIDC: We rescue old data and make it usable.
Q: What advice would you give to a student who wants to pursue a career in science?
Follow what you’re passionate about. When I was in middle school, I just loved science. I loved doing the science homework and excelled at it. I loved math. I know it sounds so cliché, but if you like science, just take science classes. And get involved with science outside of school, too. I did some science fairs. I mean, it’s fairly nerdy, but yeah, go and make a little diorama of some science-y thing.


