By Michon Scott
A glaciologist at a remote campsite on the Greenland Ice Sheet, a middle school teacher in the Midwestern United States, and a college student trying to learn about Geographic Information System (GIS) software all have something in common. They can all benefit from the QGreenland GIS package.
QGreenland is a free mapping tool supported by video tutorials, complete documentation, and a website to help you to get started and continue your learning. The QGreenland project, spearheaded by researcher Twila Moon of the National Snow and Ice Data Center, now boasts a new product release, a revamped website, and funding for enhanced data sharing and interoperability.
The growing importance of Geographic Information System (GIS) software
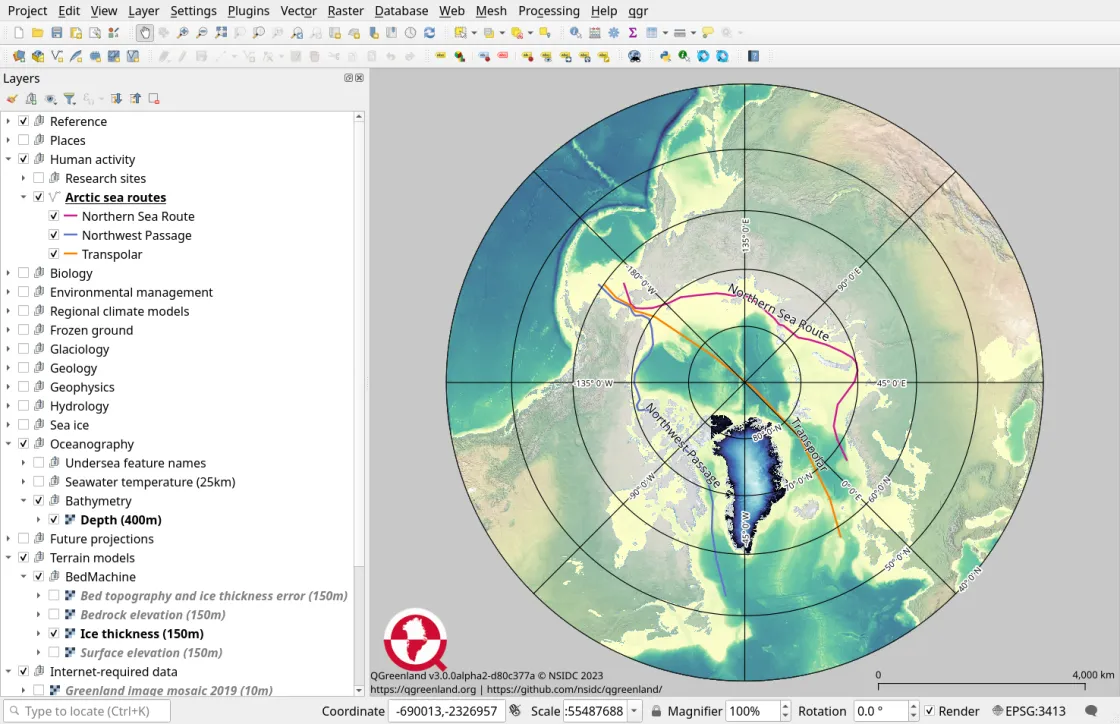
GIS software assembles and displays location-based data about our planet, and users can incorporate those data as layers over a base map. GIS offerings are diverse, including just about any kind of data tagged with a location on Earth’s surface. Data layers might relate to terrain, wildlife habitats, or human settlements. Satellite sensors provide much of the observational data available through GIS technology.
Users can stack data layers, looking for correlations between geology and infrastructure, for example, or satellite observations of ice sheet thickness to underlying bedrock mapping. Users can even edit existing layers or add entirely new layers to their visualizations. GIS software users can produce interactive visualizations of relationships and changes over time that may help decision makers better plan for the future.
To stack data layers and produce visualizations, users need specialized software that can meet the demands of big data sets and users of varied skill levels. A popular GIS software package is QGIS. QGIS is a free, open-source package. It can run on multiple platforms, and can export visualizations to other software packages, such as ArcGIS, the geographic information system licensed and maintained by Esri.
Enter QGreenland
QGreenland is a GIS environment—an assemblage of files designed to operate in QGIS—and as its name suggests, this environment focuses on Greenland. The QGreenland core package contains data and documentation files that can be downloaded in one step. Users must first download and install QGIS to use QGreenland, but after downloading both, users can start visualizing data right away.
Many QGreenland data layers are derived from data sets archived at NSIDC. NASA data sets available through the NSIDC Distributed Active Archive Center (DAAC) include MEaSUREs Greenland Annual Ice Sheet Velocity Mosaics from SAR and Landsat and MEaSUREs Annual Greenland Outlet Glacier Terminus Positions from SAR Mosaics. The popular National Oceanic and Atmospheric Administration (NOAA) Sea Ice Index is available through the NOAA@NSIDC program.
NSIDC software developers Matt Fisher and Trey Stafford helped construct QGreenland, which emulates a predecessor QGIS project, Quantarctica, but with a different approach to development. “Quantarctica is built by hand within the QGIS interface, and QGreenland is built automatically by open-source code,” Fisher said. The open-source code is written in Python, a high-level programming language designed for ease of use. This means that QGreenland code can be leveraged by others who might want to create custom-made QGIS data environments.
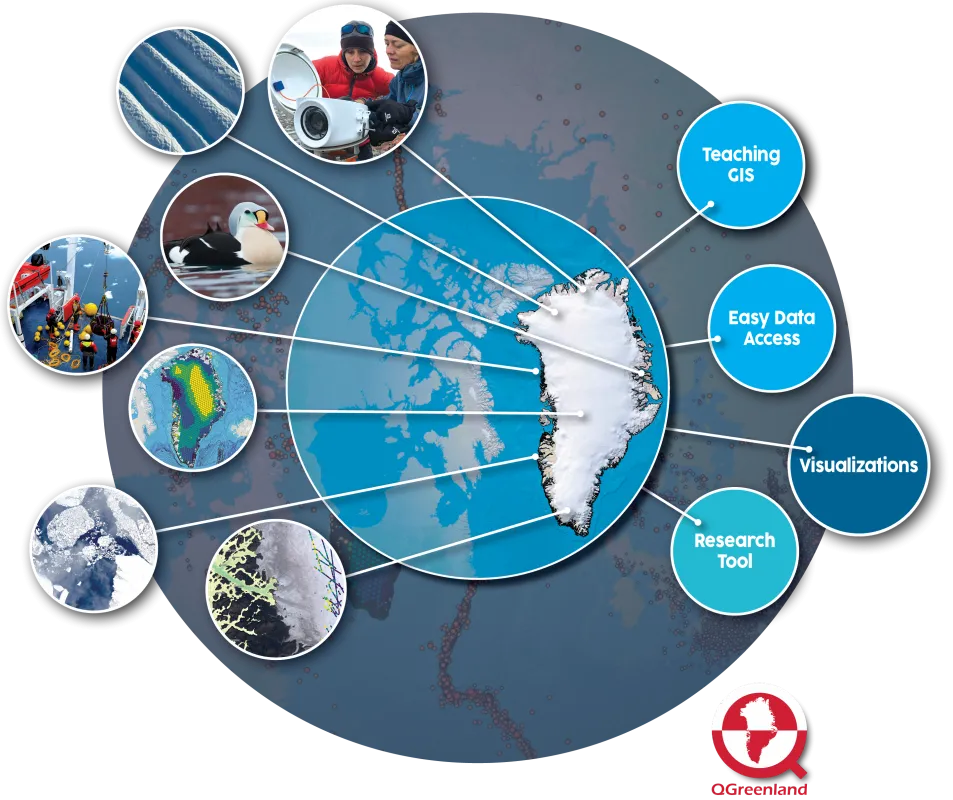
Because QGreenland—like QGIS—can be downloaded to a personal computer or laptop, it can be used in remote locations where internet access may be slow, costly, or unavailable. Researchers comprise QGreenland’s principal audience, while other users include teachers and students. It has been incorporated into the newly released PolarPASS undergraduate curriculum within the Carleton College Science Education Resource Center. QGreenland can also serve the needs of planners and policymakers.
QGreenland has already benefited a wide swath of GIS users, but it remains a work in progress. The team behind QGreenland continually upgrades the software and plans for the future.
What’s new in QGreenland
In August 2023, QGreenland released a new version, Version 3.0. The new release includes bug fixes, updated data, and additional data layers not available in previous versions, such as new and improved data on roads and buildings. In addition, the QGreenland team has revamped the QGreenland website, offering more streamlined, straightforward information about getting started with GIS. “We also developed a YouTube video series,” Moon said. “If you are brand new to GIS, it takes you from zero to hero in about an hour.” Users seeking help can consult updated documentation and a QGreenland discussion space on GitHub.
In upgrading QGreenland to its latest version, NSIDC’s Fisher and Stafford worked with a broad community of users. Stafford stated, “We collaborated with an international editorial board that helped to guide our decision-making process around what data to include, how it is visualized, and what metadata is important to retain and make available to users.” Fisher explained that the QGreenland development team worked with CryoCloud, a NASA-funded project providing hackathon-style training aimed at developing open-source tools. The outcome included programming best practices for international learners.
On the horizon
The latest set of QGreenland enhancements will not be the last. The National Science Foundation (NSF) has awarded new funding for future enhancements to the QGreenland project. Moon plans to start applying the new NSF funding in 2024. “In the next phase, we’re partnering with the NSF Arctic Data Center to build tools designed for both creators and users of geospatial data,” she said.
The funding will support the development of QGreenland-Net, envisioned as cloud-based geospatial data support. Moon wants QGreenland-Net to address problems she has long noticed. For instance, data sets are frequently loaded with valuable information, but not easily shared or combined with other data. Moon explained that QGreenland users often want to share their data through QGreenland, or gain access to data not available through the core QGreenland package. “People might bring up a data set and it’s in the wrong projection, or not the right filetype, or it’s hard to understand what the metadata mean,” Moon said. Through QGreenland-Net, Moon wants to develop consistent standards “to make these open tools easy for people to use, to find a data set they really want, and to more easily transform their own data to be usable by others.”
The new funding centers around a new partnership between QGreenland and the NSF Arctic Data Center to develop an “Open Geospatial Data Cloud.” The suite of services will offer tools to make data sets more FAIR: Findable, Accessible, Interoperable, and Reusable. Users will be able to find and transform the geospatial data they want and then share and visualize those data. In fact, this effort is already apparent in Version 3.0. Stafford explained that NSIDC developers configured the new version to be understandable to outside collaborators, saying, “We wanted someone who had little development experience to be able to contribute and understand how to run the code.” NSIDC bolstered the effort with in-depth documentation.
New funding will allow these efforts to continue. Fisher stated, “Our vision includes a future when the Python code we’ve written to build QGreenland can be reused to build a general-purpose library for building other QGIS data packages. As we built QGreenland, researchers expressed interest in similar data packages for other regions, for instance QSvalbard.”
Ultimately, Moon hopes that the tools and code developed with this new funding can then be applied beyond Greenland—across the entire region of the Arctic and across geoscience disciplines.


