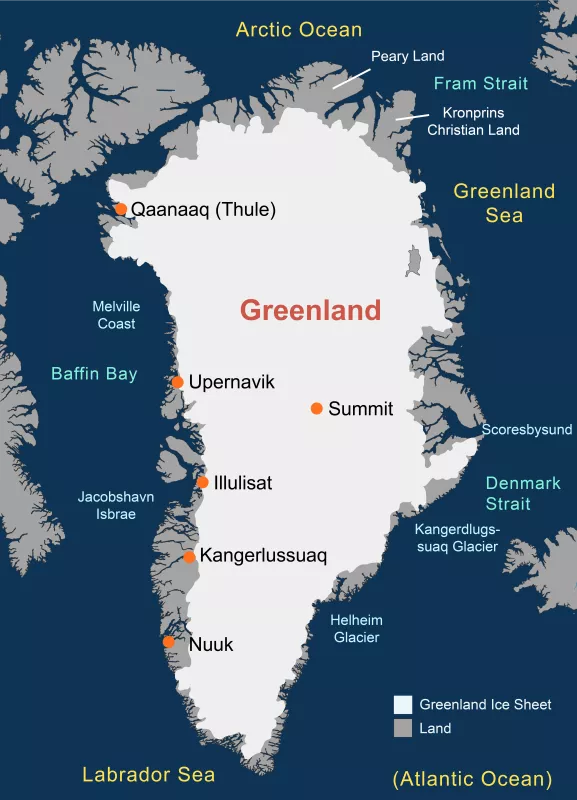
Greenland Ice Sheet Today offers the latest satellite data on surface melting of the Greenland Ice Sheet. Surface melt on the ice sheet results from daily weather conditions that are driven by air temperatures, winds, and feedback effect from changes in the snow or surface dust and soot. The extent and duration of this surface melting is an indicator of changing climate and other conditions. It is a major component of the waning of the ice sheet. The Greenland Ice Sheet is very thick, averaging 2 to 3 kilometers (1 to 2 miles) across most of the island. Ice sheets normally experience cycles of accumulation from snowfall, and melt due to seasonally warm conditions. In the balance, the average mass of an ice sheet may change very little—unless a changing climate is tipping the balance towards melt.
The mass of ice in the Greenland Ice Sheet has begun to decline in recent decades, attended by an increase in surface melt. At high elevations on the ice sheet, an increase in winter snow accumulation has partially offset the melt. However, the mass loss at lower elevations is outpacing the greater accumulation at high elevations, because warmer temperatures have led to increased melt and faster glacier movement at the island's edges. Researchers monitor many types of satellite data on melting in Greenland to understand how melt patterns may be changing. While local melting can occur on Greenland at any time of the year, the main melt season is June through August. A slight amount of melt usually begins at several places along the southwestern coast in April and May. In early June, the melt begins to spread northward, eastward along the coast, and into the interior. Melting is most extensive in July, and meltwater lakes typically form along the western flank of the ice sheet, visible in satellite images. High elevation areas (above 2,000 meters, or 6,000 feet) may see brief periods of melting in July and early August, but the highest elevation regions (near 3,000 meters, or 10,000 feet) almost never melt. The melt season typically ends by November. In July 2012, a very unusual weather event occurred. For a few days, the entire ice sheet indicated surface melting. While evidence of past heat waves similar to this can be found in ice core records, it had never been seen in the satellite monitoring period (1979 to present). Overall, the 2012 melt season far exceeded all previous years of monitoring, and led to significant amounts of loss of the ice sheet for the year. This event prompted NSIDC to build this website, with the help of two prominent experts on Greenland surface melting (Dr. Thomas Mote of University of Georgia, and Dr. Marco Tedesco of CUNY).
Ice sheet facts
An ice sheet is a mass of glacial land ice extending more than 50,000 square kilometers (20,000 square miles). The two ice sheets on Earth today cover most of Greenland and Antarctica. Greenland has been covered in ice for more than 18 million years; the current ice can be as old as 100,000 years old. Together, the Antarctic and Greenland ice sheets contain more than 99 percent of the freshwater ice on Earth. The Greenland Ice Sheet extends about 1.7 million square kilometers (656,000 square miles), covering most of the island of Greenland, three times the size of Texas. Ice sheets contain enormous quantities of frozen water. If the Greenland Ice Sheet melted completely, scientists estimate that sea level would rise about 6 meters (20 feet).
