ICESat, IceBridge, and ICESat-2: A primer on data access across the three missions
This guide will provide an overview of the altimetry measurements and data sets across the missions, as well as a guide for accessing the data through NASA Earthdata Search and programmatically using an Application Programming Interface (API).
Overview
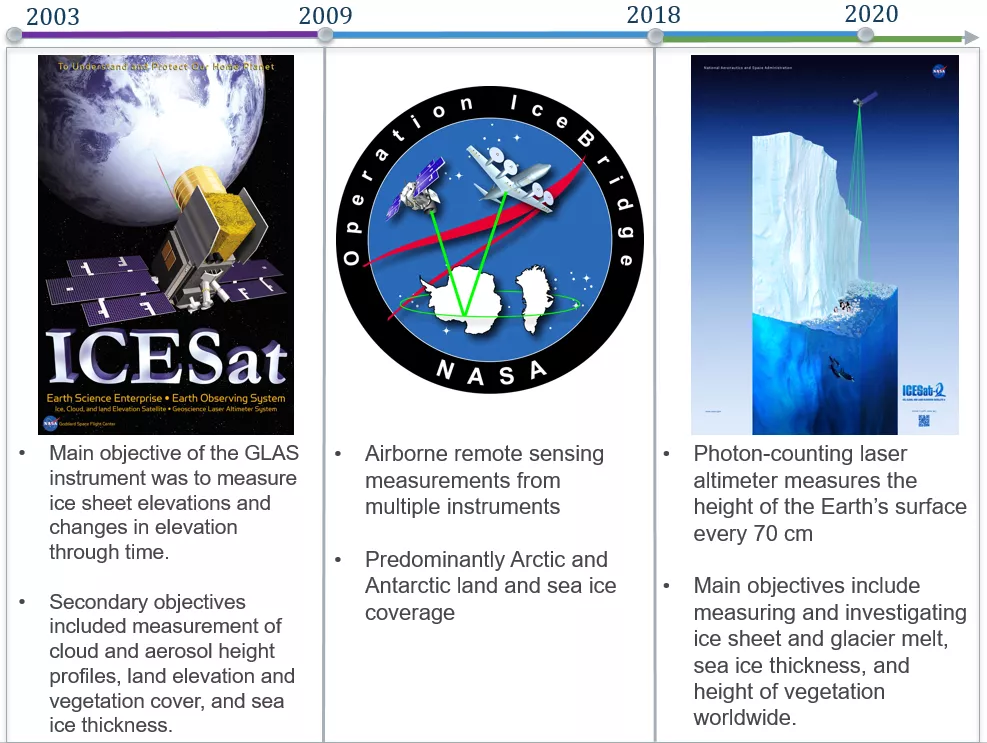
The NASA ICESat, Operation IceBridge, and ICESat-2 missions share a common objective of better characterizing changes across Arctic and Antarctic ice sheets, ice shelves, and sea ice through detailed surface elevation measurements.
Overview of the key objectives and temporal coverage across the missions.
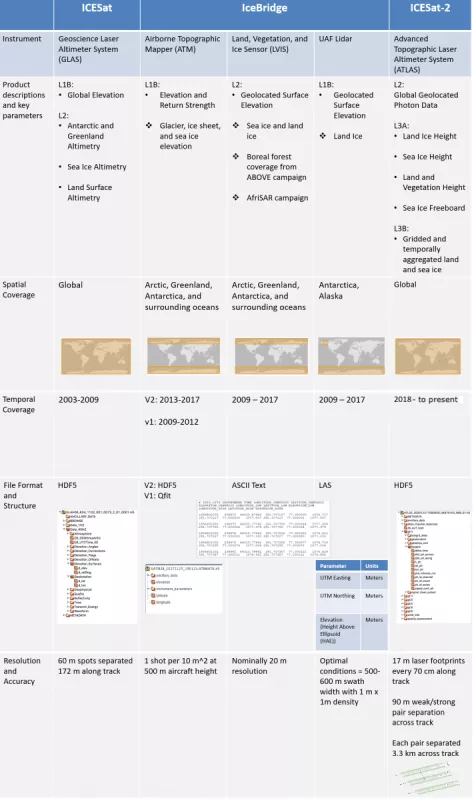
The instruments, formats, parameters, coverage, and resolution vary across the ICESat, IceBridge, and ICESat-2 data sets. The following table provides an overview of the missions’ primary altimetry data sets along with these key metadata.
Altimetry data across the missions
Data access guide
There are several data access options available for ICESat, IceBridge, and ICESat-2 data. Data can be downloaded directly from the data set landing page of any NSIDC data set. For accessing data across all three missions, users can either use NASA Earthdata Search or work programmatically through our access and customization service API. The following guides will provide detailed instructions and examples for these two cross-mission access options.
- Earthdata Search
- Programmatic API
Option 1: Earthdata Search
The following steps will guide you through the process of exploring and accessing ICESat, IceBridge, and ICESat-2 data overlapping across an area and/or time range of interest in the NASA Earthdata Search application. Additionally, you will be guided through the subsetting and reformatting options available for ICESat and ICESat-2 data.
For convenience, we provided an example project of GLAH12, ILVIS2, and ATL06 in Earthdata Search to get you started:
"ICESat, IceBridge, and ICESat-2 over Greenland"
If you'd like to explore this project, you can skip to Step 6 below for access and customization options. Otherwise, follow along starting with Step 1 for guidance on filtering and adding multiple data sets to your project.
Step 1
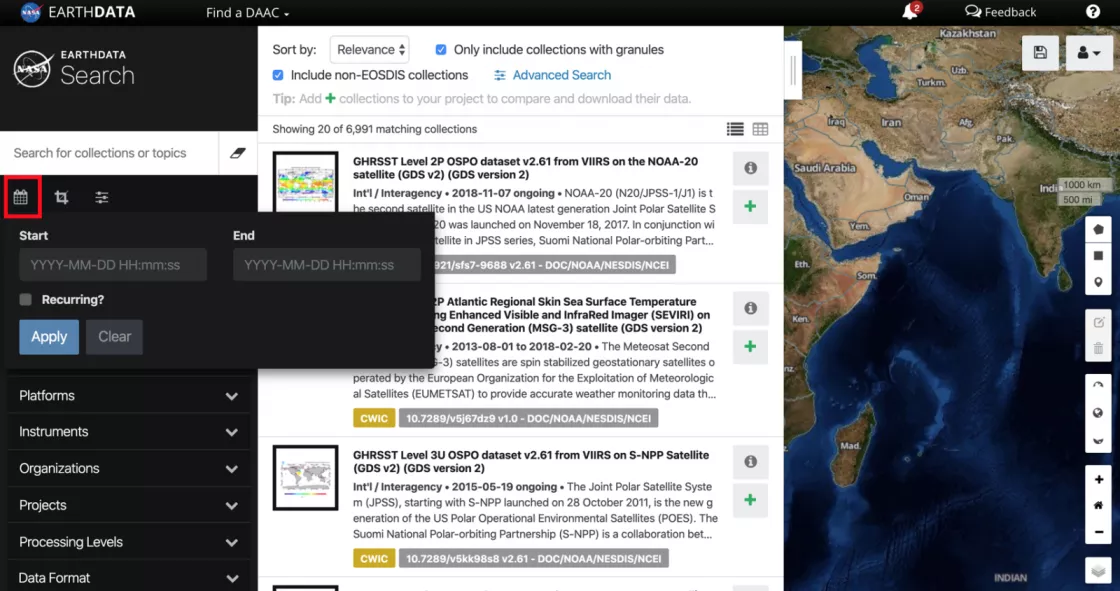
From https://search.earthdata.nasa.gov/, select an area of interest and/or temporal constraint for all data you are interested in accessing.
A. Temporal filtering
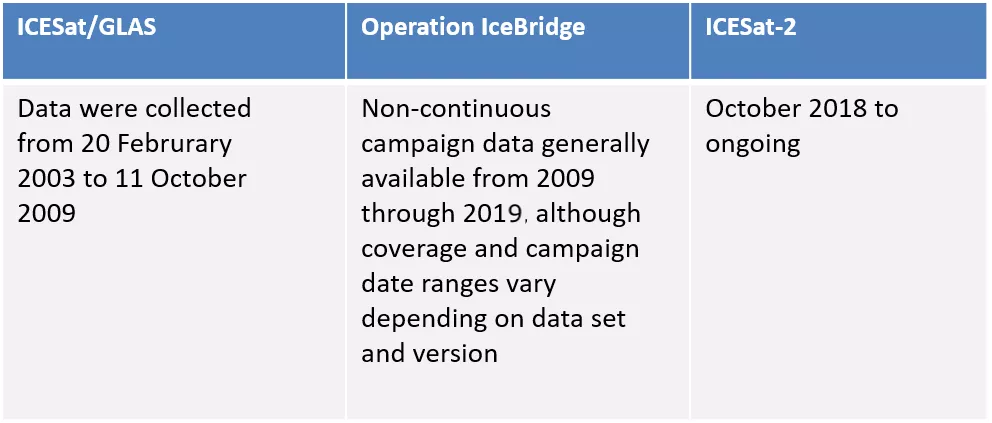
Clicking on the Start and End boxes allows you to drill down to the beginning and end dates of interest. You can also select a recurring day range for multiple years by clicking on the Recurring box. The following table provides the temporal range of data available for all three missions:
B. Spatial filtering
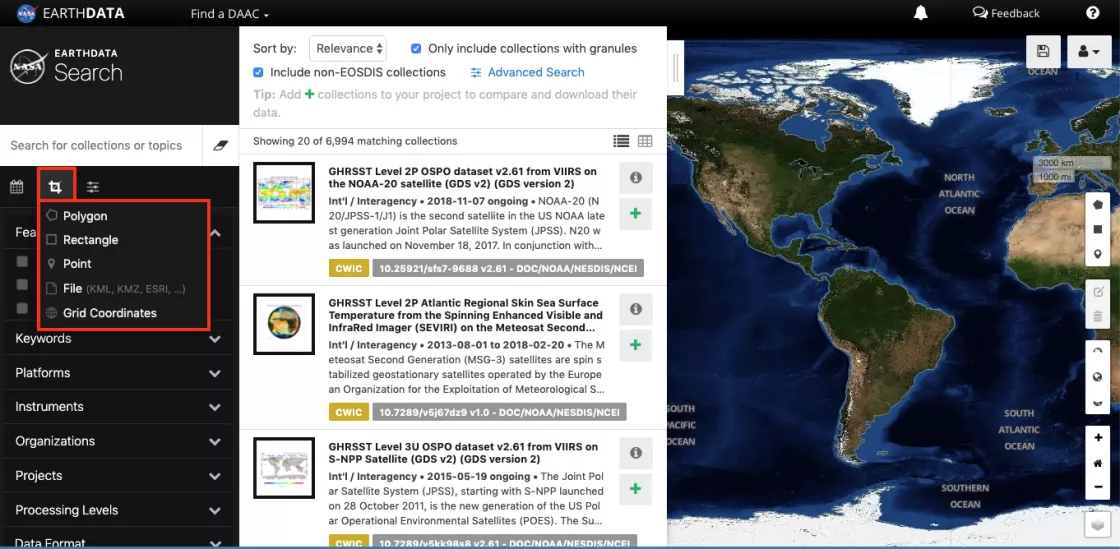
There are several options for spatial filtering upon clicking the spatial filter icon next to the search bar. The ‘Rectangle’ option results in a map drawing tool, allowing you to draw a bounding box on the map. You can also manually enter lat/lon coordinate pairs in the SW and NE text boxes if you have specific coordinates of interest. For best results, enter a bounding box of at least 0.5° x 0.5°. Additionally, you can filter by point, manual polygon entry, or by uploading a polygon (in either KML/KMZ, a zipped Shapefile, GeoJSON, or GeoRSS) using the ‘File’ option. If you are interested in subsetting (cropping) ICESat data by your spatial filter, you may do so using the Rectangle option. Spatially subsetting ICESat-2 data may be done by either specifying a Rectangle option, or by uploading a polygon file.
Step 2
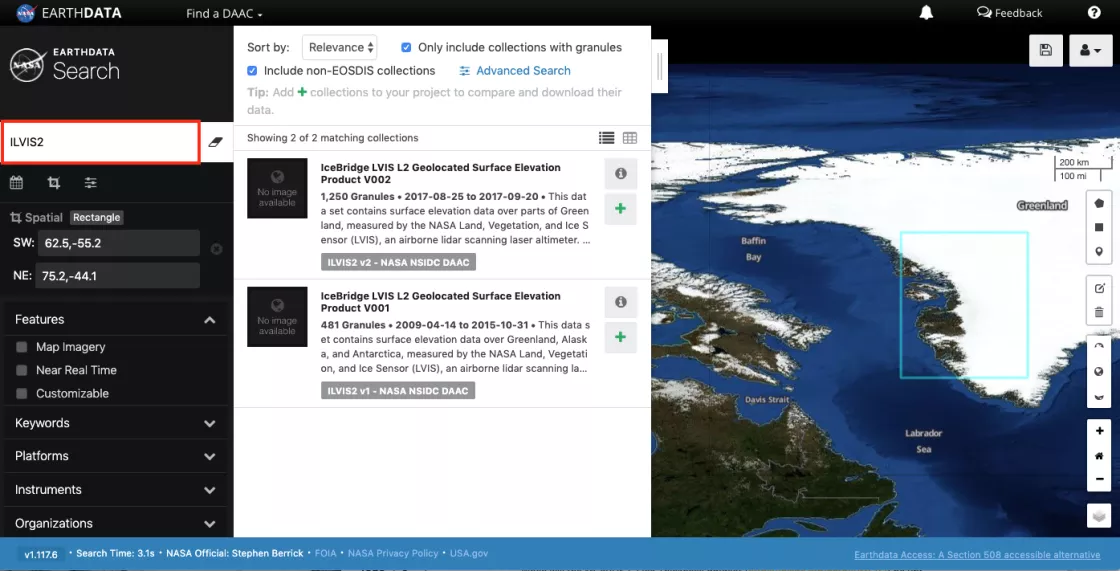
Keyword filtering using the search bar.
The data sets available for each mission are listed on the following pages:
ICESat/GLAS, IceBridge, ICESat-2
The keyword search can be used to filter results by data set ID, or short name (e.g., ILVIS2 as shown in the image above). Alternatively, you can type the following example keywords to browse results for all mission data: “GLAH" for all available GLAS HDF5 data sets, “IceBridge” for all Operation IceBridge mission data sets, and “ATL” to search all available ICESat-2/ATLAS data sets.
Step 3
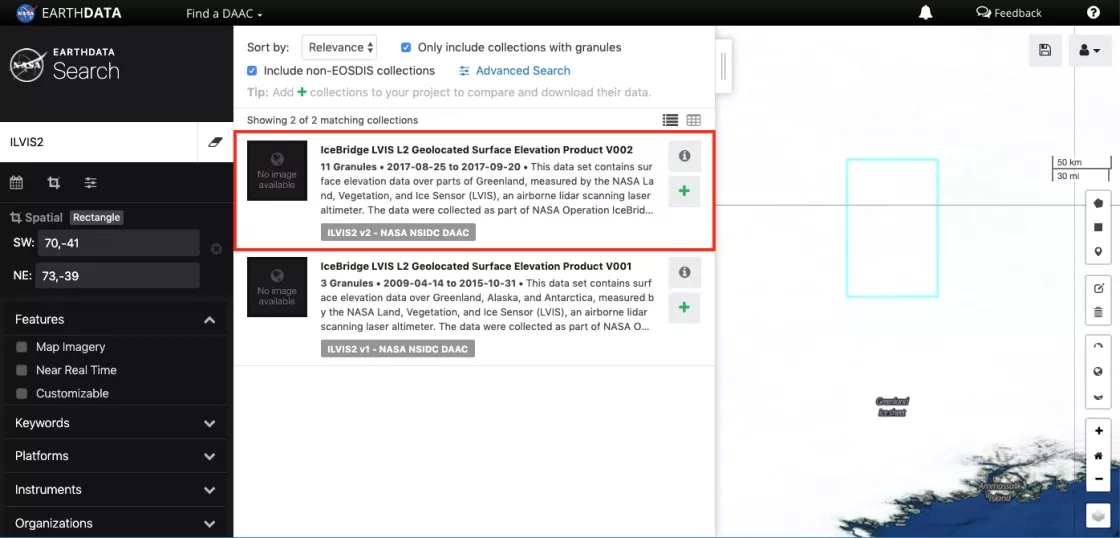
Click on the data set (collection) in the search results to view browse images or view granule extents for an individual collection.
Step 4
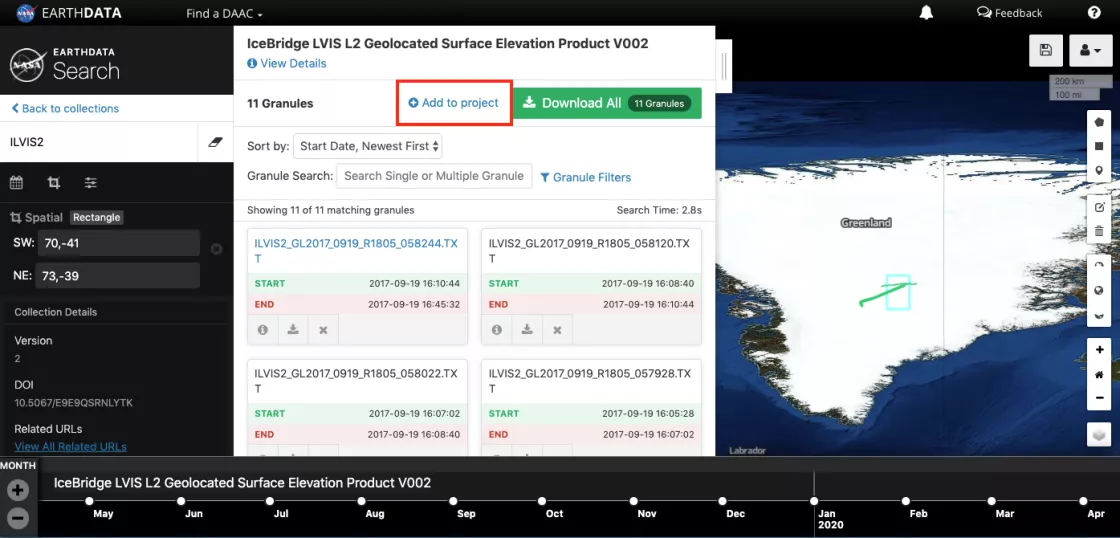
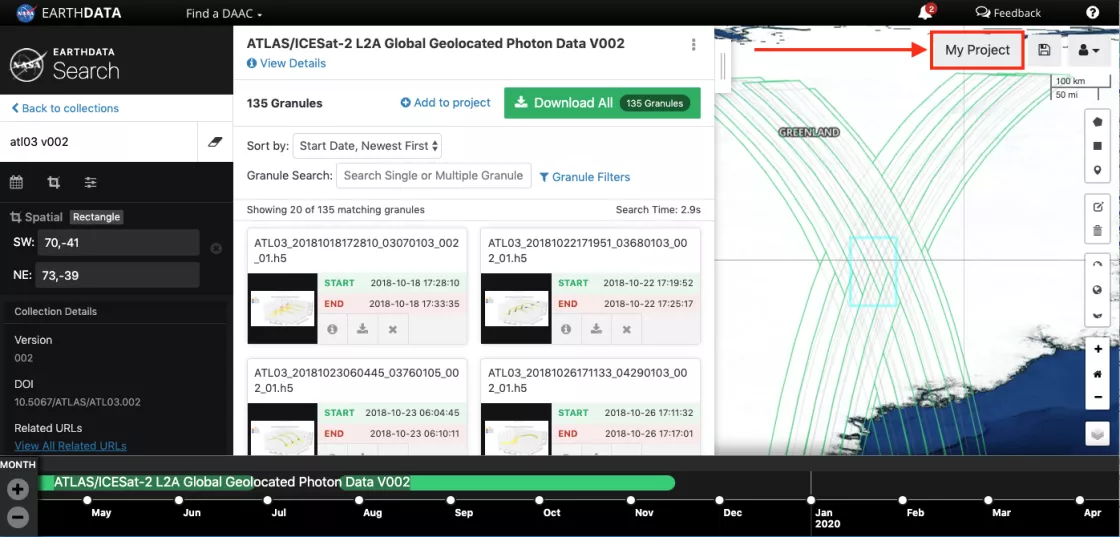
Click on the 'Add to project' button next to the green 'Download All' button.
Repeat Steps 2 through 4 for additional ICESat, IceBridge, or ICESat-2 data sets of interest.
Step 5
Once you're done selecting your data sets of interest, click on the gray 'My Project' button at the top right.
After clicking on the ‘My Project’ button, you will be directed to the Earthdata Login authentication page. Enter your Earthdata Login username and password, or register for a new account if needed by going to https://urs.earthdata.nasa.gov.
After authentication, you will land on the Project page, providing information on the data granules requested, data access methods available, and a map displaying the selected data.
Step 6:
Explore data in Project and edit customization options for the collections.
For IceBridge data, there are only two data access methods: Direct Download and Stage for Delivery. Direct download will provide you with a list of links to individual granules as well as a data access shell script. The Stage for Delivery method will provide a zipped output along with a staged directory of all granules in your project.
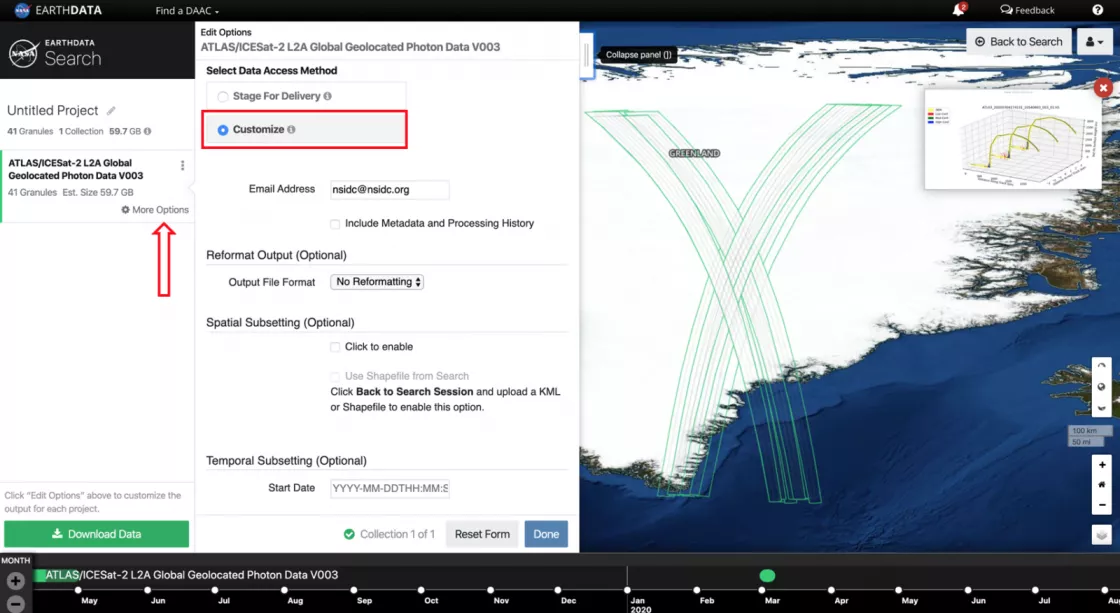
For ICESat and ICESat-2 collections, you can click on the "Customize" radio button, which will allow you to request data subsetting and reformatting services.
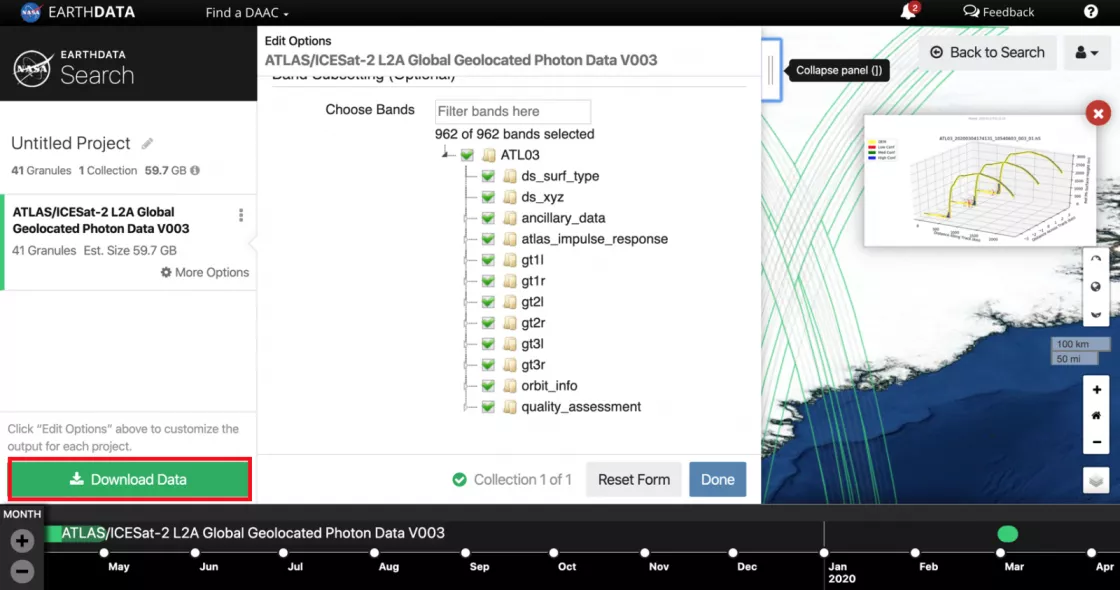
The top of the form includes Reformatting, Spatial Subsetting, and Temporal Subsetting options. The bounding box used from the spatial filter step will be applied to this form. Temporal subsetting options can be used to further subset the data by time. The last option on the form is Band Subsetting. All variables contained within the HDF5 granules can be viewed by expanding the nodes. Click on the box next to each group or parameter to select or de-select.
After selecting your method of choice, select ‘Done’ at the botton of the panel to move on to the data access methods for the next collection.
Step 7
Click on the green "Download Data" button at the bottom of the form once you are ready to submit your request.
Step 8
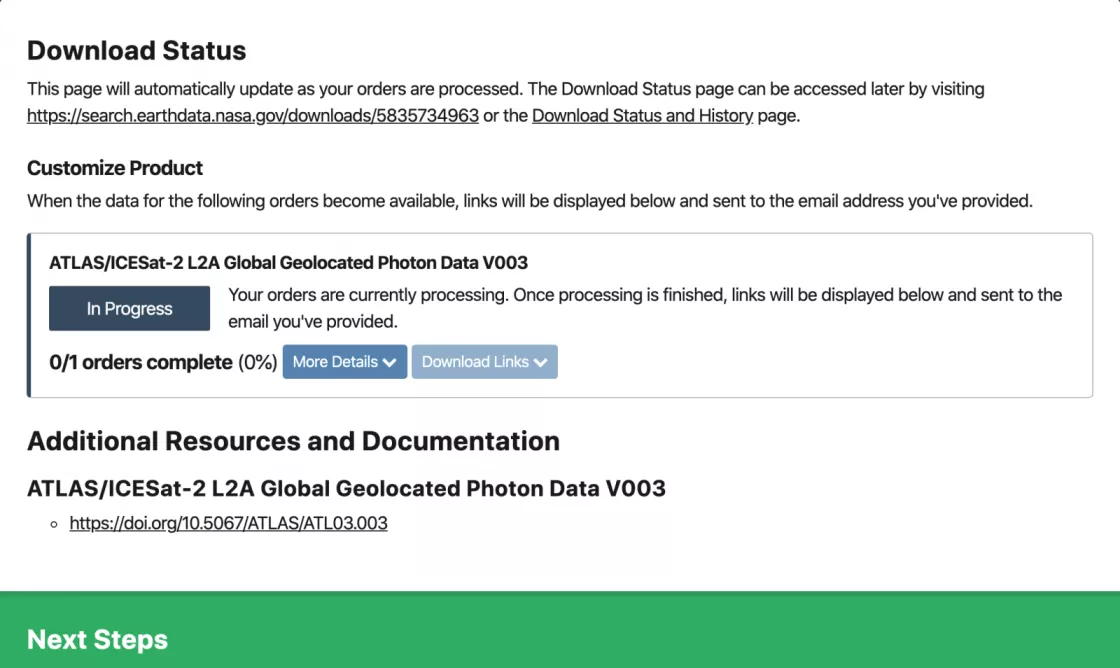
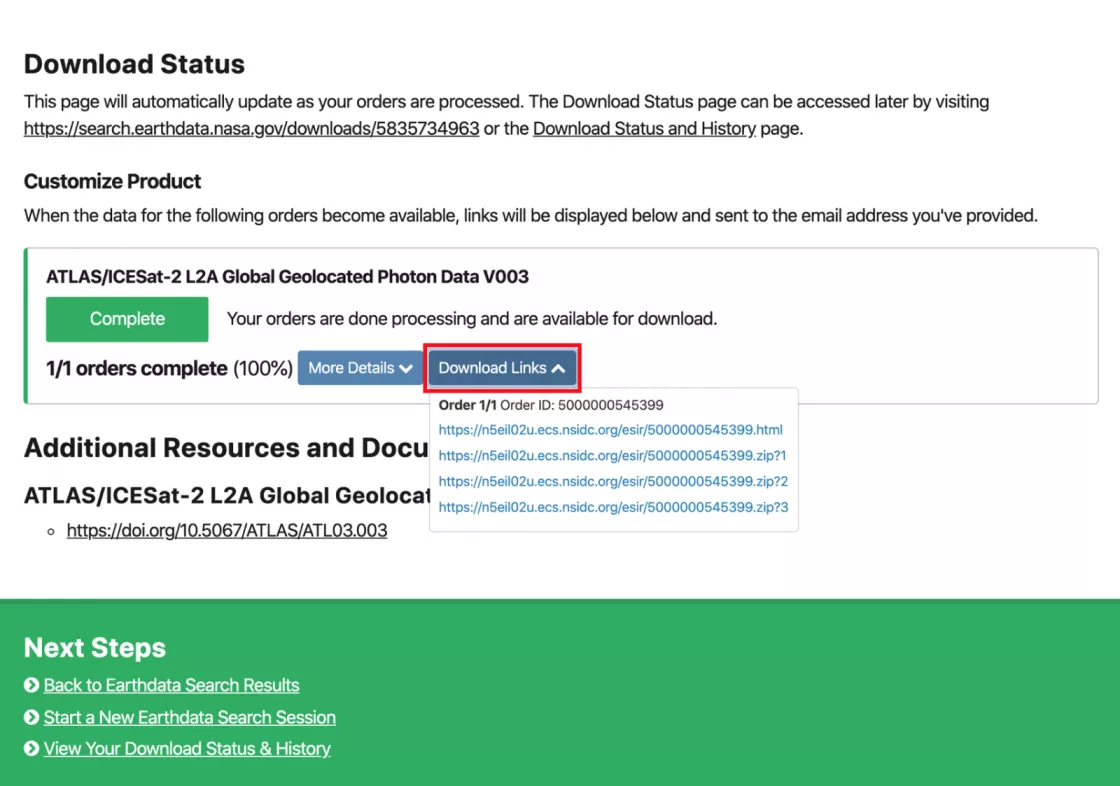
Your request will begin to process. You will receive an email for each collection indicating that your request is pending, and you will receive additional emails with information on how to retrieve your files when the processing is complete. You can also download your order directly from Earthdata Search when complete.
For customization outputs, the first .html link contains additional information including the request summary, a list of input files, the zipped file containing all output files, and download links for each individual output file. The .zip link is also displayed below the .html link on this page for convenience.
>
Note: For spatial, temporal and band subsetting requests, the email you receive noting that processing is complete may also contain notification of: NoMatchingData-No data found that matched subset constraints on a granule-by-granule basis. This may occur when: the spatial extent of a given granule is coincident with your region of interest according to the spatial metadata but no data values exist within those bounds, the temporal subsetting extents are set to a range of time narrower than that of the granules in your project, or you have selected only bands that aren't present within a specific granule or granules.
Option 2: Programmatic API access
Outside of using Earthdata Search to download data, ICESat, IceBridge, and ICESat-2 data can also be accessed programmatically through an Application Programming Interface, or API, based on spatial and temporal filters. The resulting data are returned as either a single file or a multi-file zip depending on the number of data granules requested. The following online tutorial, initially presented at the AGU 2018 Fall Meeting, provides step-by-step guidance on exploring data availability, obtaining an Earthdata Login token, and accessing customized ICESat and ICESat-2 data along with coincident IceBridge data:
In addition to this tutorial, which provides examples using curl, the API endpoint can be accessed through other methods including Python. Please see our Jupyter notebook for Python guidance and access examples:
For further documentation on API access:
Last updated: November 2020
