May 2022 snow summary
- Snow-covered area for the western United States was 119 percent of average for May with above average snow cover in the North outbalancing below average snow cover in the South.
- Snow cover days remained well below average but had a slightly more positive trajectory because of late-season snow in the North.
- Snow albedo (or snow brightness) was near the seventy-fifth percentile for most of May driven primarily by storms in the North, but also in Colorado where new snow covered a dust layer at the surface.
- Between the start of May and the end of May, 309 of the 427 stations reported no snow water equivalent (SWE); the snow melted out completely.
- On average, the snowpack has disappeared nine days early compared to average across the SWE station network.
- In Colorado, dust storms in late April and early May resulted in an unusually fast melt period for large areas of snow.
| Snow-Covered Area | Square Kilometers | Square Miles | Rank |
|---|---|---|---|
| May 2022 | 208,000 | 80,000 | 4 |
| 2001 to 2022, Average | 175,000 | 68,000 | -- |
| 2011, Highest | 310,000 | 120,000 | 1 |
| 2015, Lowest | 113,000 | 44,000 | 22 |
| 2021, Last Year | 133,000 | 51,000 | 19 |
In May 2022, the average snow-covered area for the western United States as a whole was 119 percent of average, ranking fourth in the 22-year satellite record (Table 1). The snow-covered area was 33 percent less than 2011, which had the highest average and 85 percent more than 2015, the year with the least snow-covered area. In 2022, there was 75,000 more square kilometers (29,000 square miles) of snow cover in May relative to a year ago.
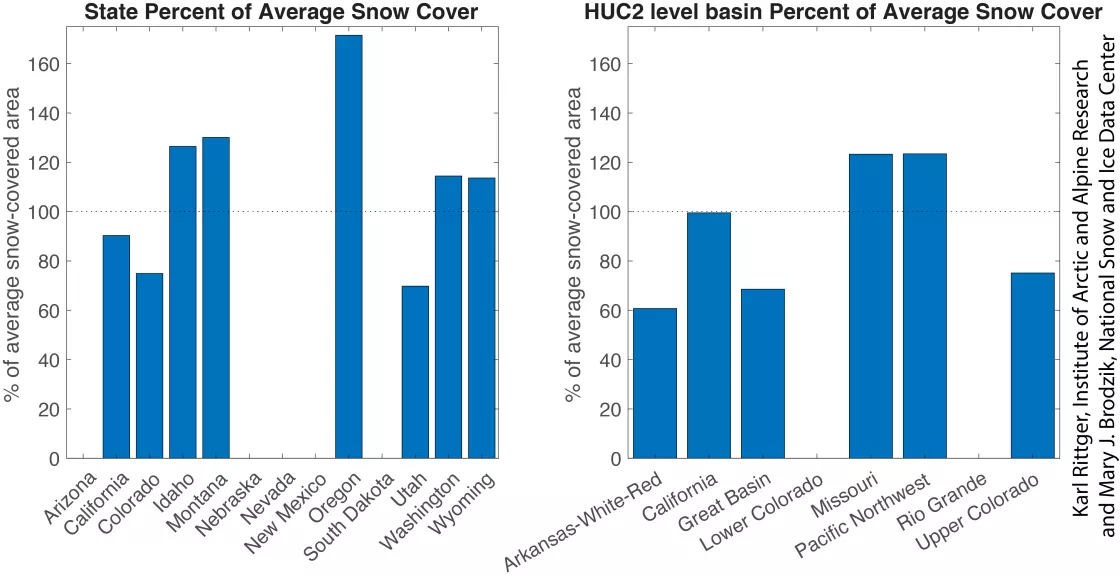
The remaining basins and states with significant snow-covered area (greater than 1,000 square kilometers or 386 square miles) had considerable variation in the last two months. Northern states and basins including Oregon, Washington, Idaho,Montana, Wyoming, and the Missouri and Pacific Northwest basins had above average snow-covered area (Figure 1). Southern states including Arizona, California, Colorado, and Utah had below average snow-covered area as did the basins covering those states (Figure 1, right).
Conditions in context: snow cover
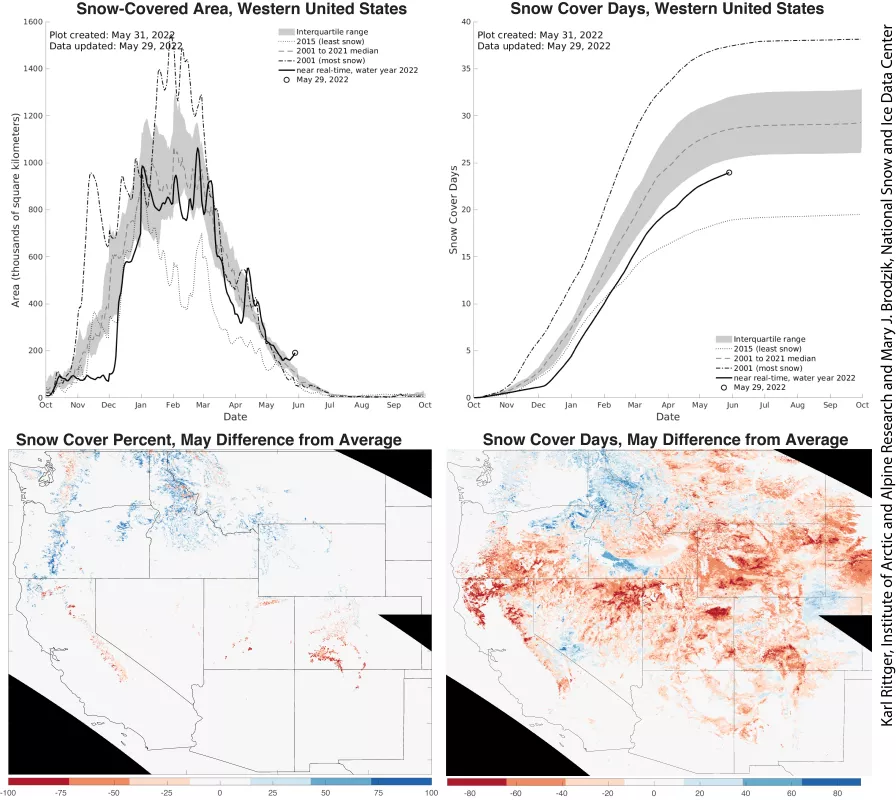
In early to mid-May, the snow-covered area was near average compared to the 22-year satellite record (Figure 2, upper left). However, storms in the second half of the month increased snow-covered area to well above average for this time of year. By the end of the month, snow-covered area had increased from a rank of eleventh to fourth in the 22-year satellite record for May. However, the average snow cover was the result of above average snow in the North and below average snow in the South (Figure 2, lower left). Snow cover days in May followed a trend that began in April with a slightly upwards trajectory compared to earlier in the year (Figure 2, upper right). However, the upward trajectory was not enough to reach the interquartile range and given the increasingly warm conditions, that is not likely to change. Across the western United States, snow cover days were mostly below average but regions in the North, especially Northern Idaho, western Montana, northeast Oregon had more snow cover days than average (Figure 2, lower right).
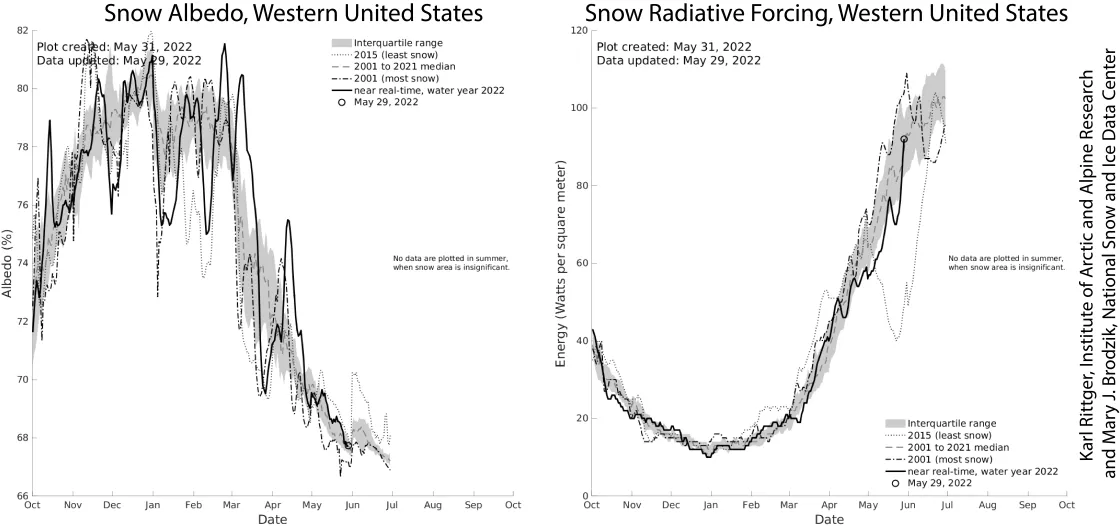
Snow brightness, known as snow albedo, was near average at the start of May but stabilized by mid-May to the top of the interquartile range (the seventy-fifth percentile) after mid-month storms (Figure 3, left). Snow albedo decreased over the remainder of the month. Snow radiative forcing—which increases as dust is blown from dry areas and transported to snowpack and also as dust concentrates at the snow surface during melt—was below average in early May, likely because of storms in late April (Figure 3, right). As the month progressed, snow radiative forcing increased and reached near-average levels before dropping to below average values from new storms. Snow radiative forcing again increased to near average values by the end of the month.
Conditions in context: snow water equivalent (SWE)
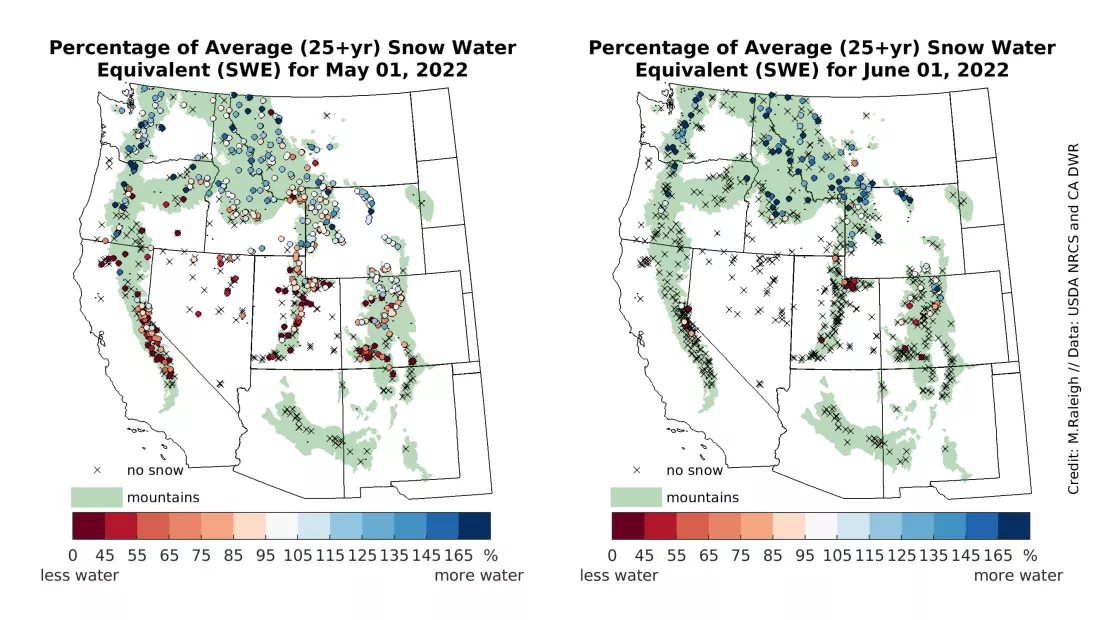
At the start of May 2022, there were 427 monitoring stations reporting a snowpack, which is defined as snow water equivalent (SWE) exceeding 25 millimeters (1 inch) of water depth. There was a regional pattern in SWE, with below average values in more southern locations and above average values in more northern locations (Figure 4, left). By the start of June, the snowpack had melted out at 309 of those 427 stations, leaving 118 stations with snowpack (Figure 4, right). The stations with a remaining snowpack were in more northern locations—such as the Pacific Northwest states (Washington, Oregon, and Northern Idaho) and northern locations in the Missouri Basin (Montana and Wyoming). Over 75 percent of these 118 stations had above average SWE for June 1, a time of year when snowpack is typically shallow or absent at many locations. The snowpack has disappeared at all SWE monitoring stations in Nevada, Arizona, New Mexico, and South Dakota.
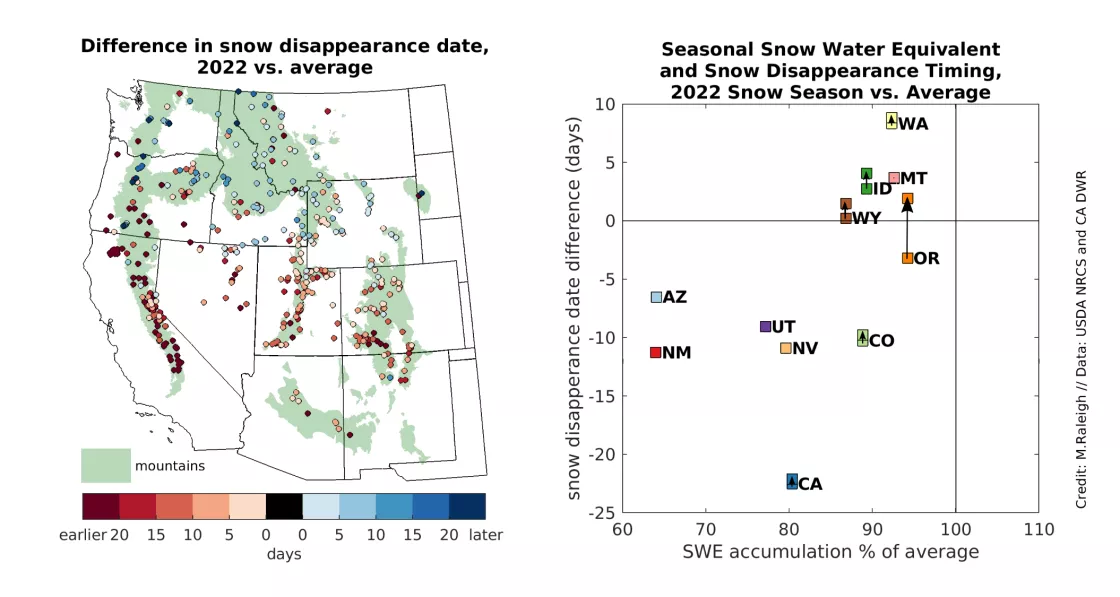
By June 1, snowpack had disappeared at the majority of SWE stations in the western United States, but most stations that still have snow have above average values. To contextualize the timing of snow disappearance at the stations that no longer have snow, the year 2022 was compared to the long-term average of snow disappearance date for each station record. Stations in the southern part of the domain tended to show earlier-than-average dates of snow disappearance, while those in the north tended to show later-than-average dates (Figure 5, left). Not surprisingly, some areas with below average SWE through winter had early snow disappearance, with the California Sierra Nevada being a clear example. Early snow disappearance was also found in some locations despite having near average SWE at maximum accumulation. A prime example is the San Juan Mountains in southwestern Colorado (Figure 5, left). This likely resulted from high snowmelt rates in April and May (Figure 8, right), which is attributed to dust-on-snow events that provided extra energy for melting snowpack (see next section).
On a state average basis, SWE accumulation was below average in all states, while the majority of states had early snow disappearance compared to average by about nine days (Figure 5, right). Because some stations—particularly to the north—still had snow remaining as of June 1, no final snow disappearance dates were recorded. Using statistical analysis, snow disappearance was estimated at these stations based on historical relationships with their peak SWE values, peak SWE dates, and spring snowfall amounts. Estimates for final state averages of snow disappearance are shown in Figure 5 (right), indicated with the arrow and second markers for the states where snow still remains. Recent late season snow which occurred after peak SWE will likely extend the snow disappearance date for some of these states. While snowmelt in the coming days and weeks adds uncertainty to these estimates, SWE stations in Oregon, Idaho, Montana, Wyoming, and Washington will likely end the season with later-than-average snow disappearance timing.
Large dust storms in Colorado darken snow, but recent snow storms temporarily abate the rapid melt
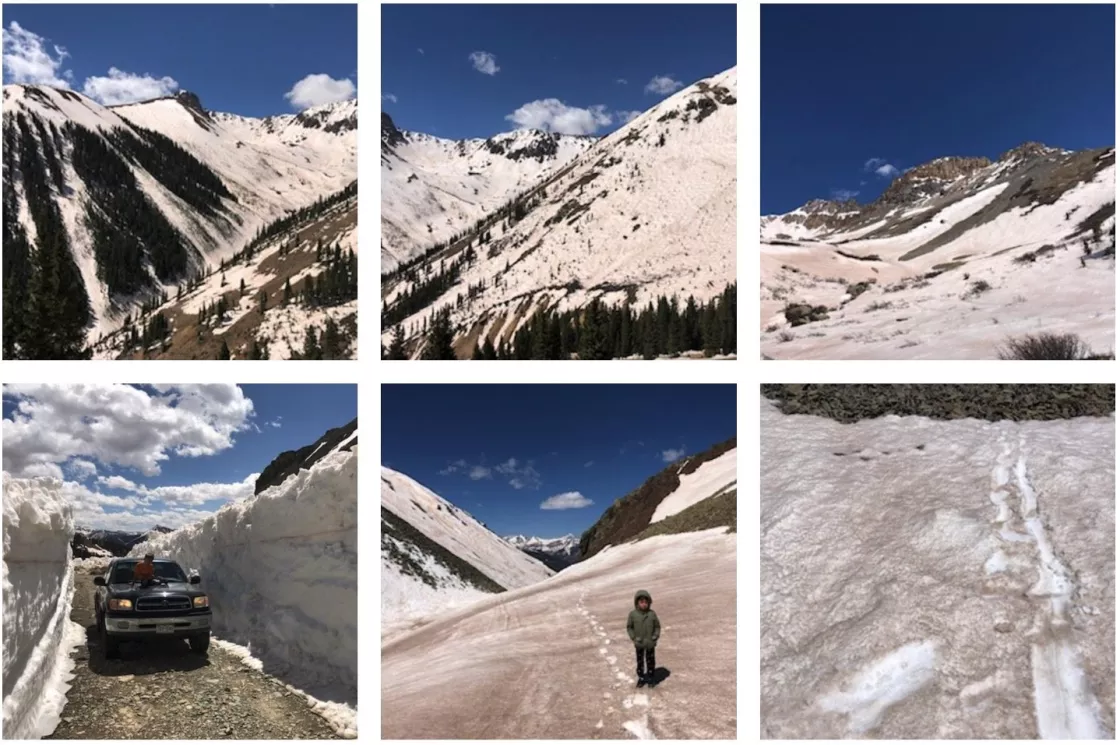
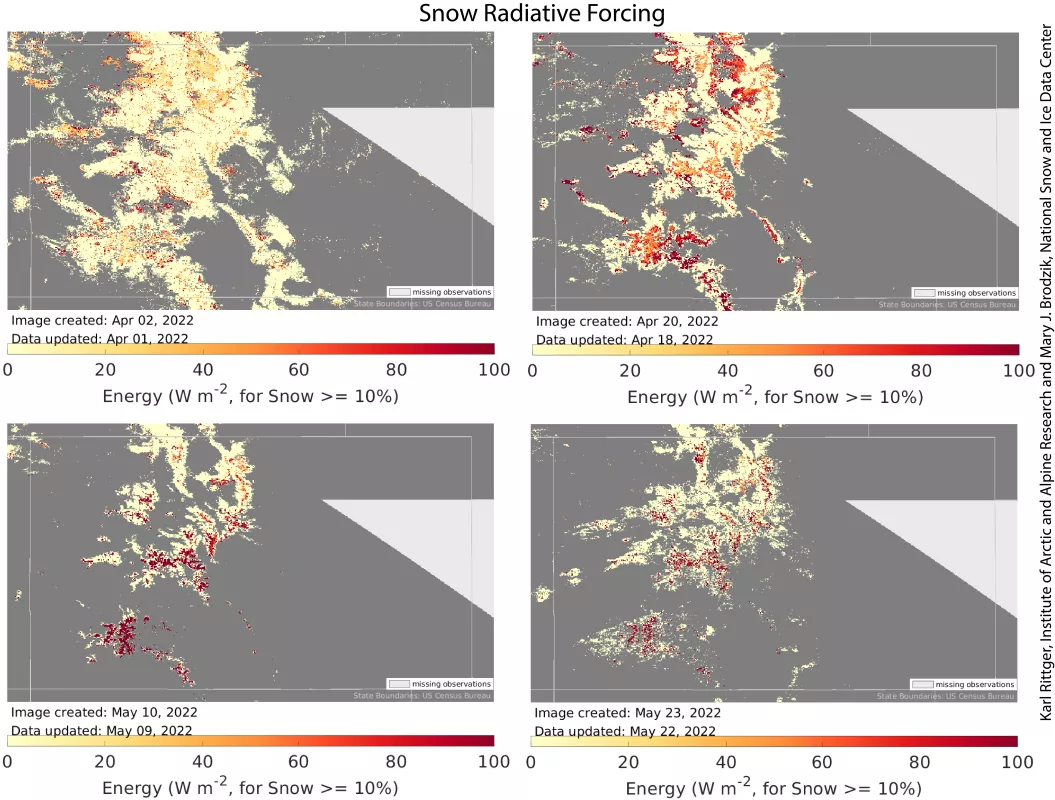
In March 2022, the Snow Today team added snow albedo and snow radiative forcing satellite observations to our website and analysis. These variables are rarely estimated by scientists because of the complexity in differentiating and quantifying the contribution of albedo decreases from snow grain growth and dust which both make the snow darker in satellite images and can increase snowmelt rates. The May article noted above average snow radiative forcing across the western United States and snow-covered areas significantly impacted by dust in the San Juan Mountains in Colorado (Figure 6).
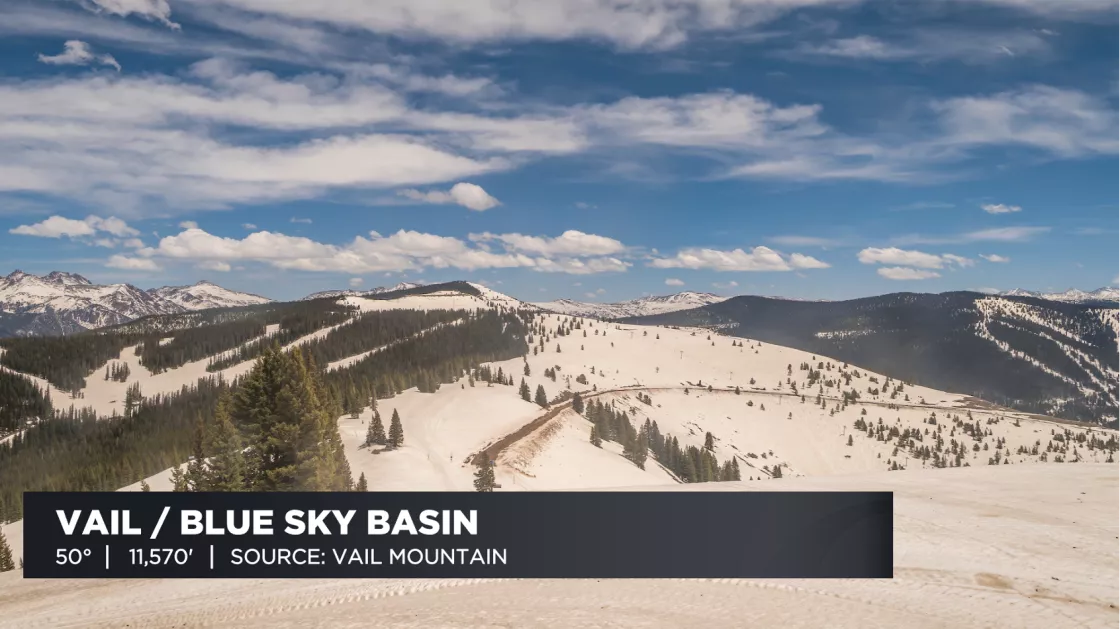
Our analysis of snow albedo was featured on the Center for Snow and Avalanche Studies (CSAS) Colorado Dust-on-Snow program (CODOS) on May 14 where the Snow Today albedo maps clearly showed the impact of dust on snow. These dust storms reached across the state, impacting ski resorts as reported by local news channels including CBS4 Denver (Figure 7). CODOS rated dust severity as “max” this season, meaning dust was on or near the snow surface all of the spring, which has not occurred since 2013.
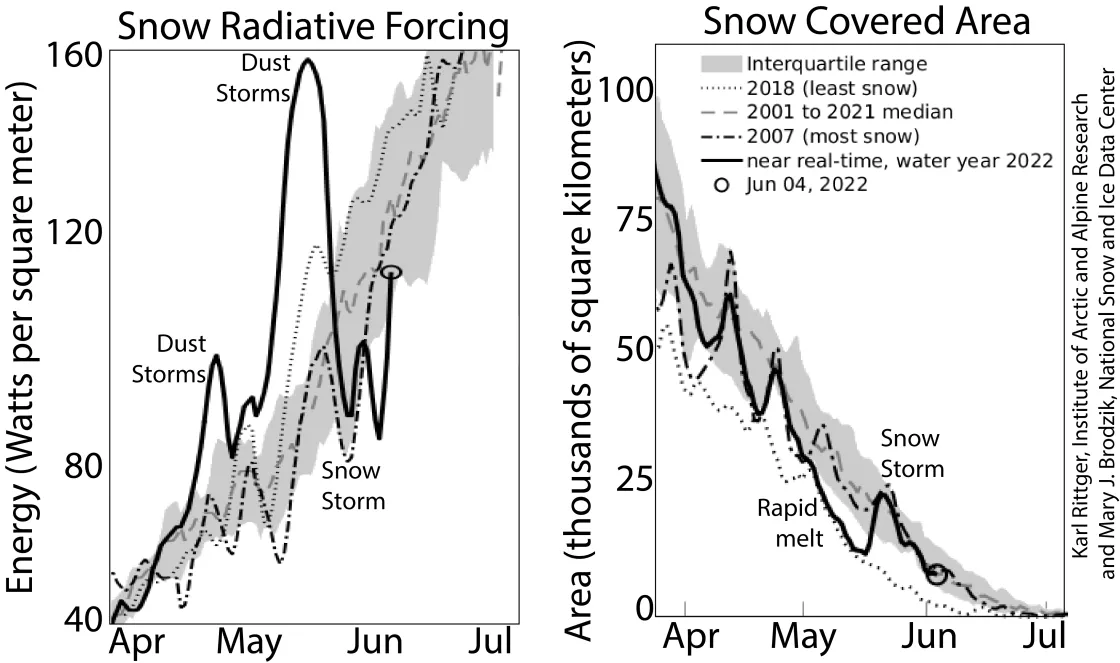
In the satellite data, two dust storms in Colorado are clearly visible when averaging values across the state (Figure 8, left). Snow radiative forcing on April 1 was average across the entire state (Figure 9, upper left). Multiple dust storms in mid-to-late April increased snow radiative forcing from near average at 40 Watts per square meter to almost 100 Watts per square meter on April 18 (Figure 9, upper right). Another small dust storm on May 1 and 2 increased snow radiative forcing above the interquartile range. This small dust storm was followed by a set of dust storms with the most extensive geographical coverage of the year, impacting not just the San Juan mountain range but all of Colorado including, for example, the Vail ski resort (Figure 7 and Figure 9, lower left). These dust storms increased snow radiative forcing to nearly 160 Watts per square meter and in combination with the previous dust storms resulted in rapid melt and snow cover depletion until a state-wide snow storm buried the dusty snow after mid-May (Figure 8, right). While conditions have temporarily stabilized, rapid melt is expected in June as the dust accumulates at the surface in the next week or two.
A farewell to the 2021 to 2022 snow season and plan for the coming year
As we look towards summer, we are hopeful that wet conditions in the North will alleviate western droughts and that drier conditions in the South will be alleviated by rainfall. Daily images and graphs will continue to update as the rest of the western United States snowpack melts. Our team will resume writing articles starting January 2023.
This summer our team will work on building an application for our website to allow users to interact with the site in ways not previously possible. The new application will also allow us to expand coverage to new regions such as all of North America, Greenland, and High Mountain Asia as data for these regions become available. It will eventually allow regional analyses like our current State and HUC2 subsets over a much finer scale set of regions. We will also work on data processing for a second model (SPIRES, Bair et al, 2020) for our remotely sensed snow variables which will increase our confidence in data we currently create and display (MODSCAG, Painter et al, 2009; MODDRFS, Painter et al, 2012; Gap-Filling methods, Rittger et al, 2020) and provide users with multiple sources of data.
Karl Rittger of INSTAAR and Mark Raleigh of Oregon State University acknowledge the many people that helped shape the vision of the project, get it off the ground running, and improve it, resulting in secured funding for an additional three years: Mary J. Brodzik, Mark Serreze, Agnieszka Gautier, Keith Musselman, Timbo Stillinger, Ned Bair, Leslie Goldman, Alex Michell, Merritt Turetsky, Thomas Painter, Mary Ellen Byers, Drew Slater, Ted Scambos, Jeff Deems, Audrey Payne, Suzanne Craig, Daniel Crumley, Doug Young, Chris Torrence, Donna Scott, Kate Heightly, Joni Reeves, Andrew Barret, Lisa Booker, and several other folks at NSIDC, CIRES, and INSTAAR at the University of Colorado Boulder.
