Arctic sea ice is approaching its seasonal peak, with below-average sea ice extent in the Barents Sea and the Sea of Okhotsk, but near-average ice extent elsewhere. Antarctic sea ice extent set a record low minimum for the satellite data era. However, two regions of high interest to researchers remained locked in ice: Thwaites Glacier and the central Weddell Sea.
Overview of conditions
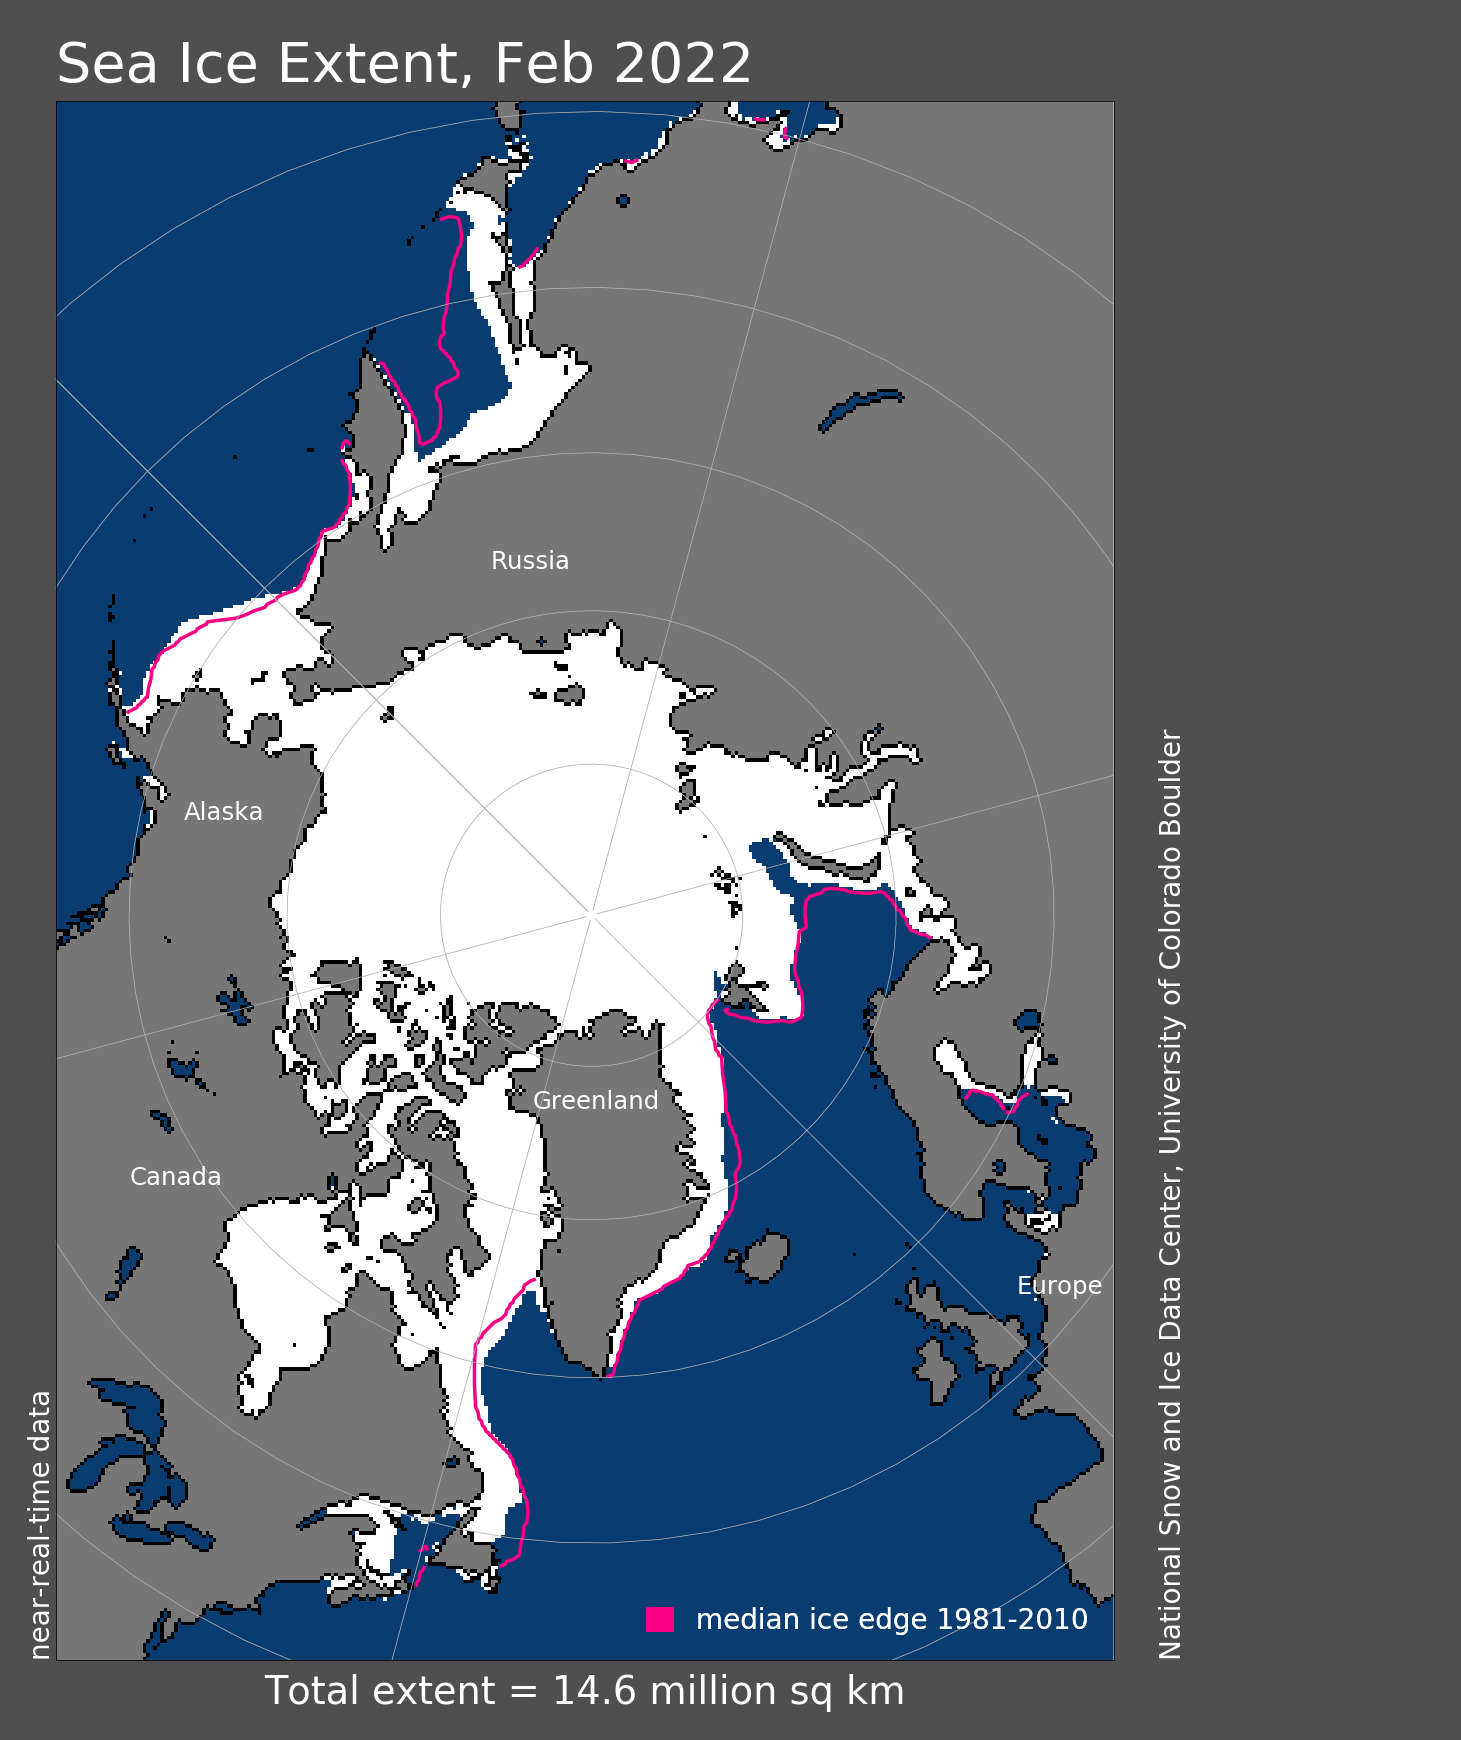
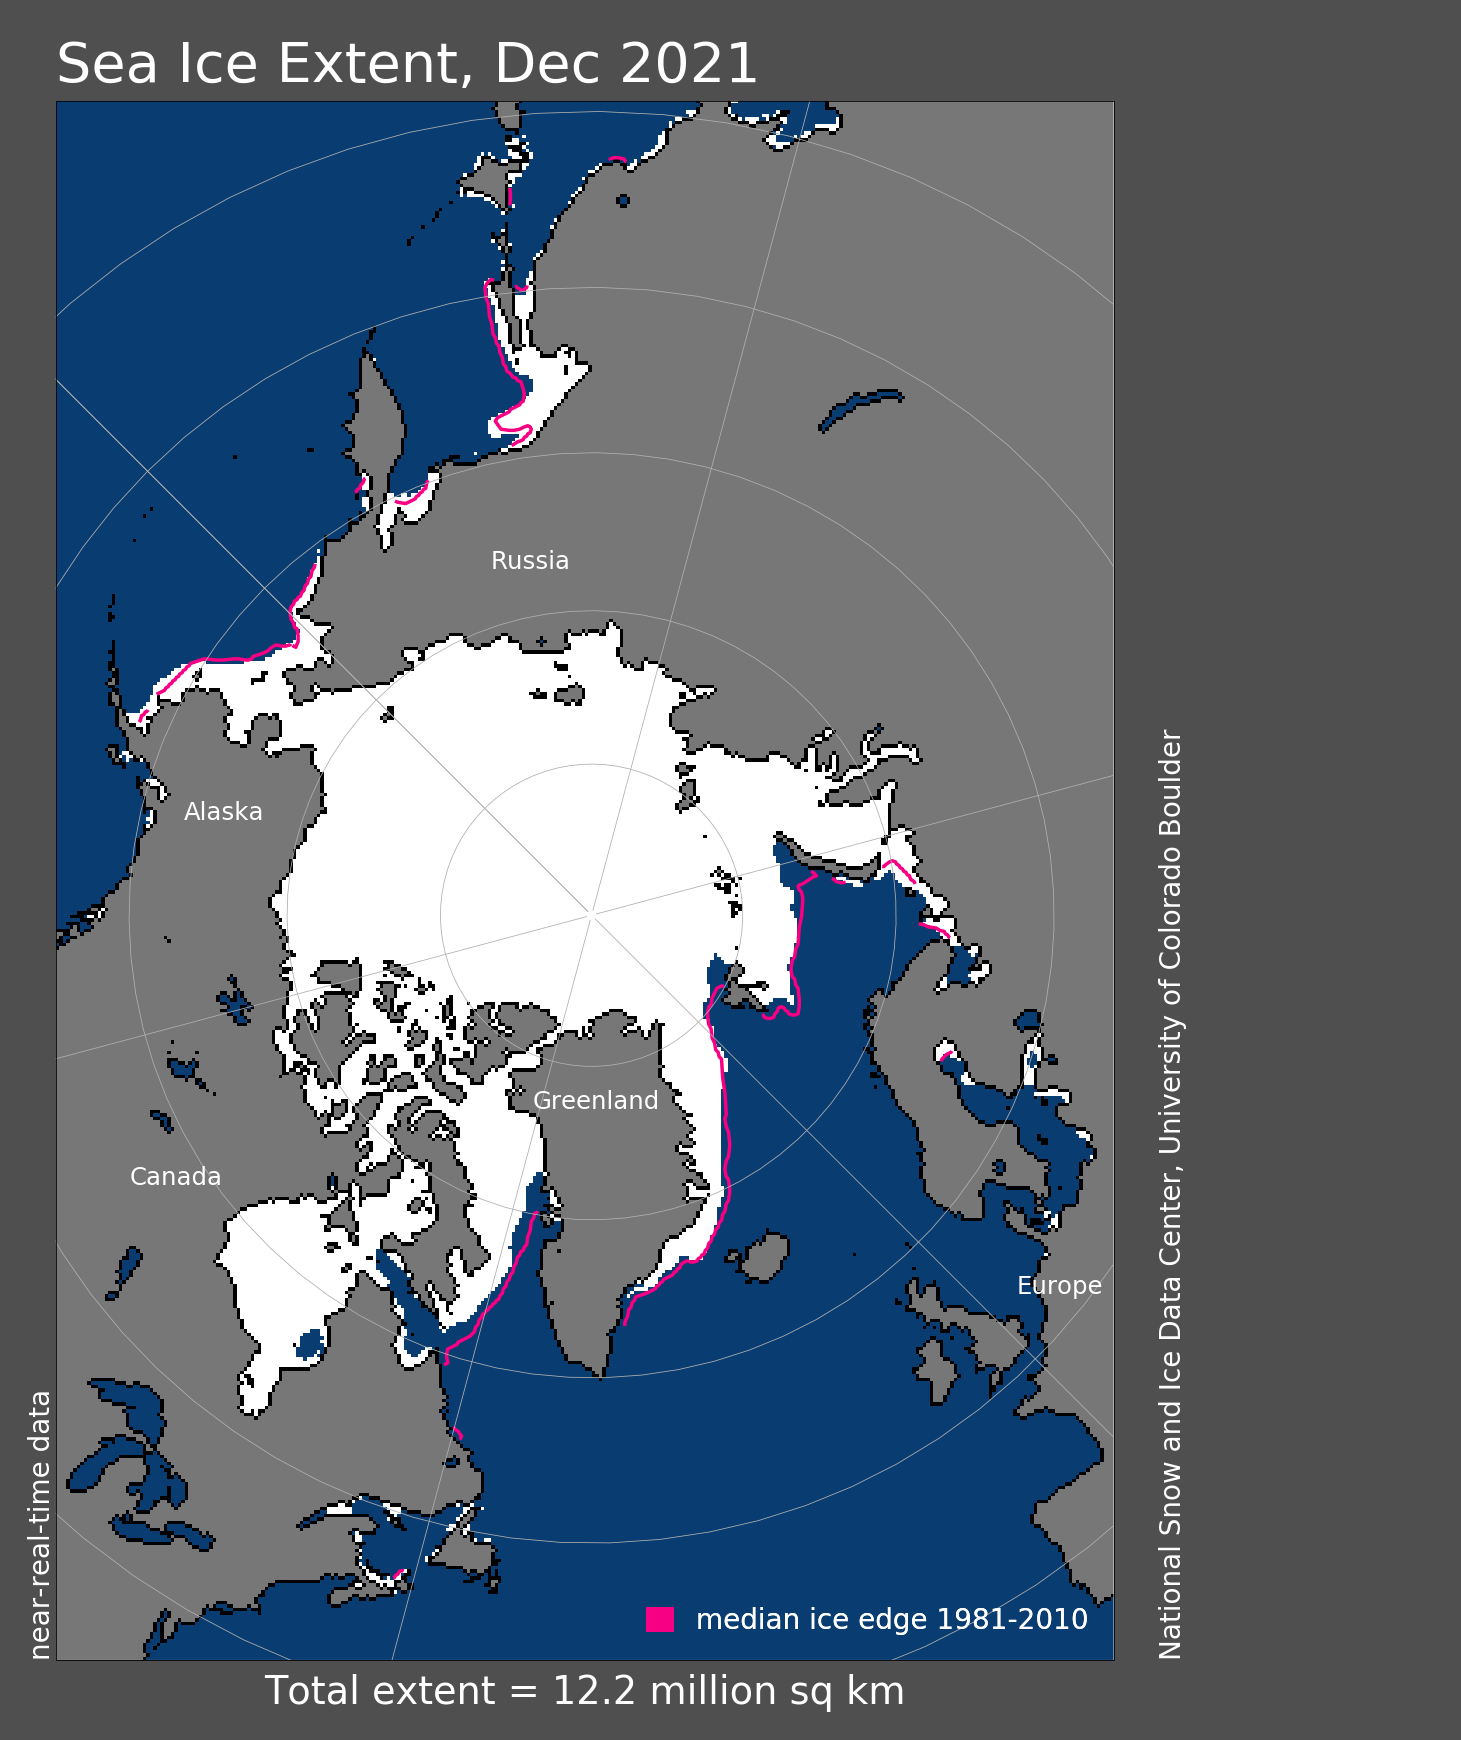
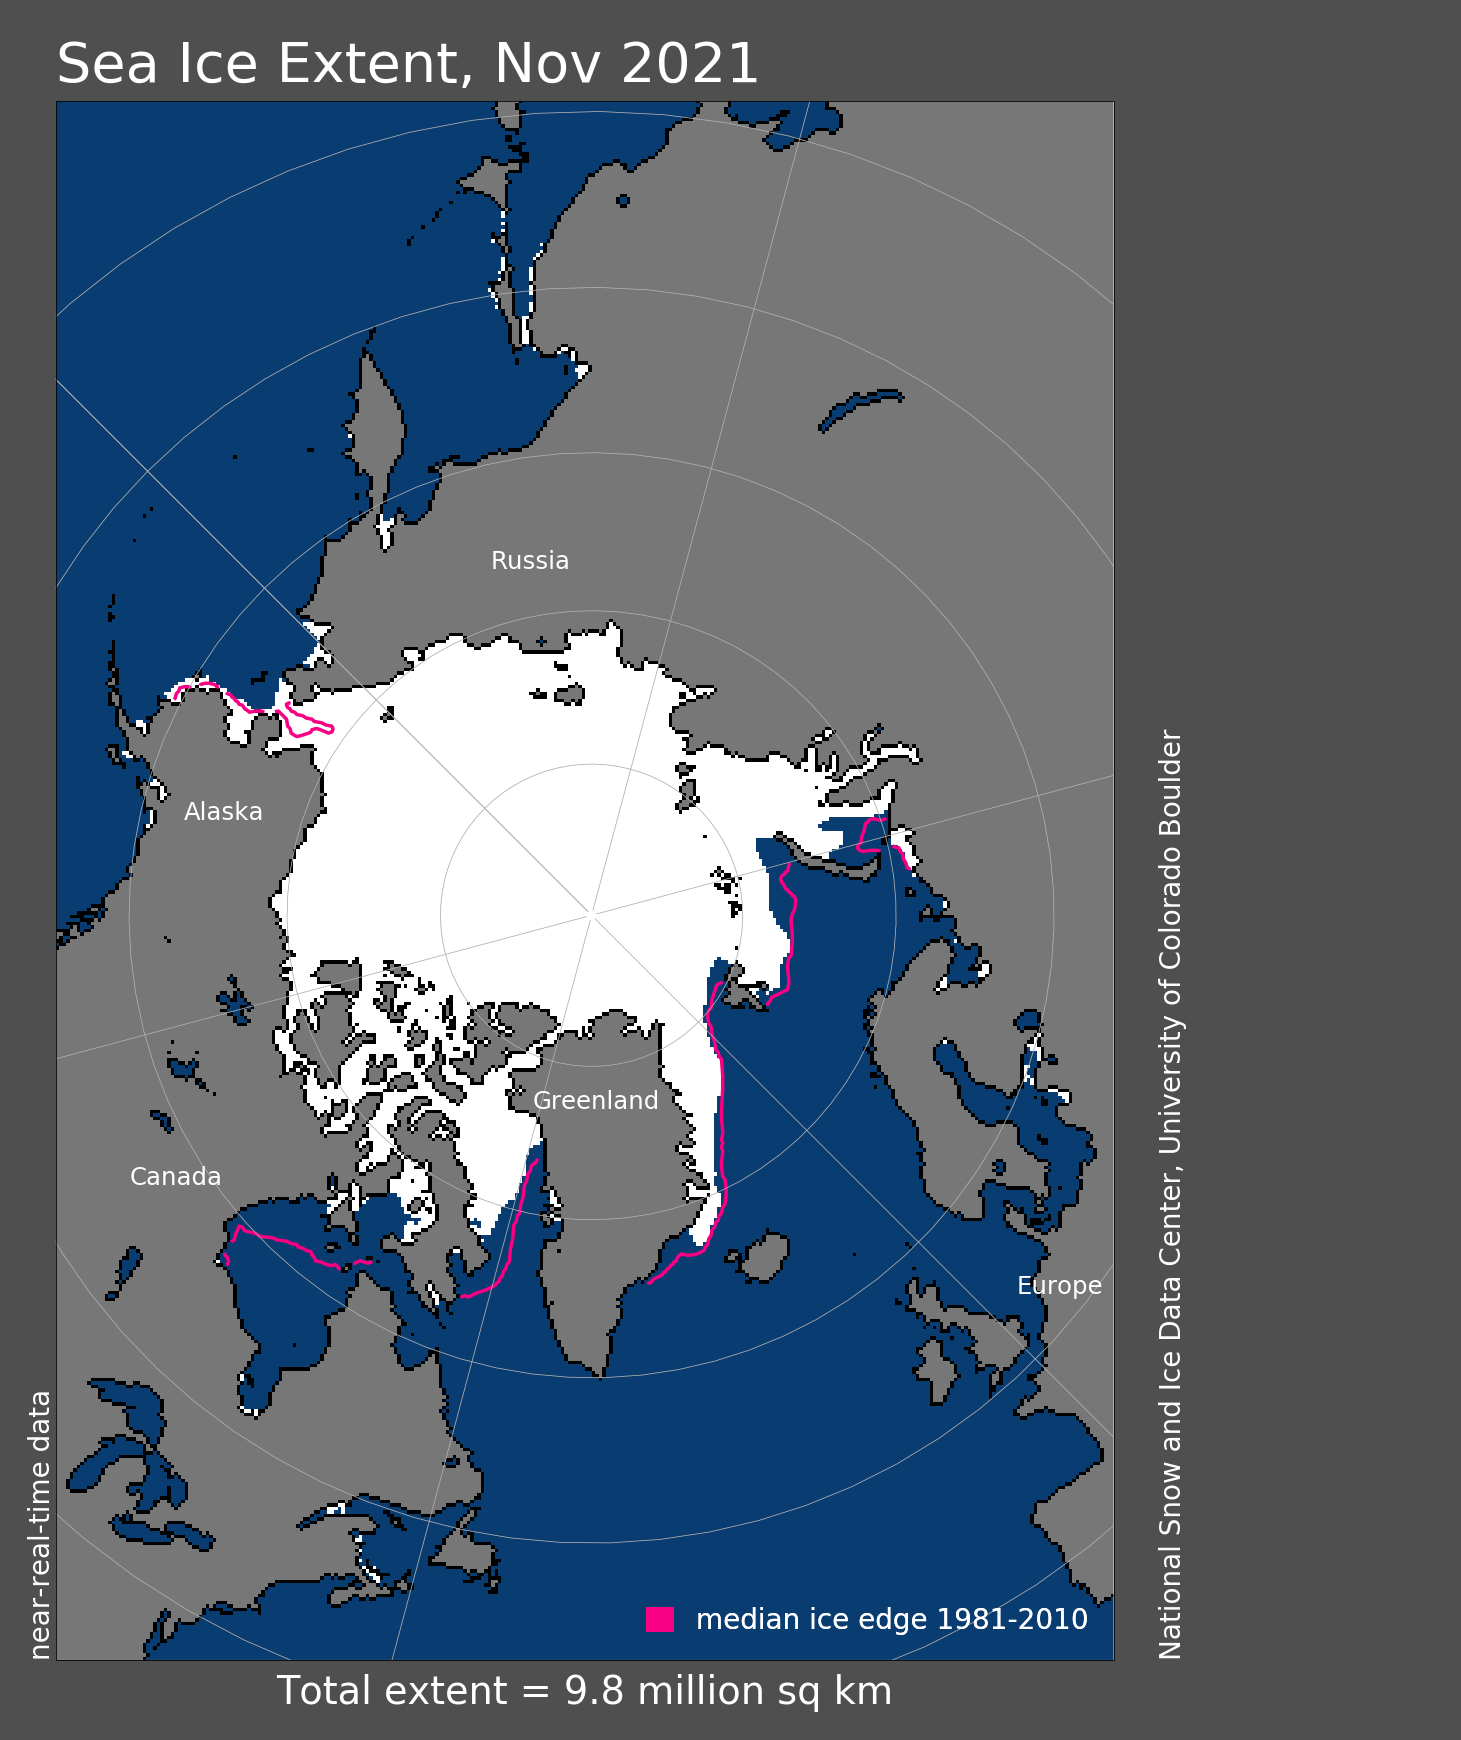
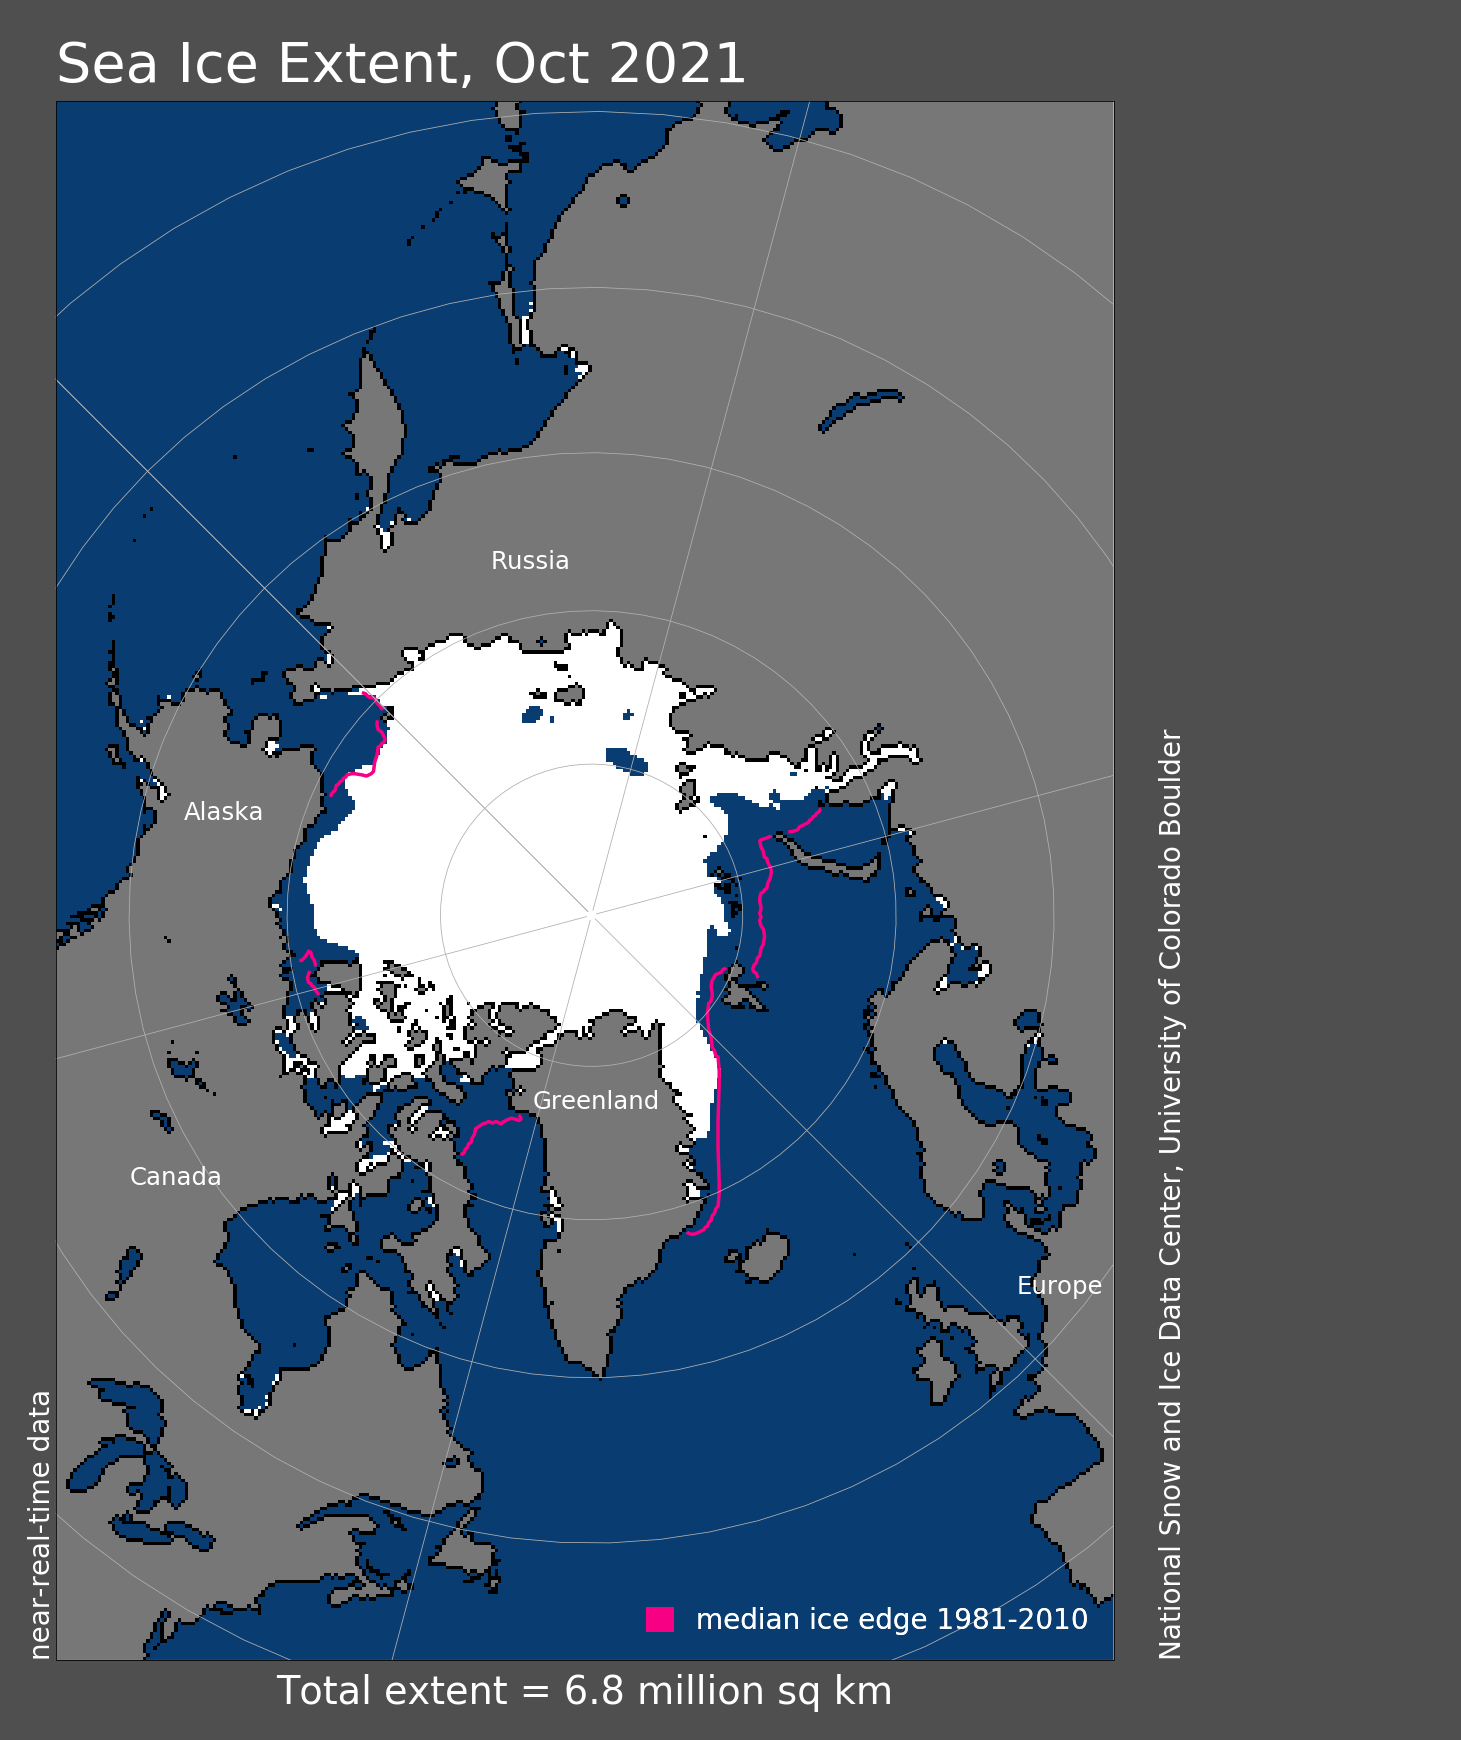
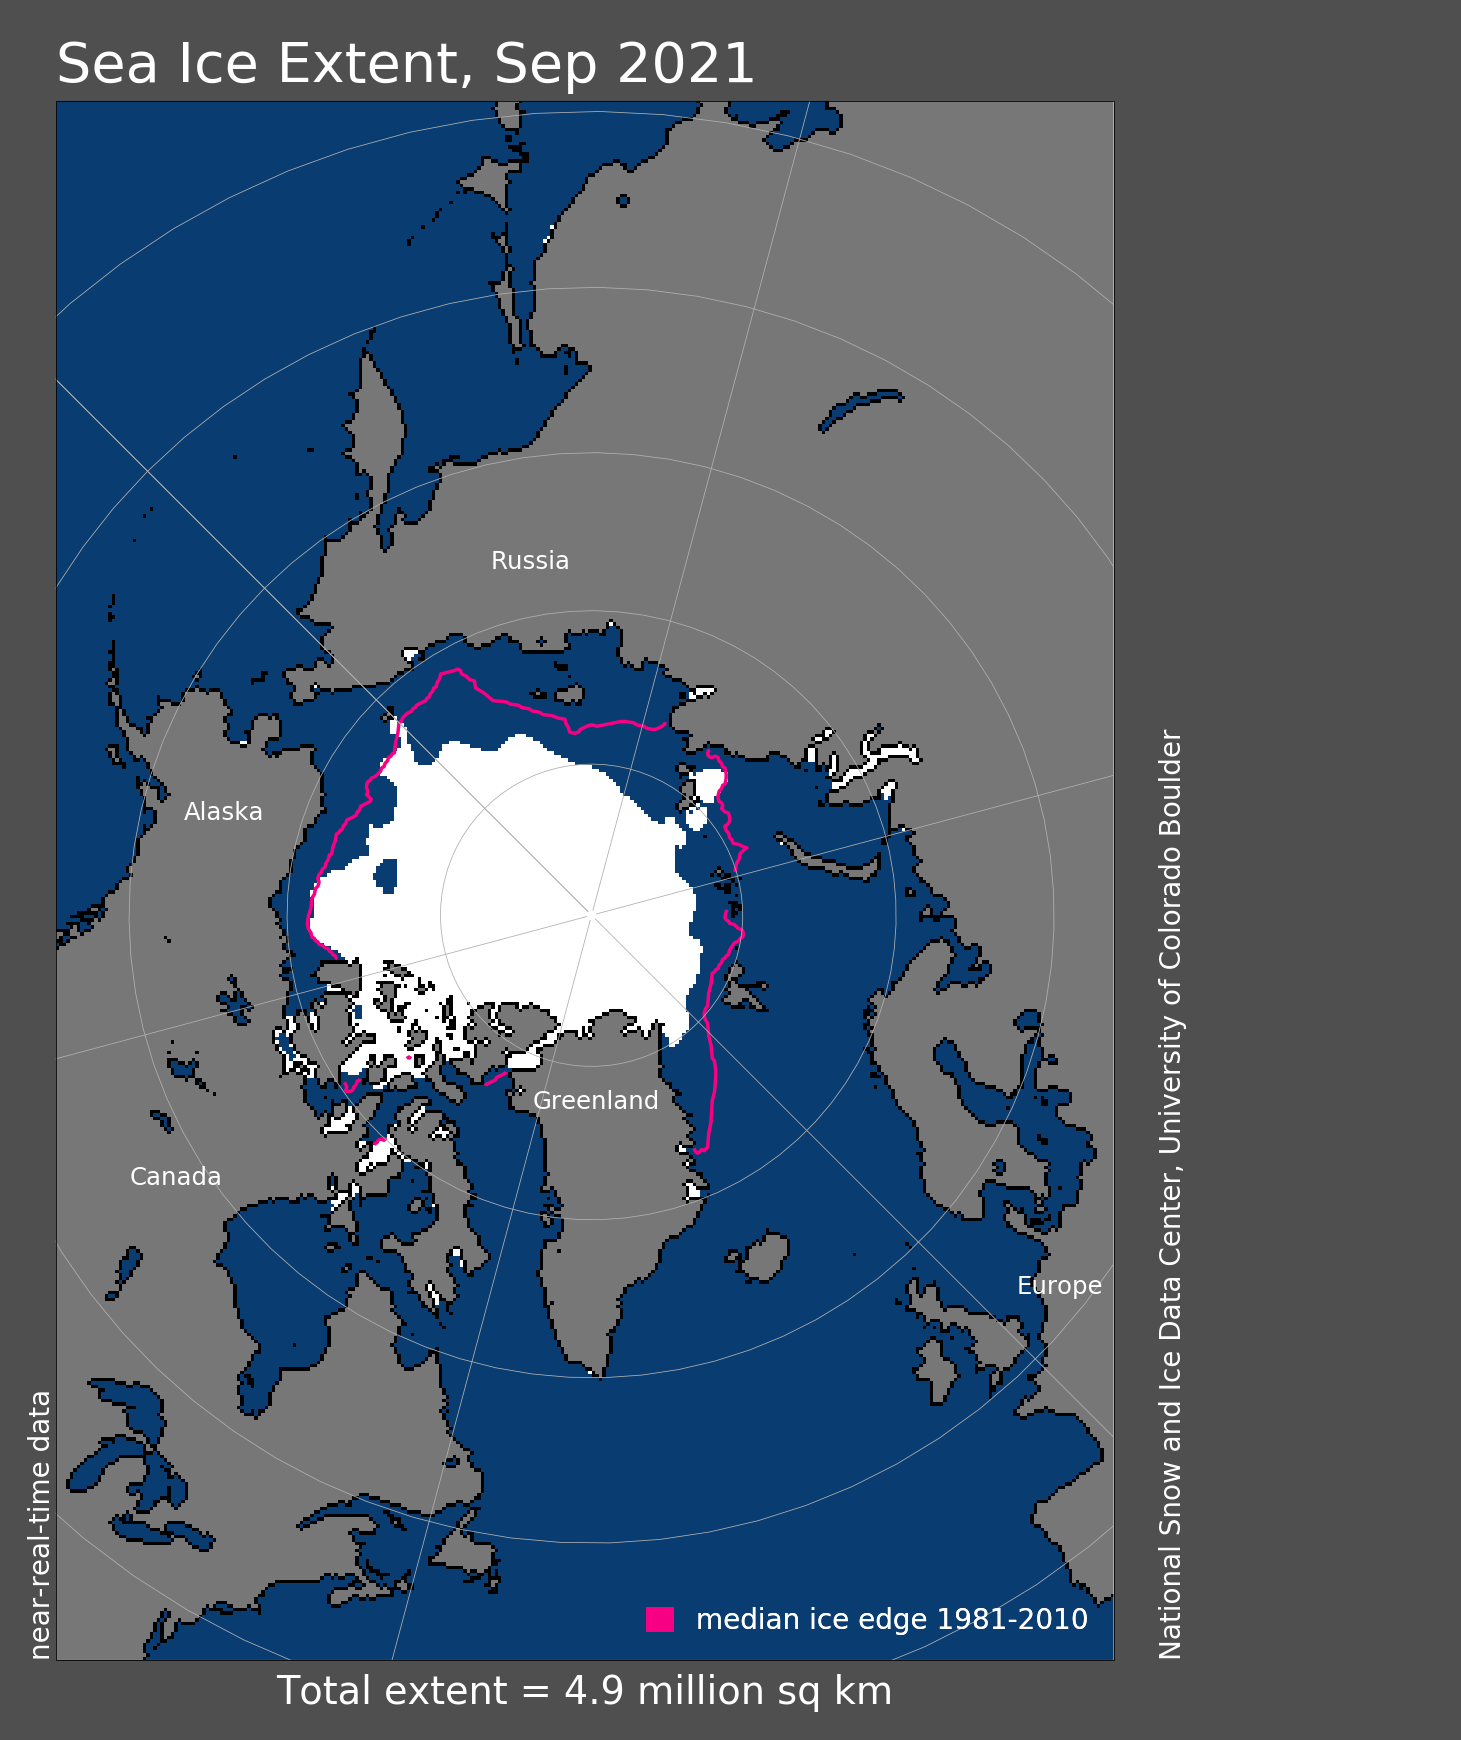
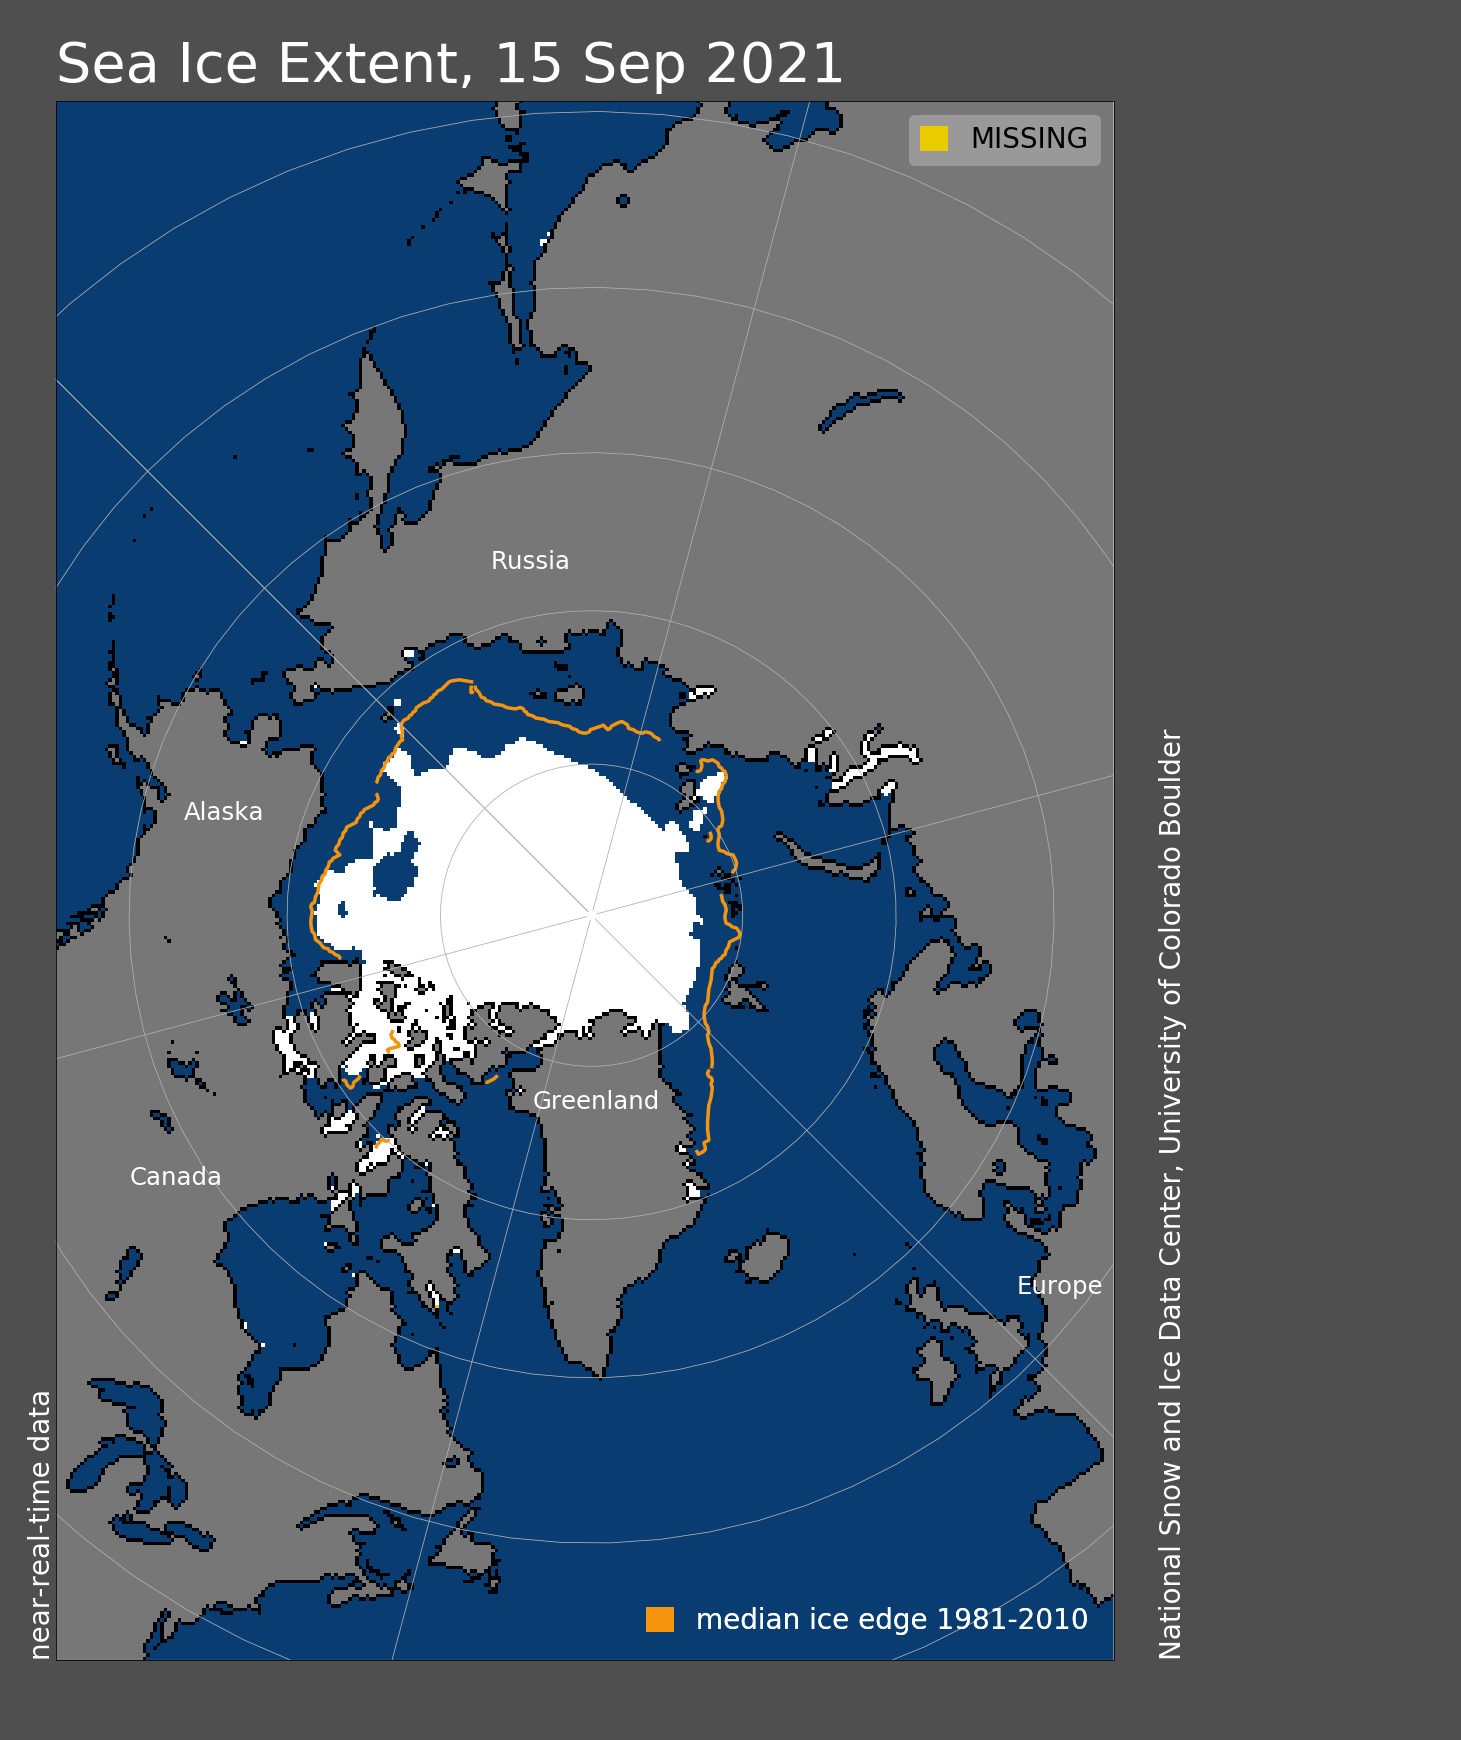
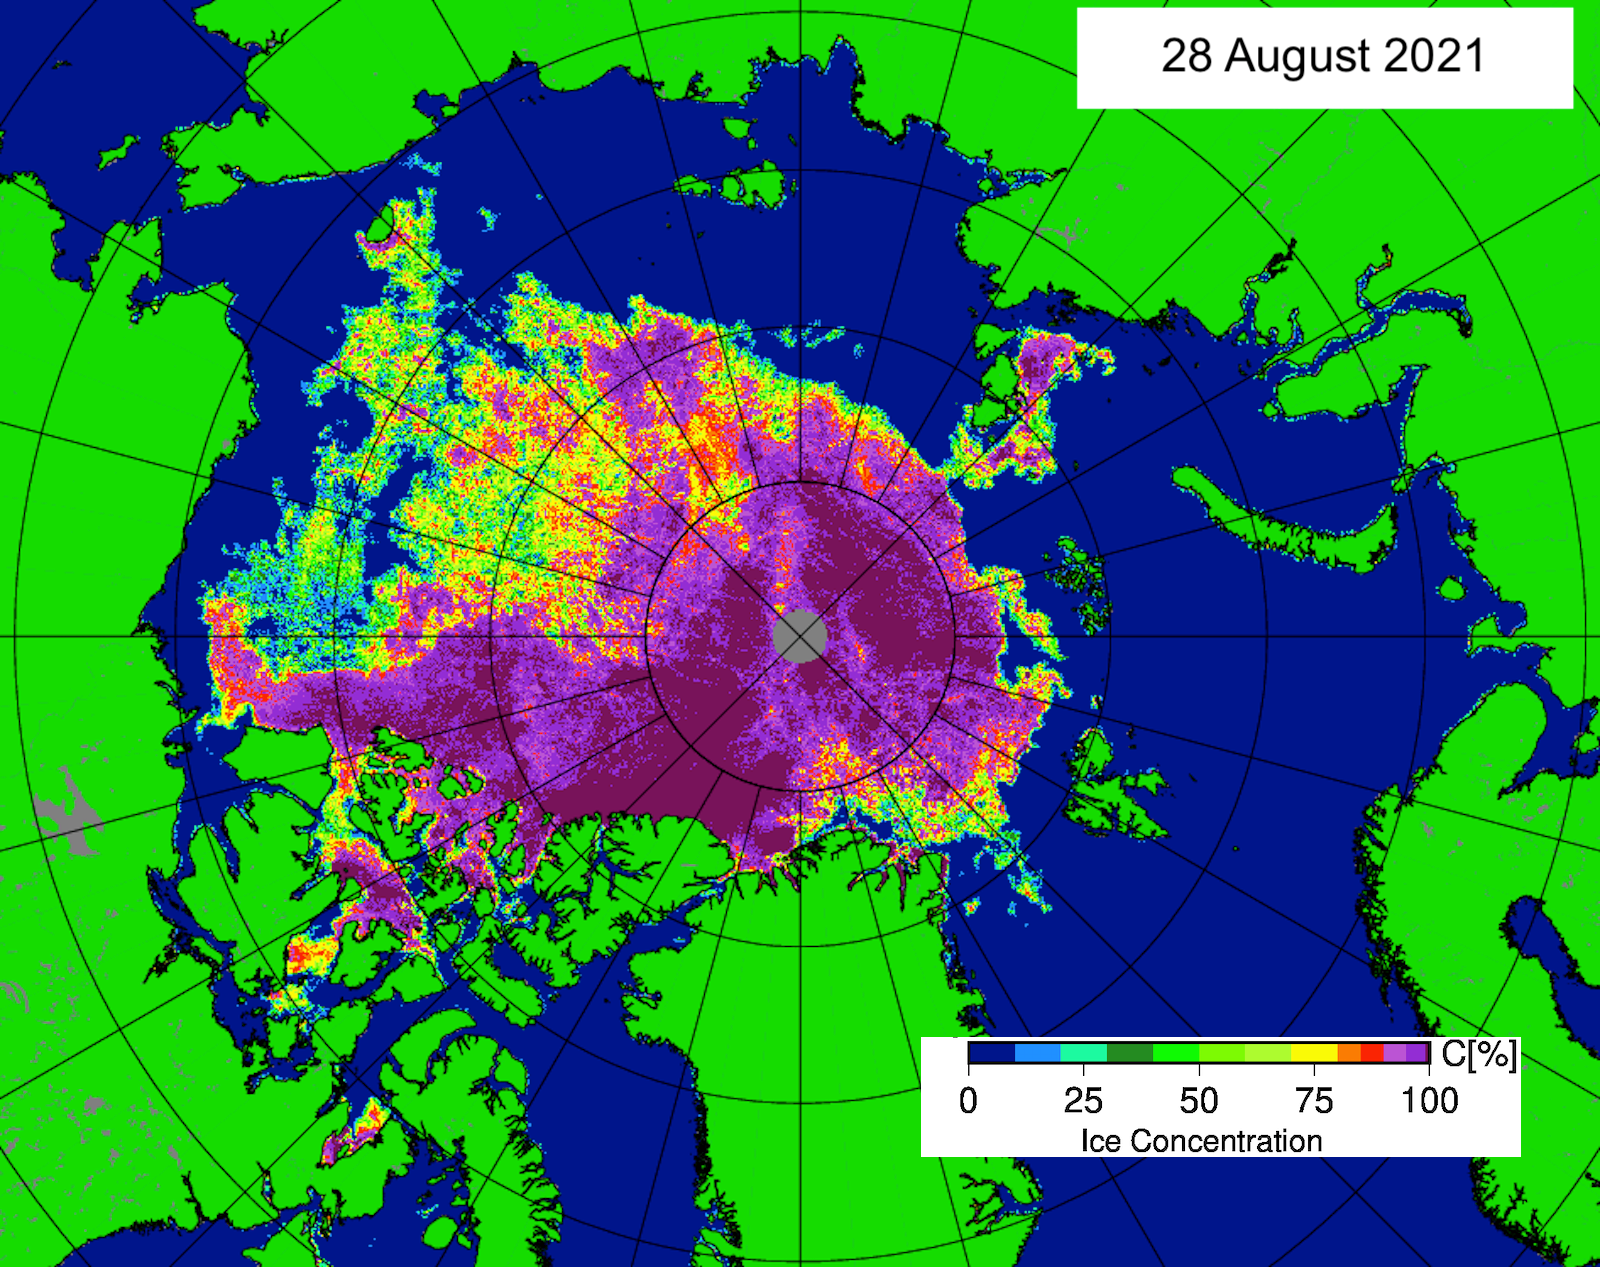
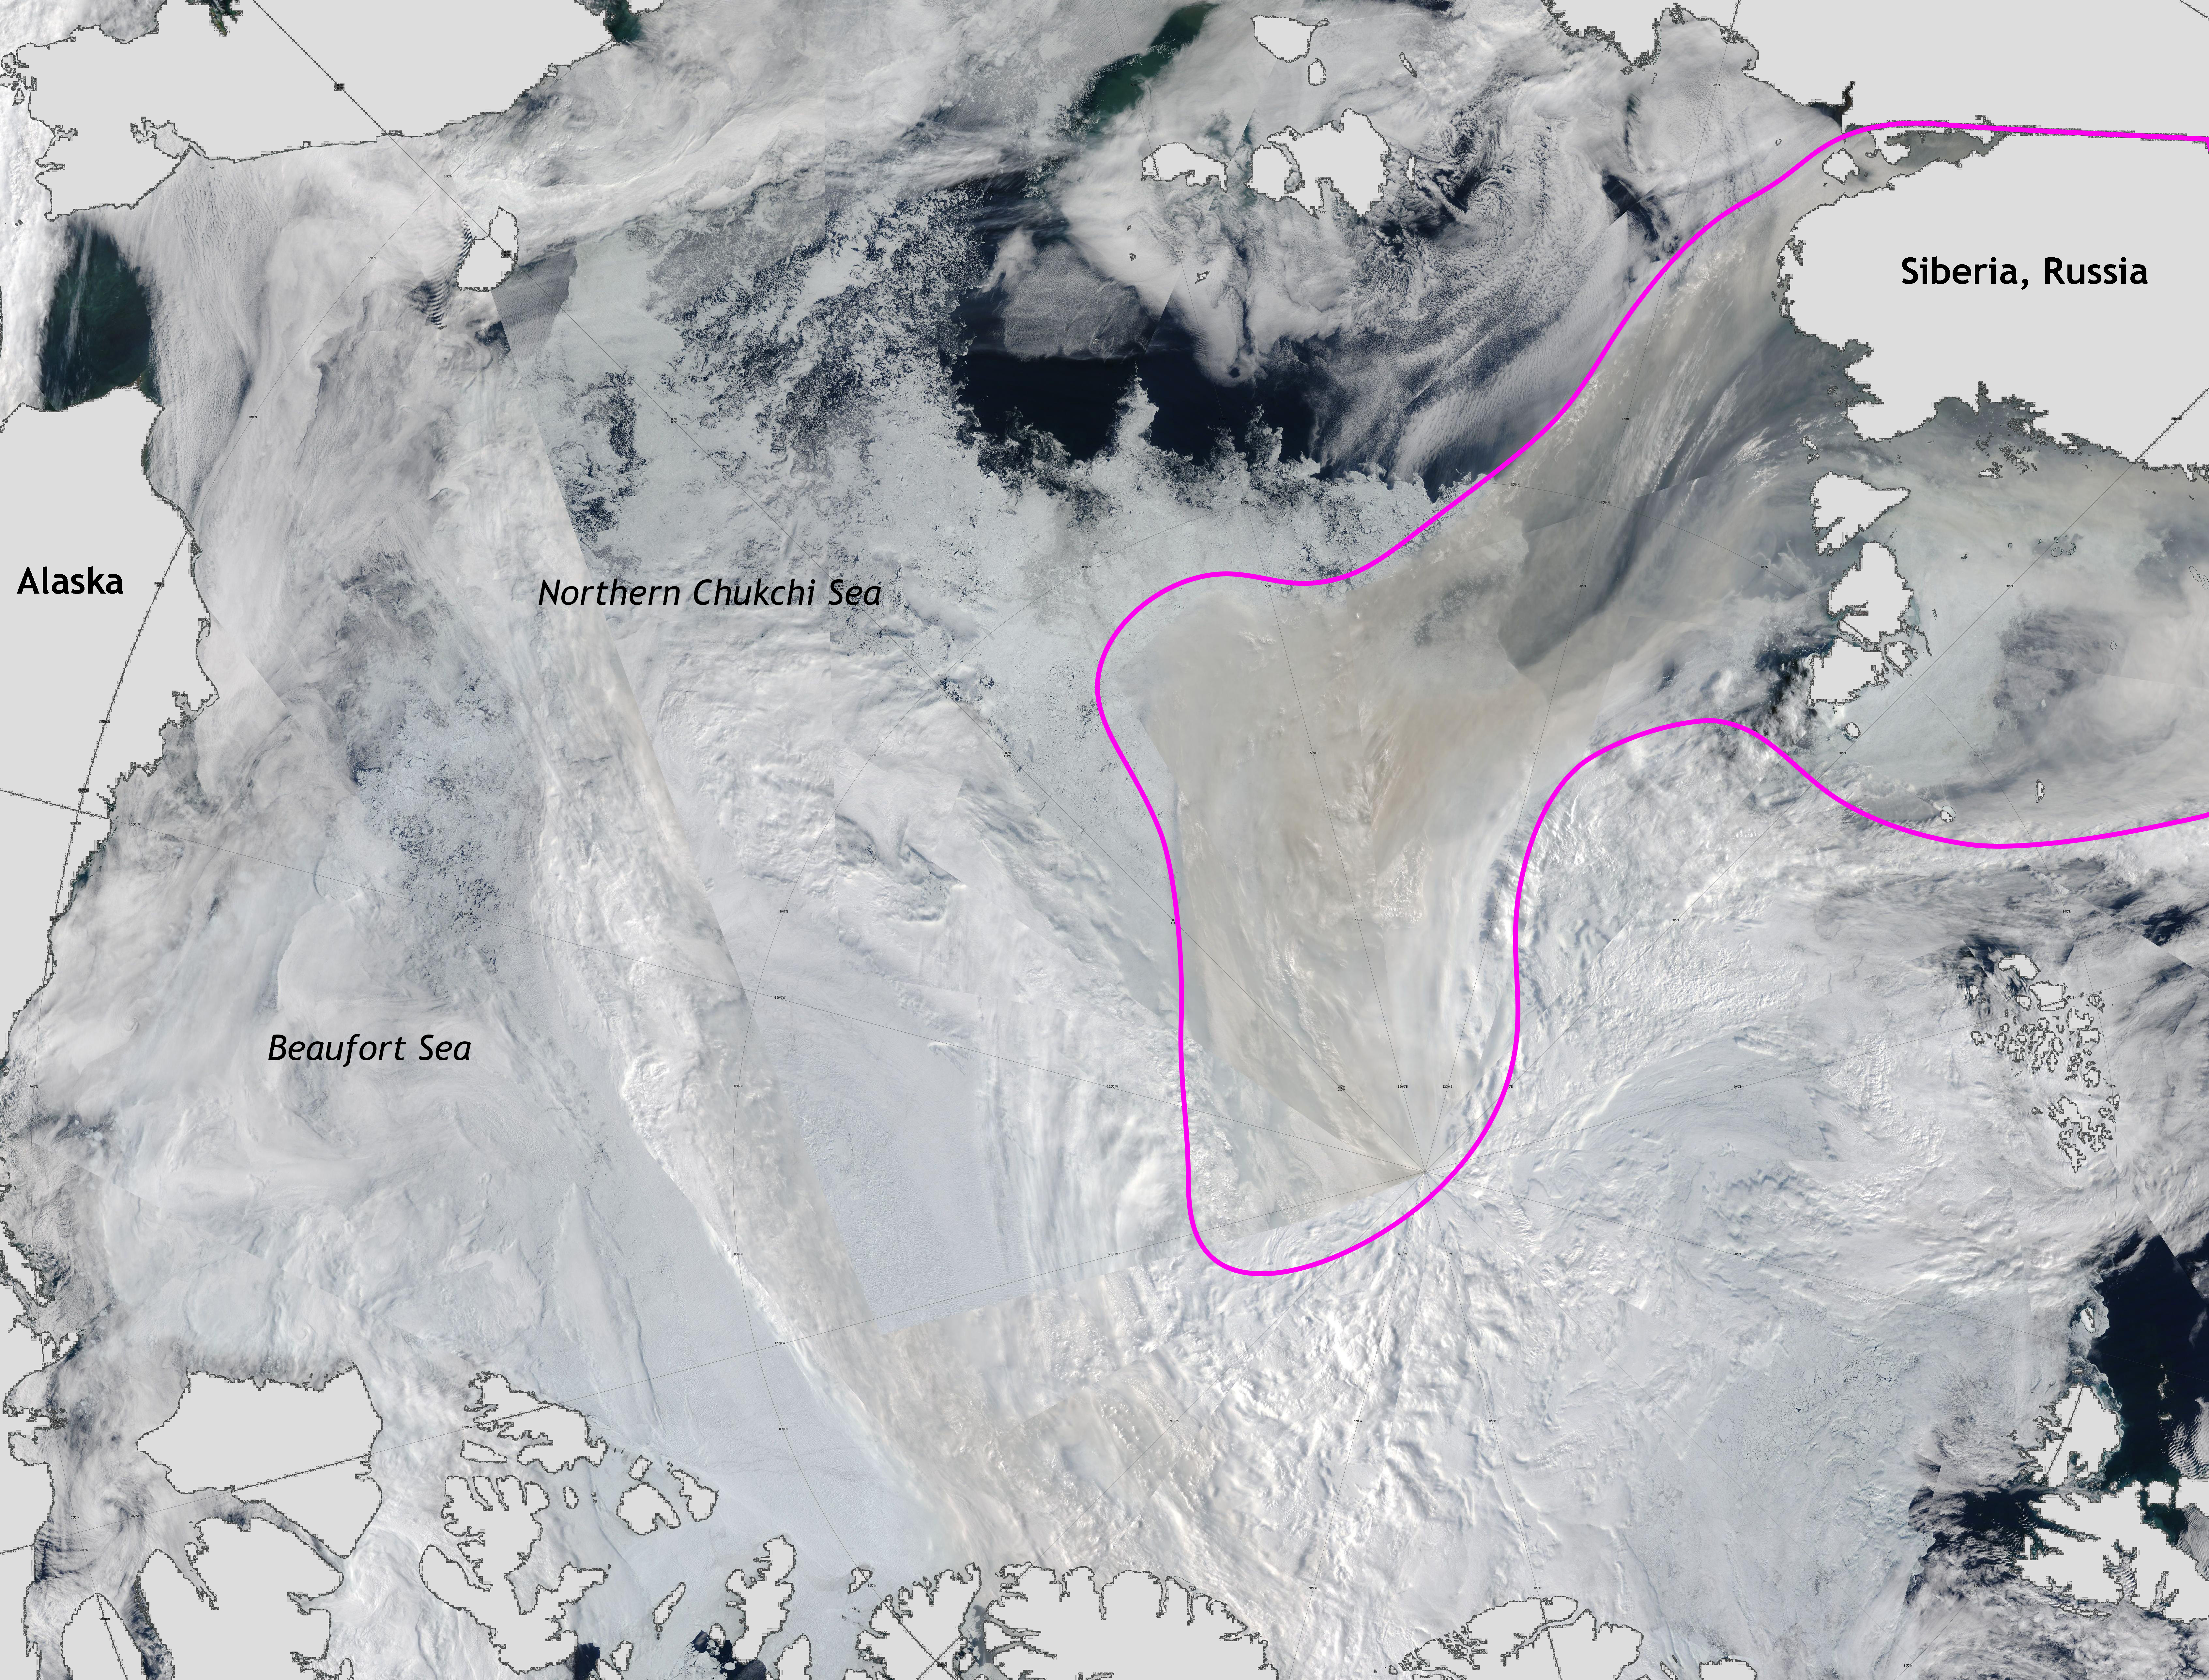
Figure 1a. Arctic sea ice extent for February 2022 was 14.61 million square kilometers (5.64 million square miles). The magenta line shows the 1981 to 2010 average extent for that month. Sea Ice Index data. About the data
Credit: National Snow and Ice Data Center
High-resolution image
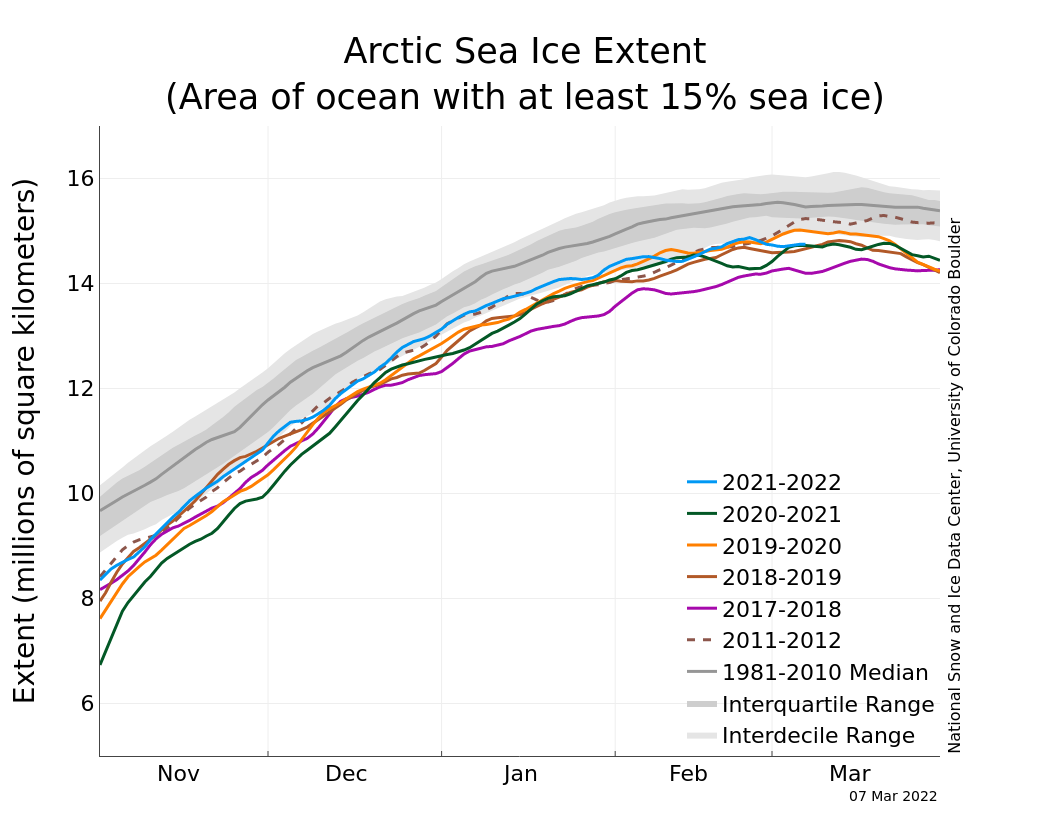
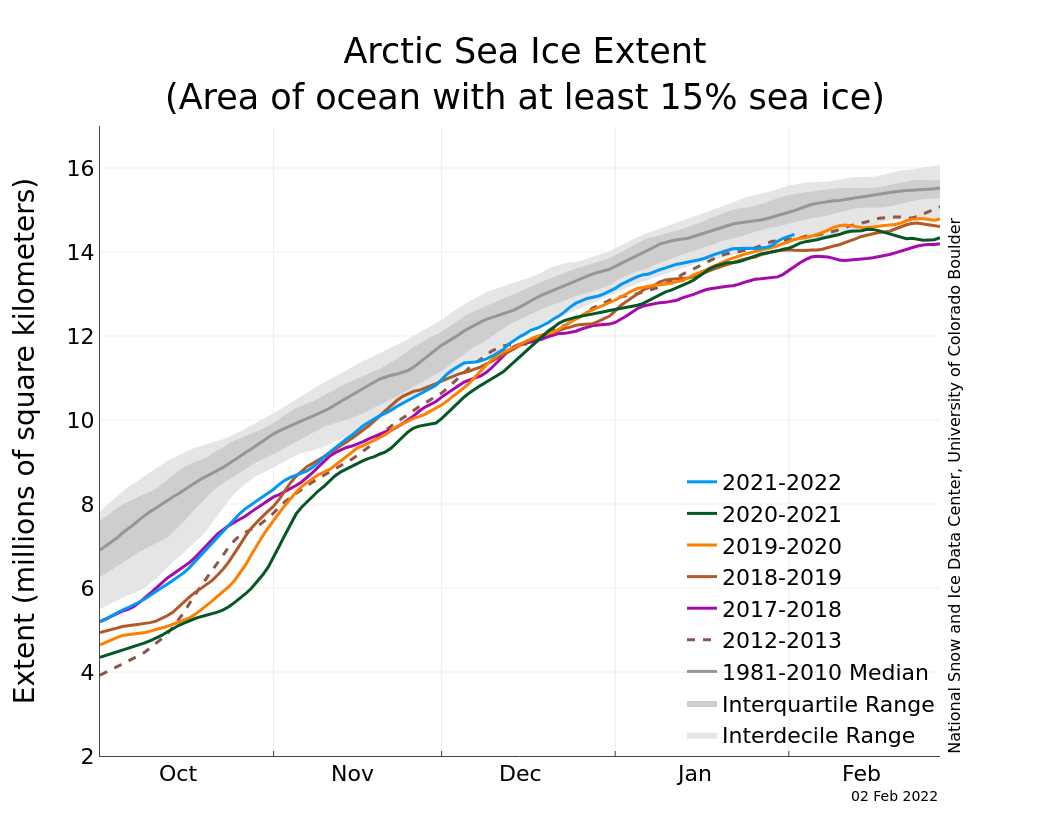
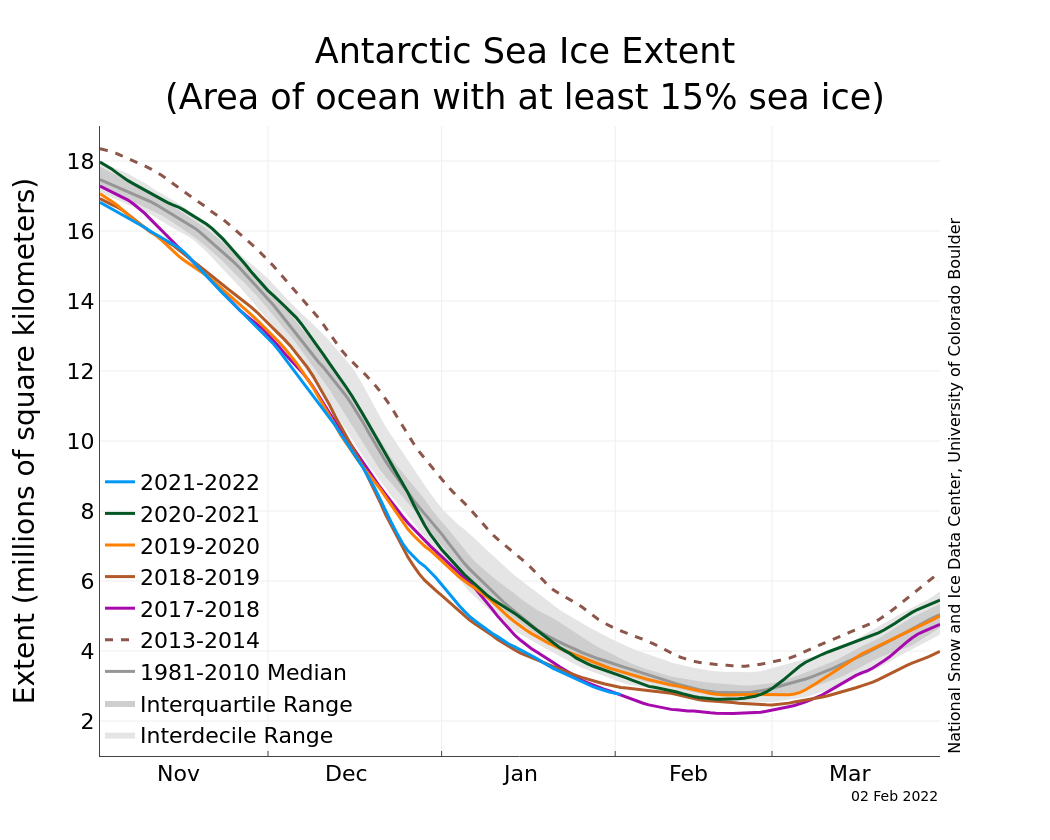
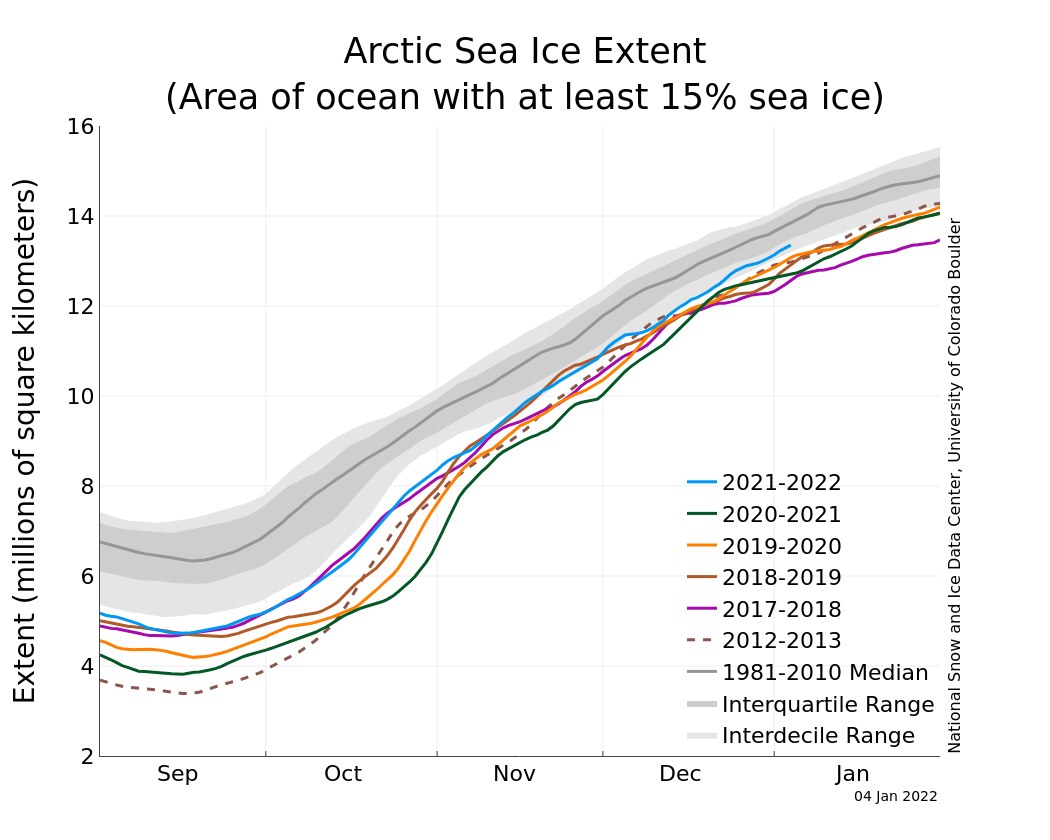
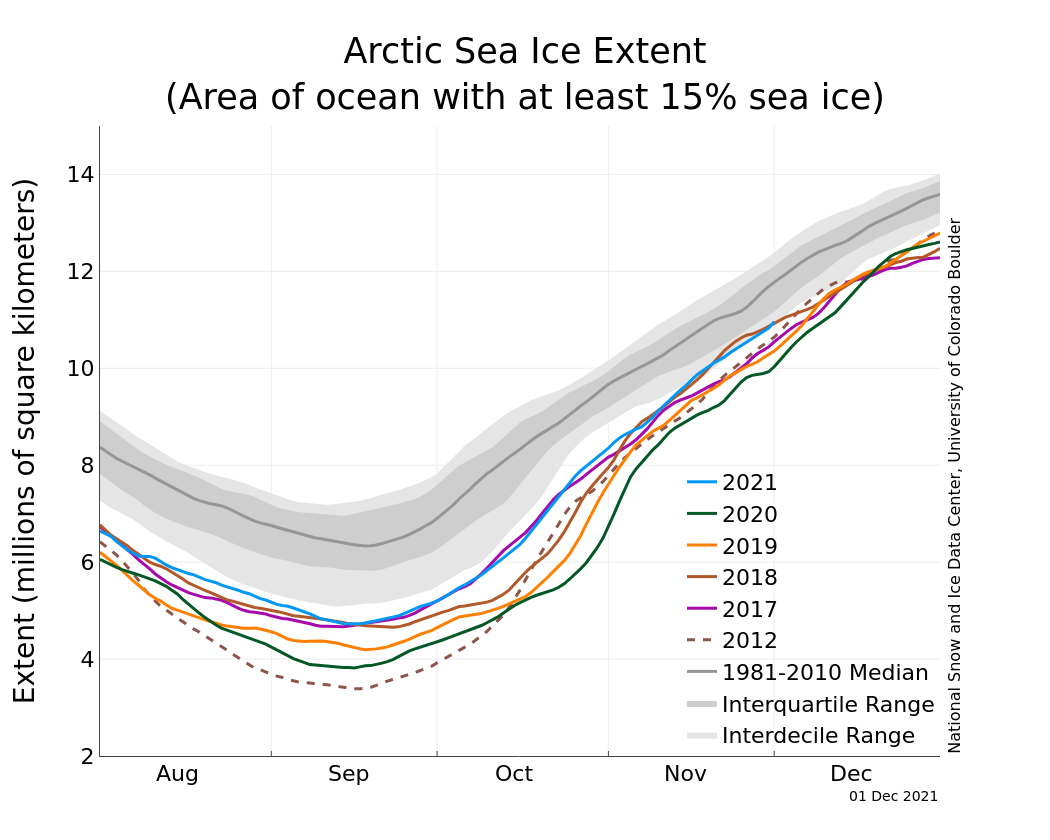
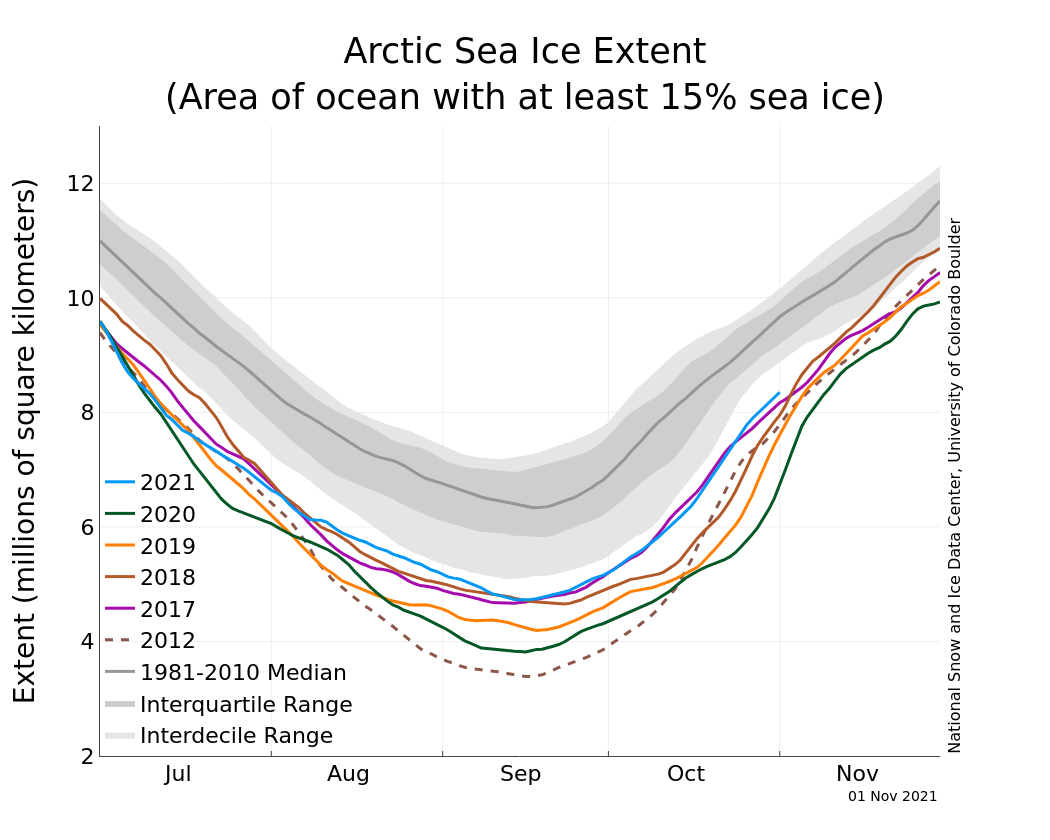
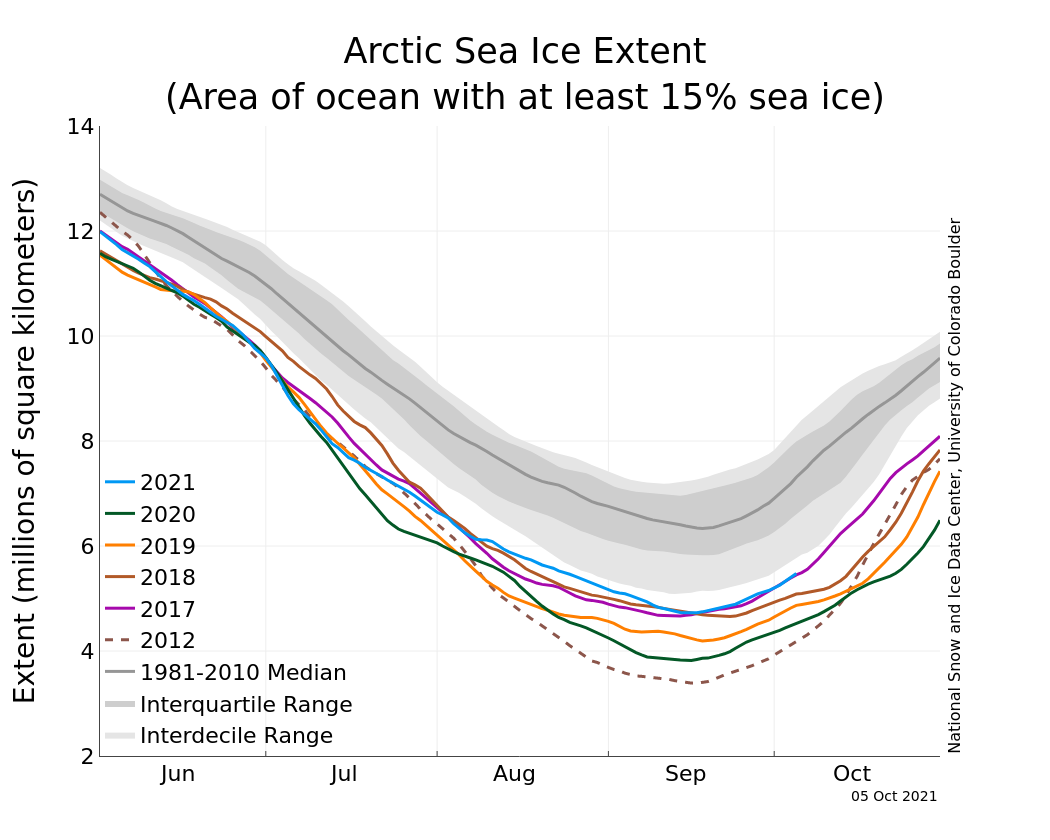
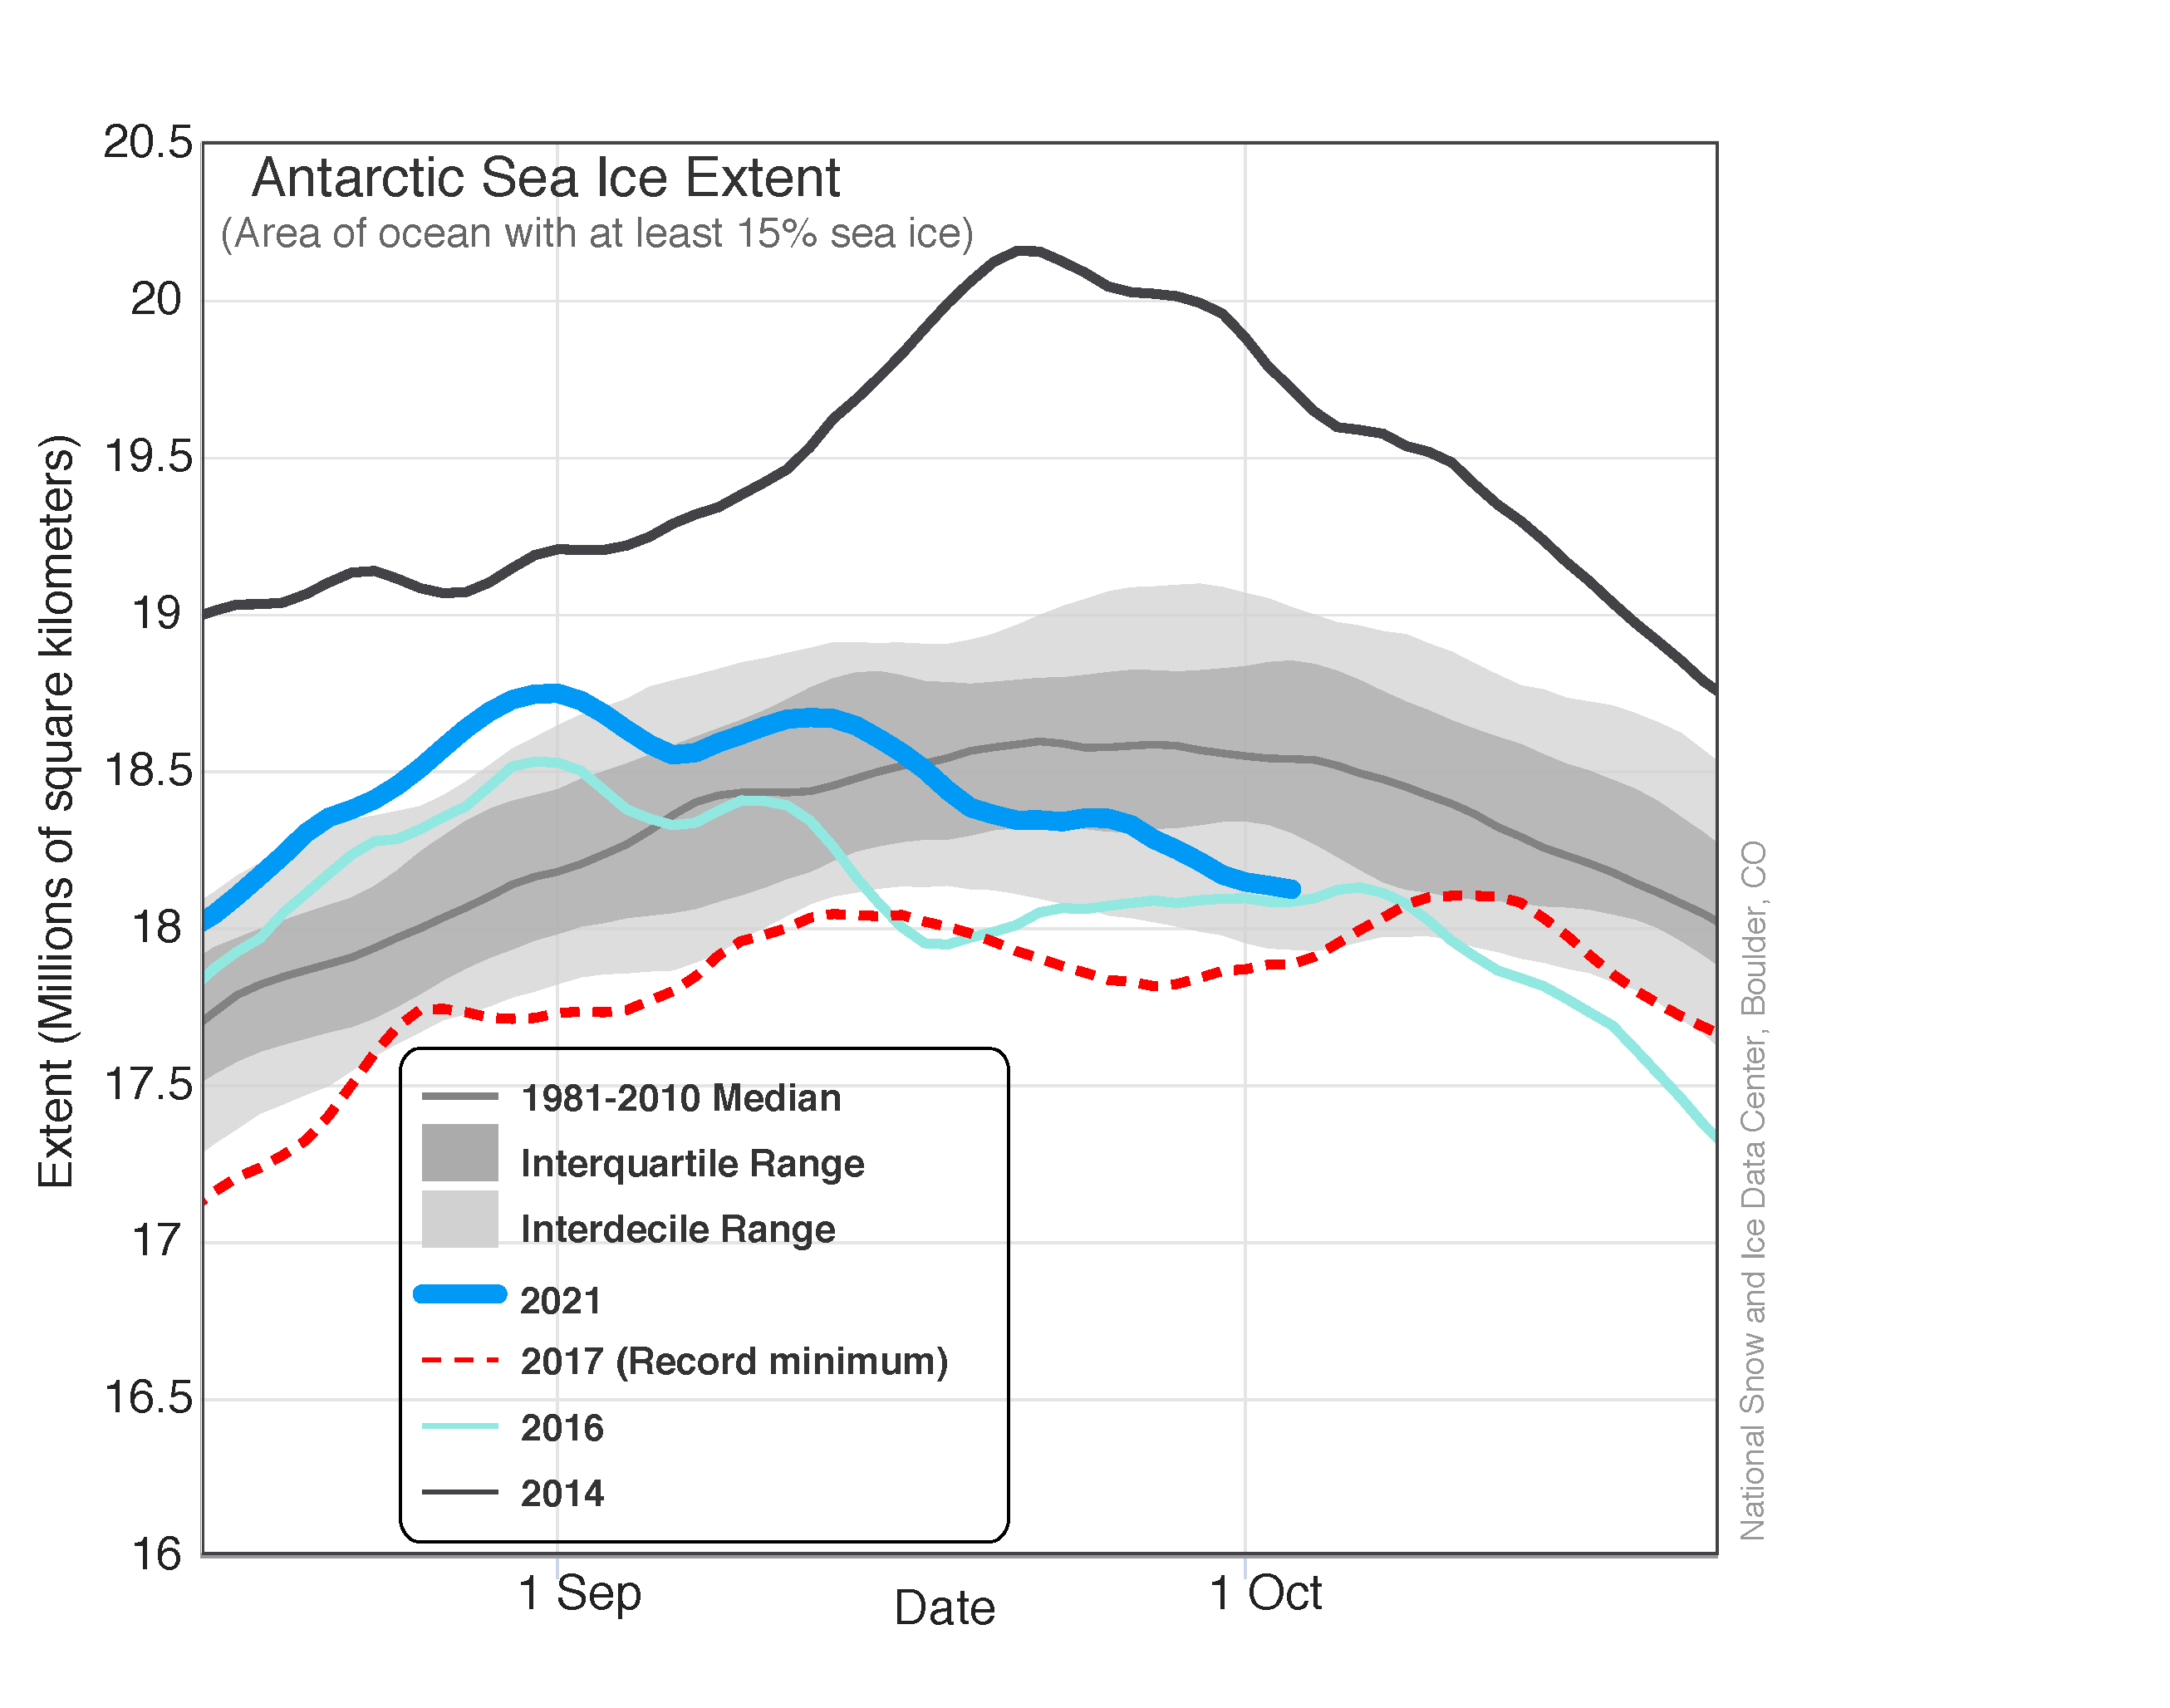
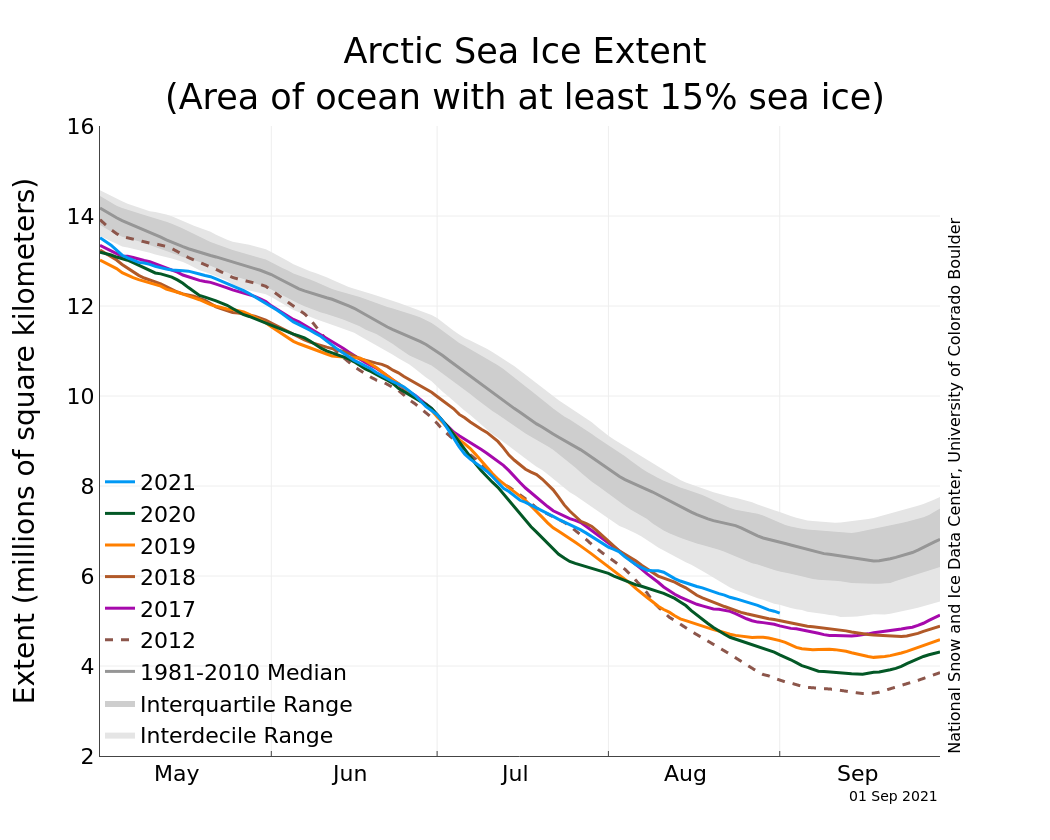
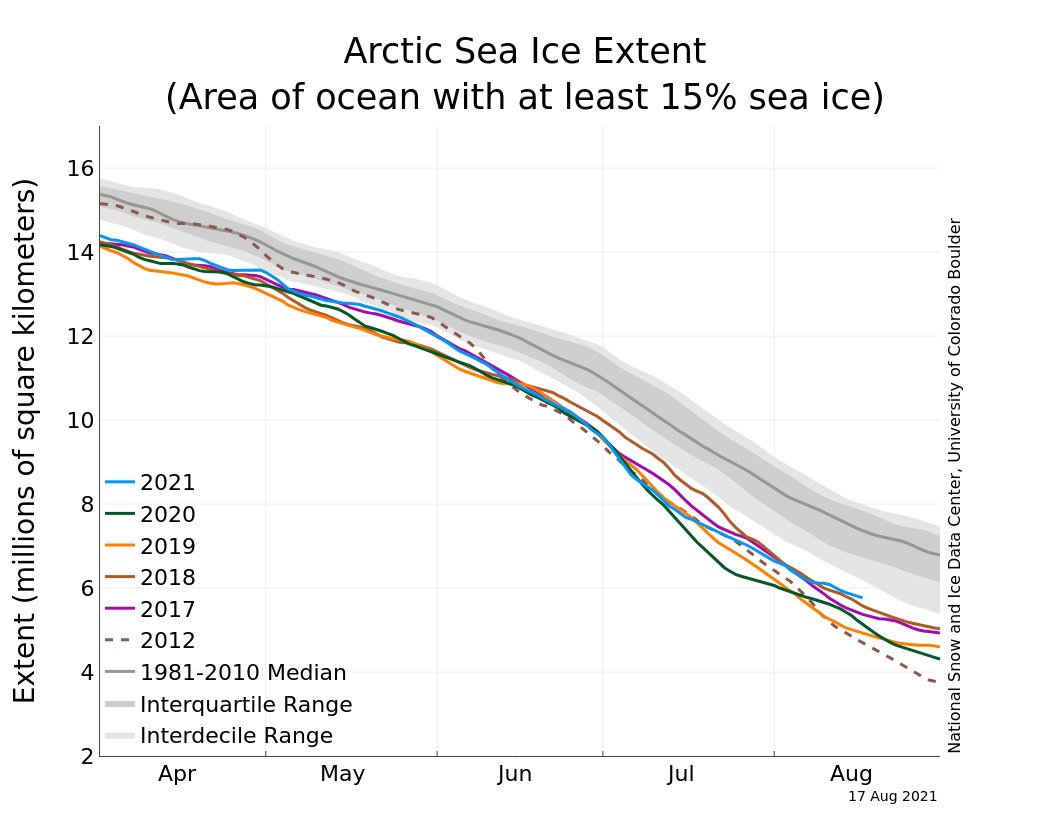
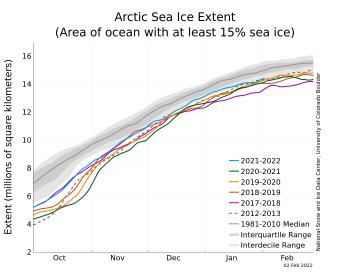
Figure 1b. The graph above shows Arctic sea ice extent as of March 7, 2022, along with daily ice extent data for four previous years and the record low year. 2021 to 2022 is shown in blue, 2020 to 2021 in green, 2019 to 2020 in orange, 2018 to 2019 in brown, 2017 to 2018 in magenta, and 2012 to 2013 in dashed brown. The 1981 to 2010 median is in dark gray. The gray areas around the median line show the interquartile and interdecile ranges of the data. Sea Ice Index data.
Credit: National Snow and Ice Data Center
High-resolution image
Average Arctic sea ice extent for February 2022 was 14.61 million square kilometers (5.64 million square miles), ranking fourteenth lowest in the satellite record. The 2022 extent was 690,000 square kilometers (266,000 square miles) below the 1981 to 2010 average. Through most of February, extent hovered near the interdecile range, roughly at the lowest 10 percent of the measured extents for those days. Regionally, the sea ice extent was near average in the Bering Sea but continued to be well below average in the Sea of Okhotsk. In the Barents Sea, extent was below average, and a narrow open-water area extended north of Novaya Zemlya. Extent also remained below average in the Gulf of St. Lawrence and along the eastern Greenland coast. As is generally the case near the maximum sea ice extent, there are ups and downs in extent associated with storms moving the ice around, melt along the southern ice margins, and subsequent regrowth.
Conditions in context
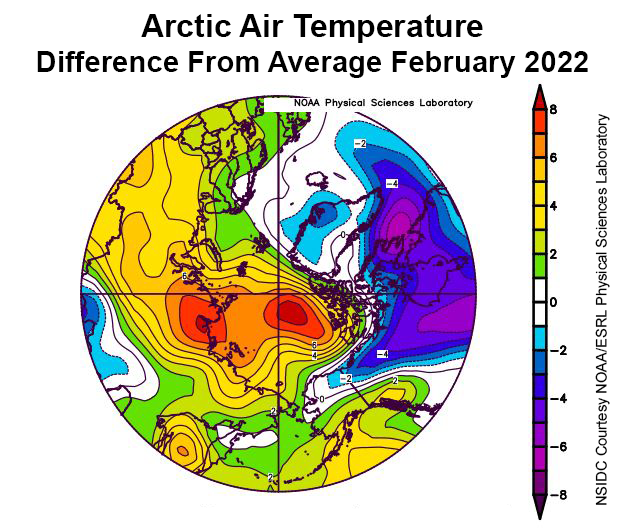
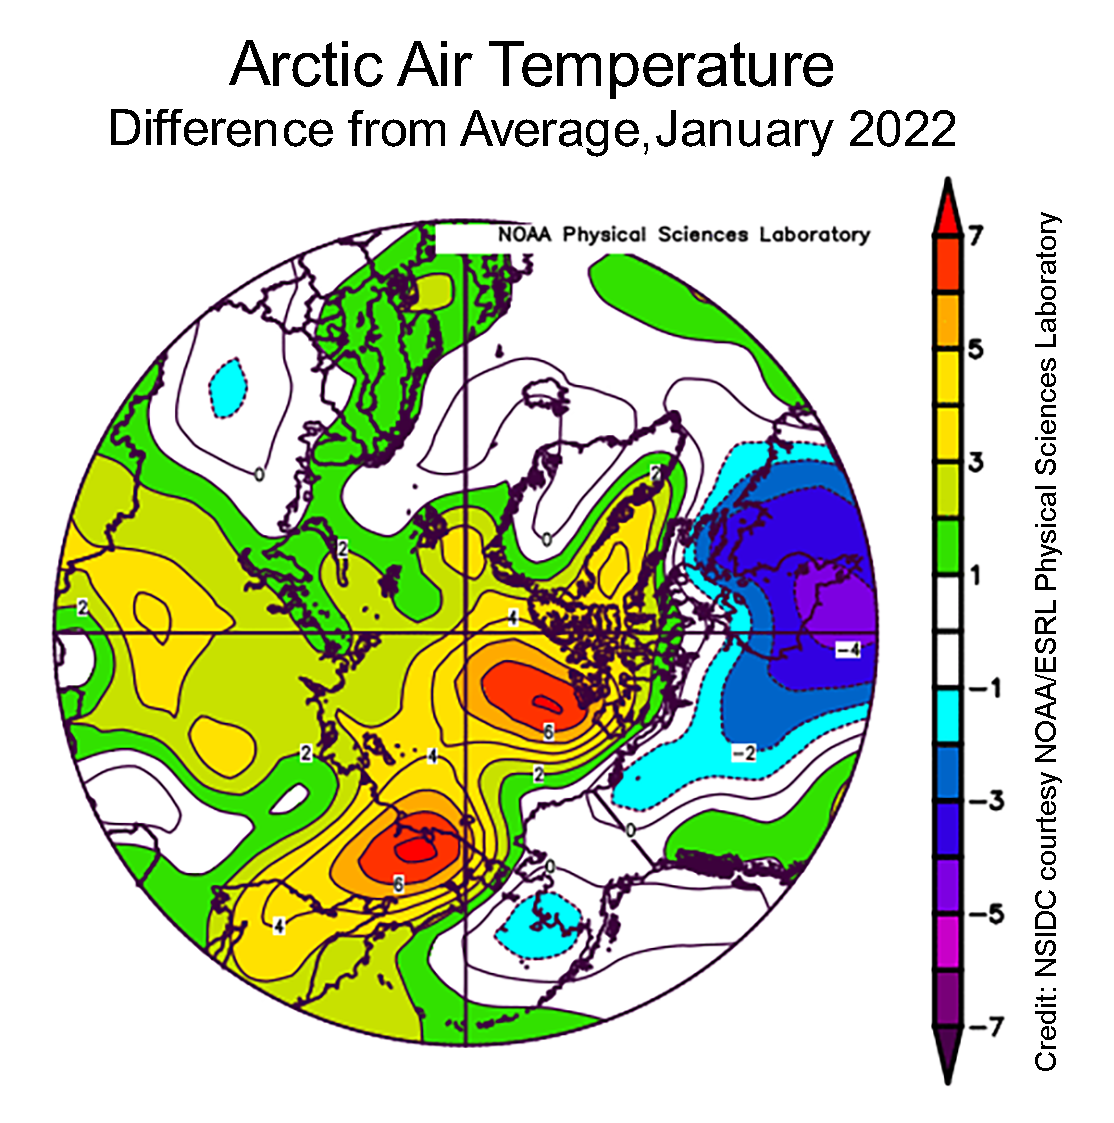
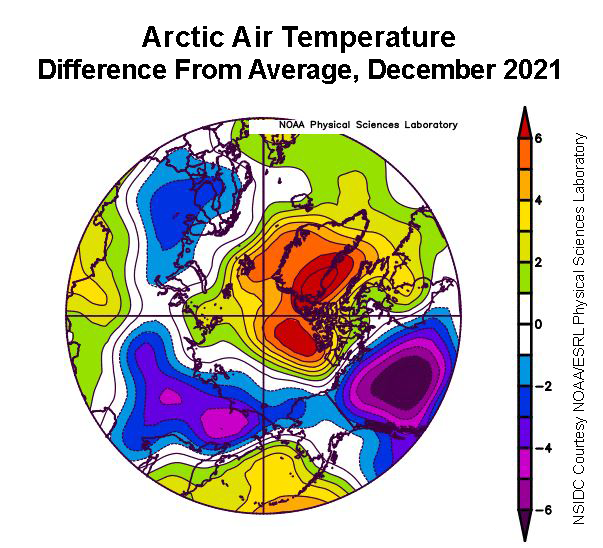
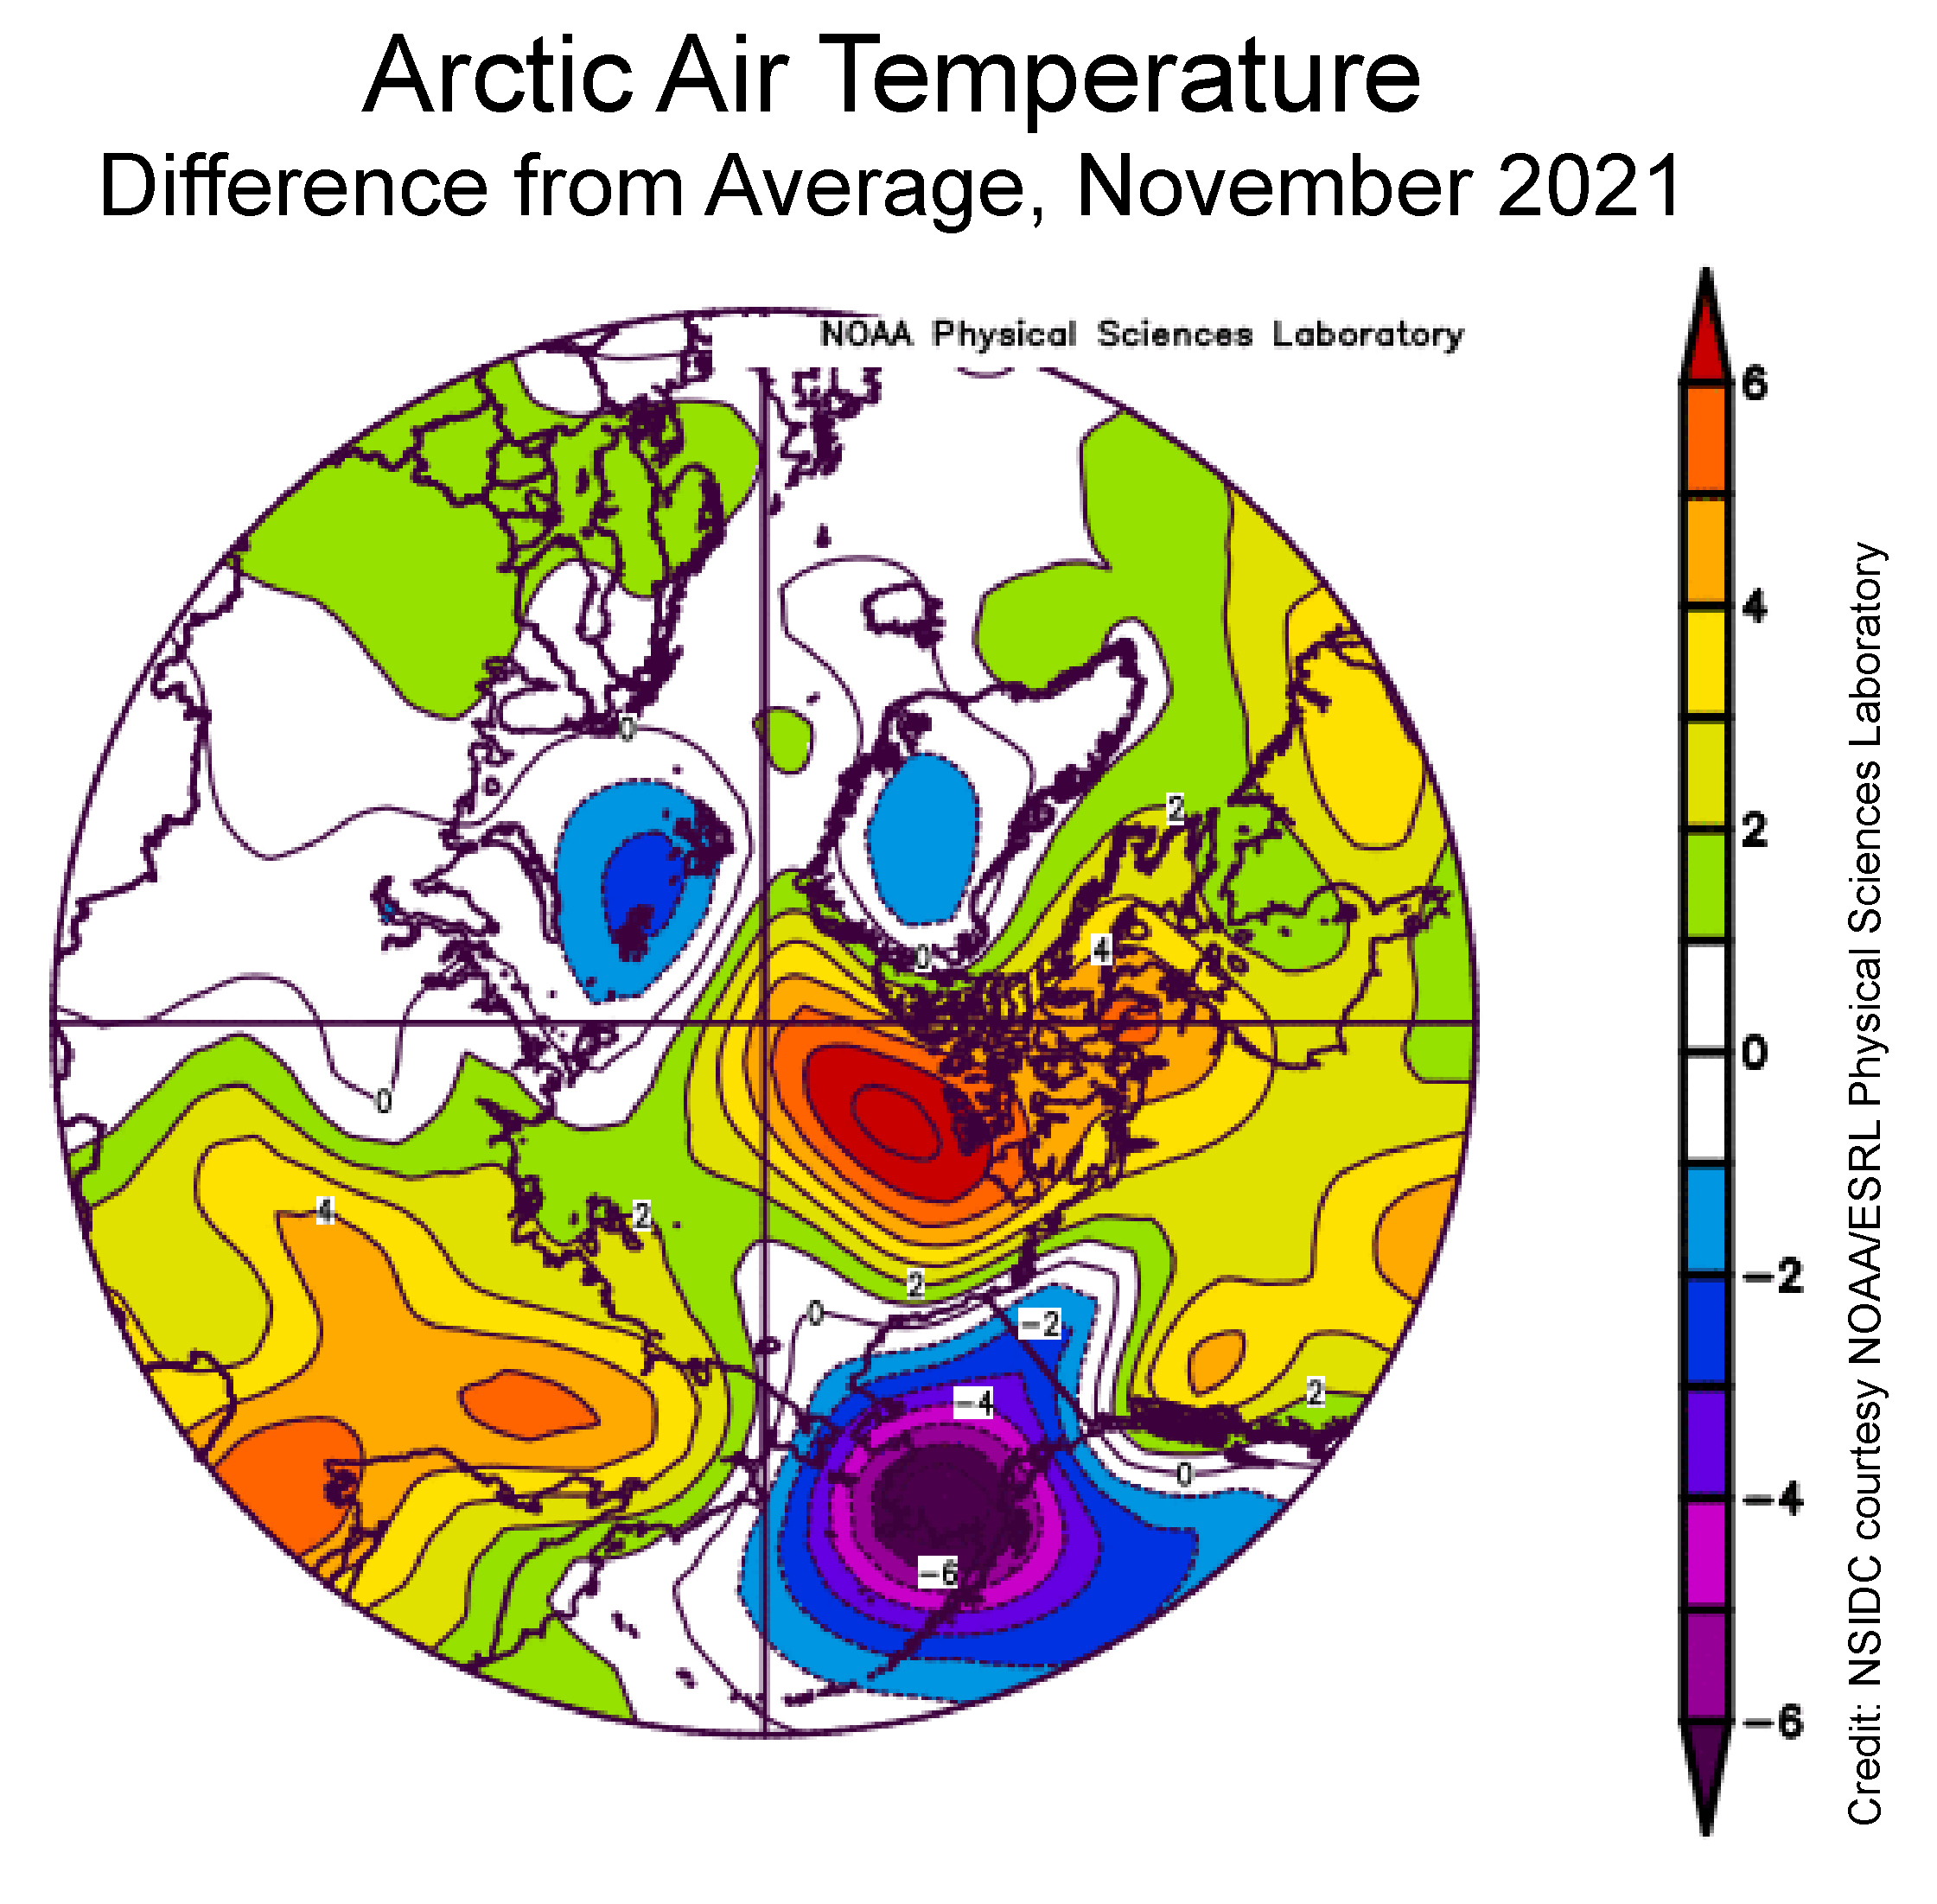
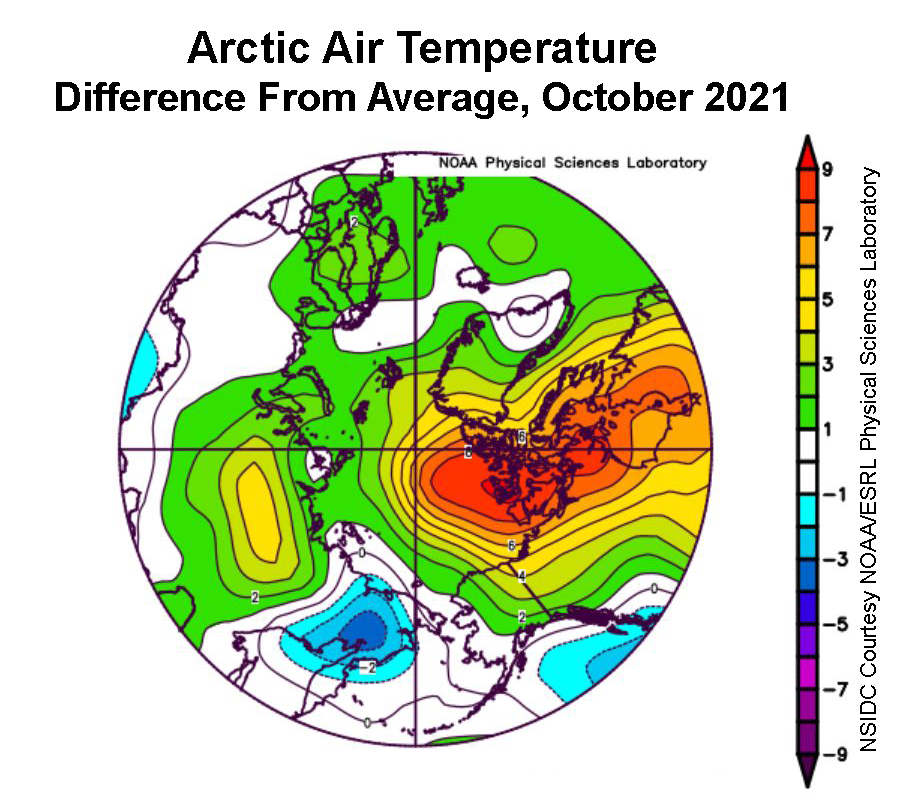
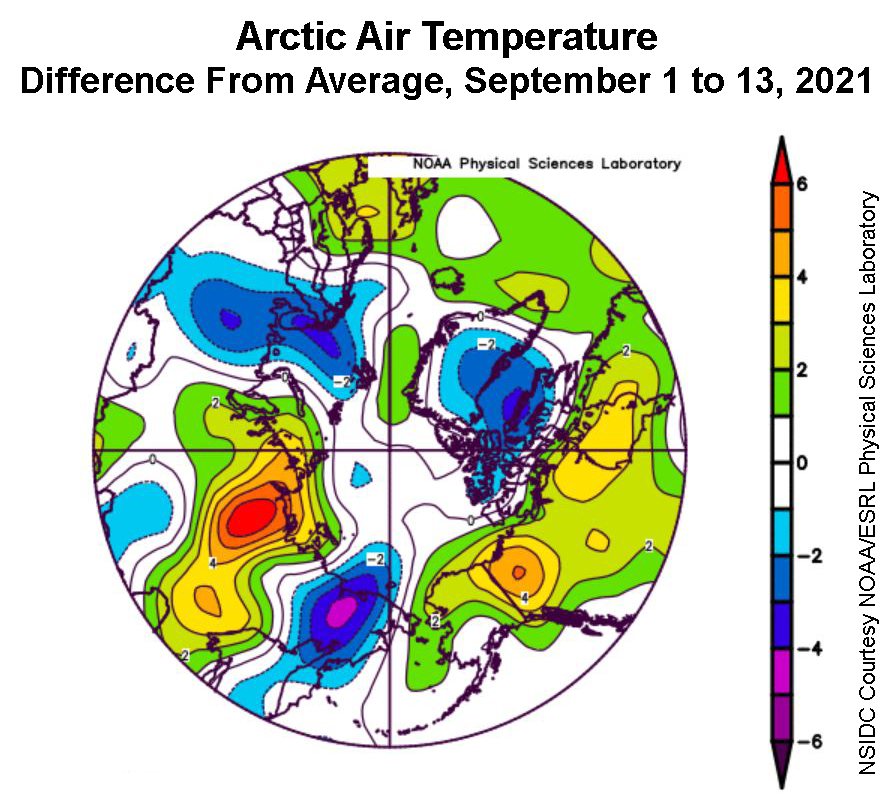
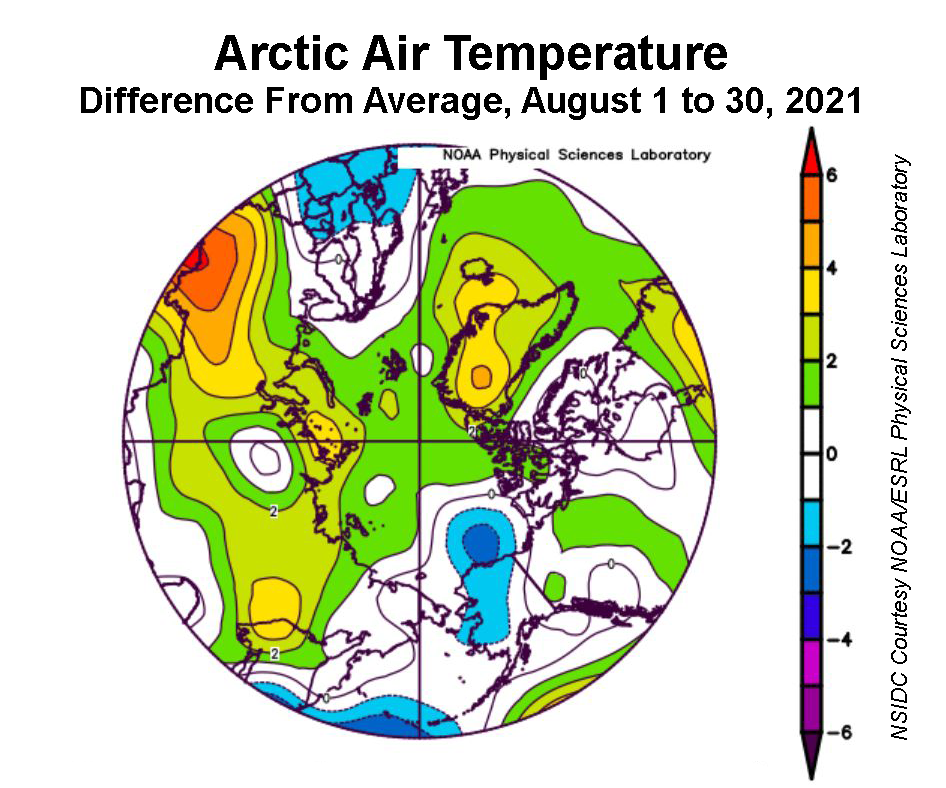
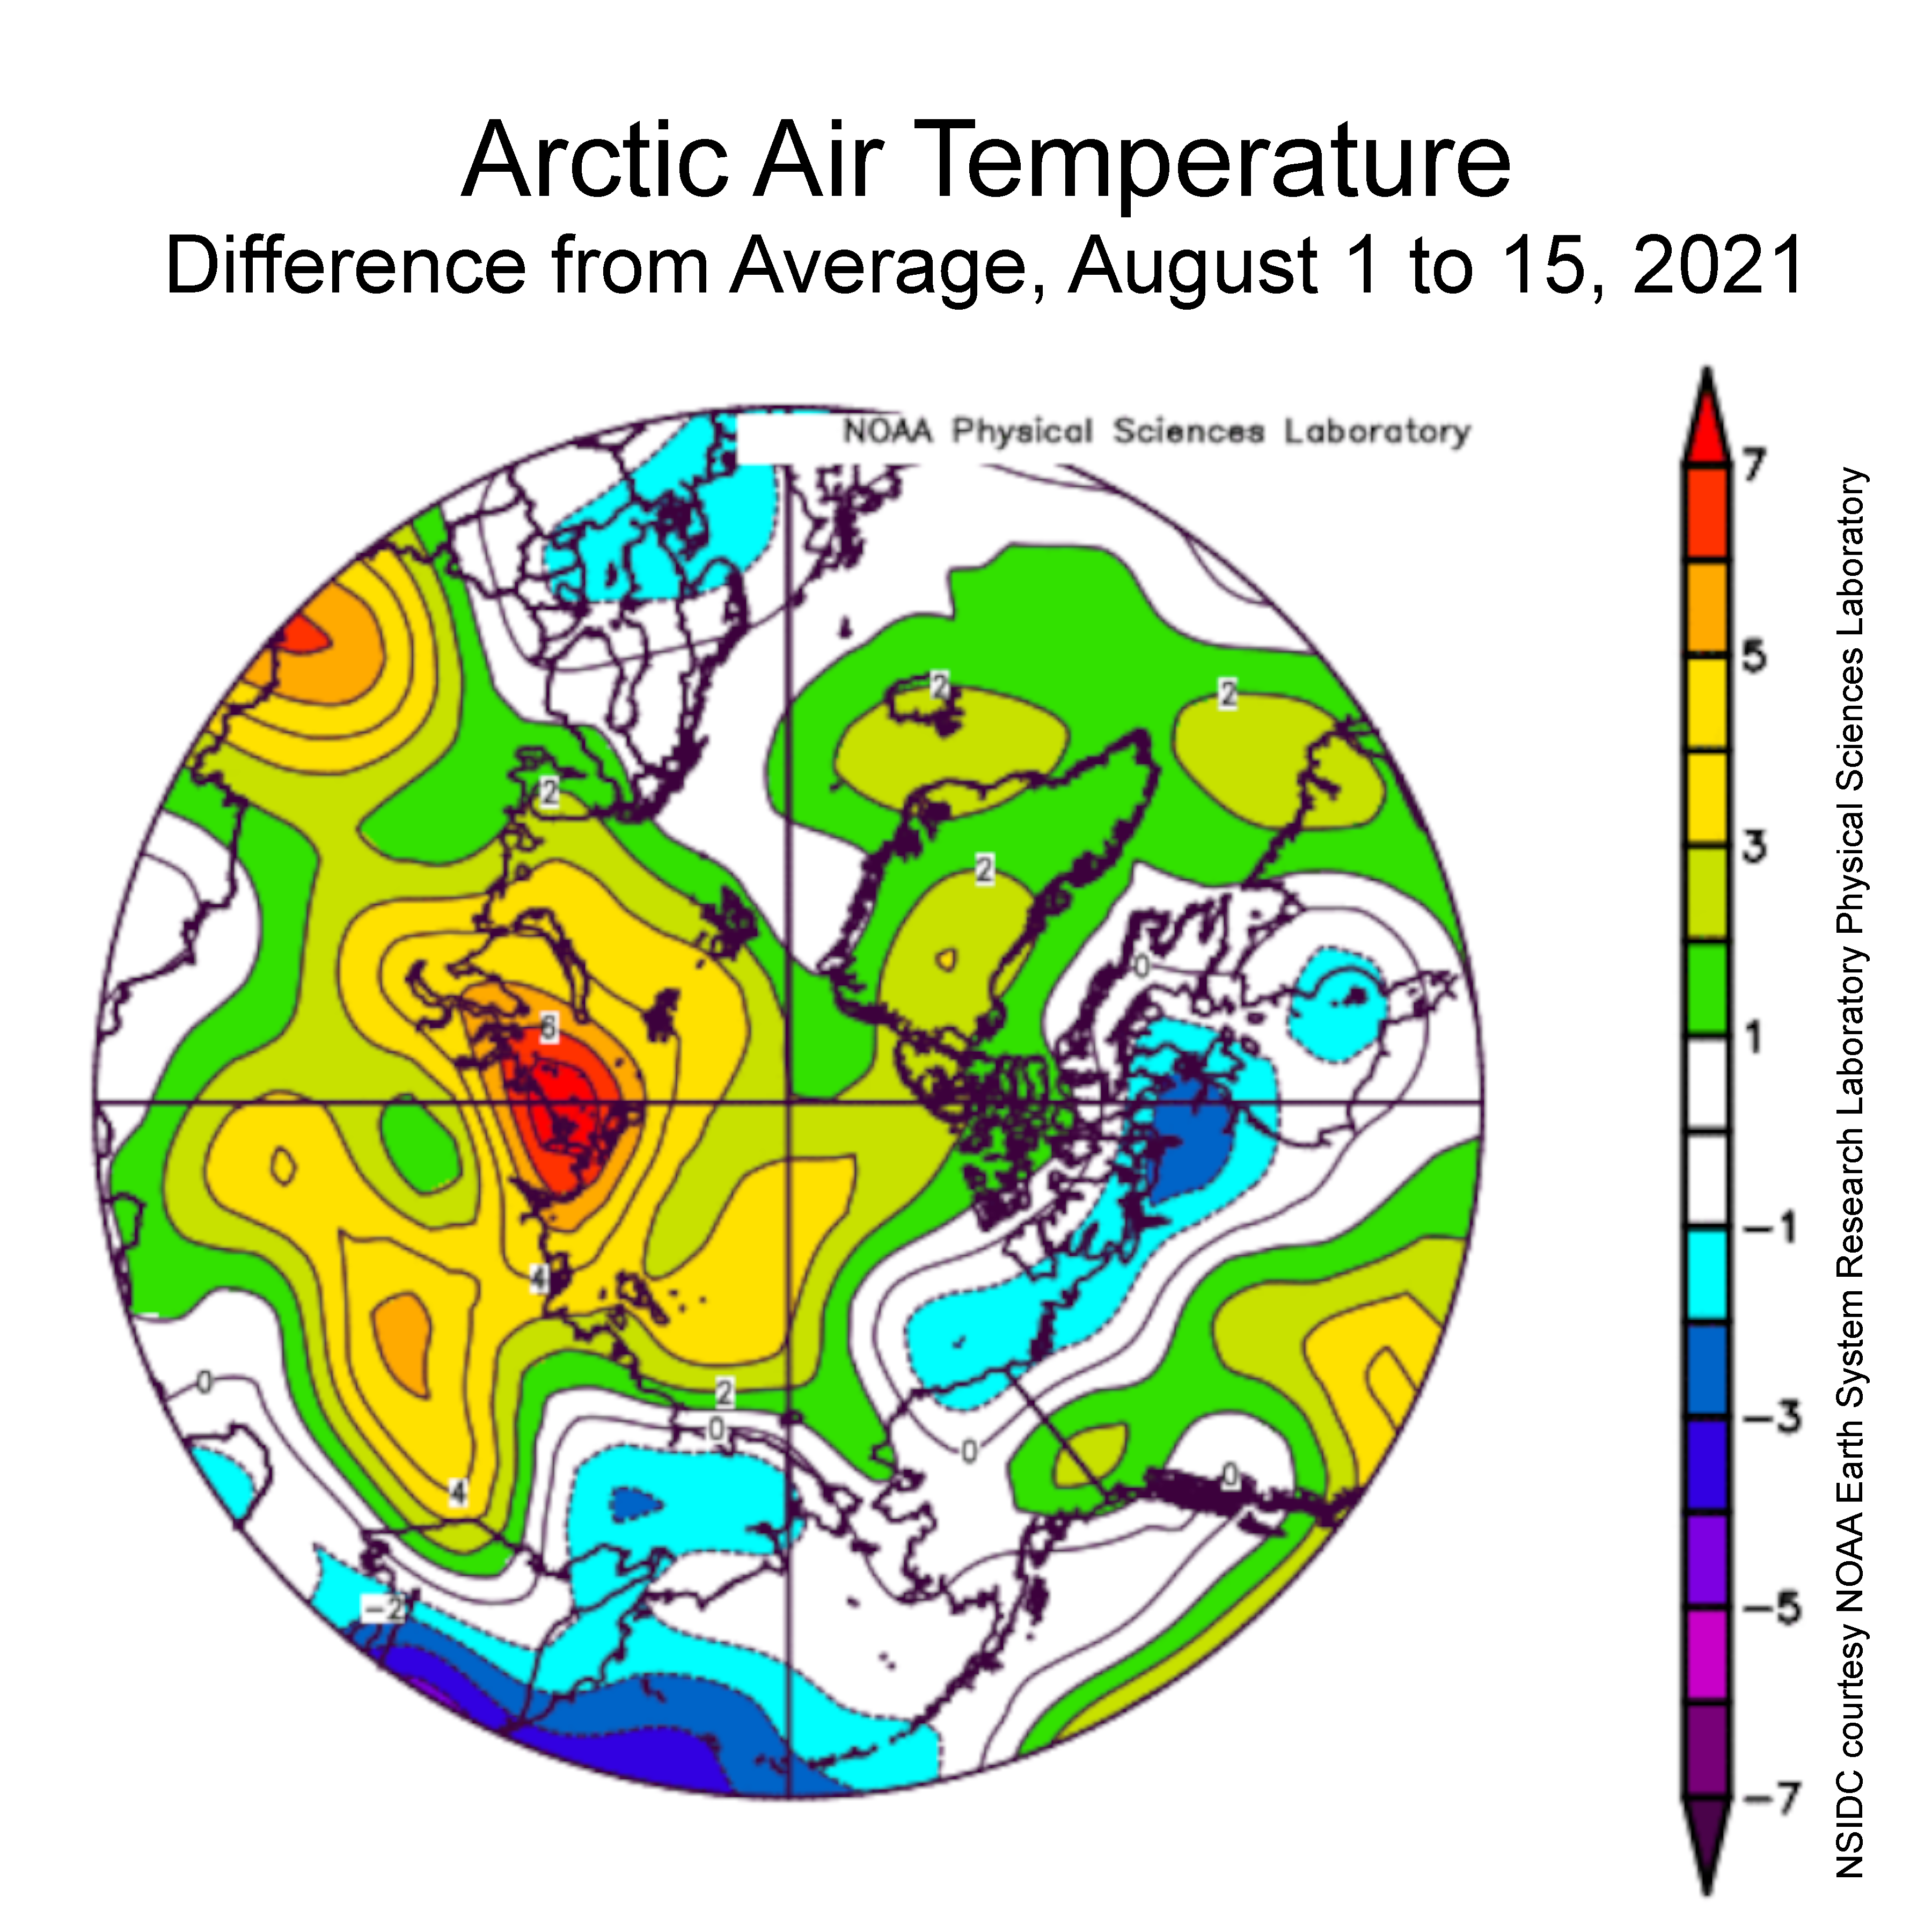
Figure 2a. This plot shows the departure from average air temperature in the Arctic at the 925 hPa level, in degrees Celsius, for February 2022. Yellows and reds indicate higher than average temperatures; blues and purples indicate lower than average temperatures.
Credit: NSIDC courtesy NOAA Earth System Research Laboratory Physical Sciences Laboratory
High-resolution image
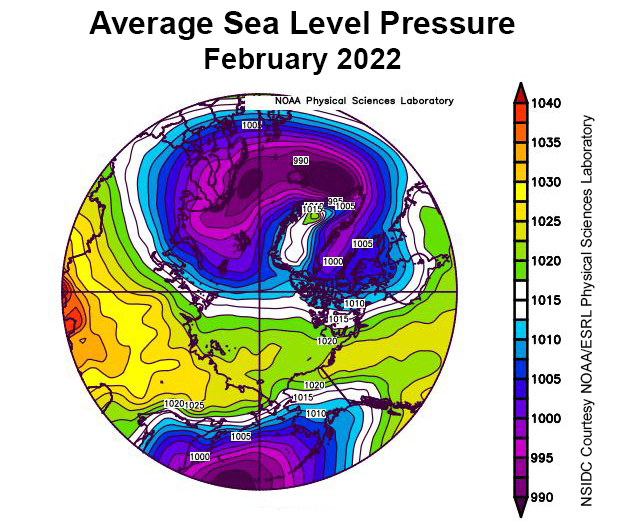
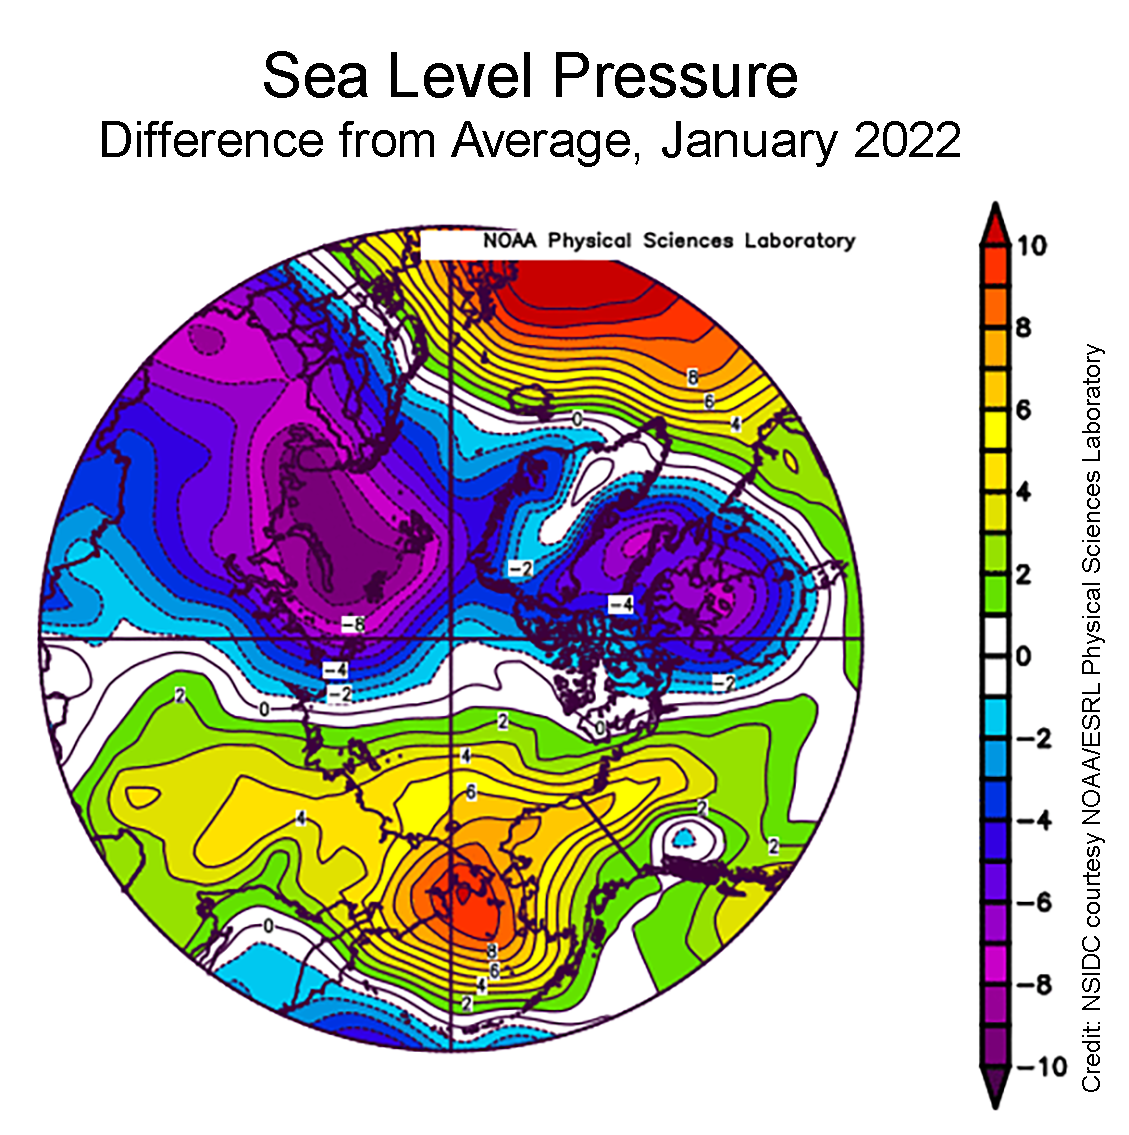
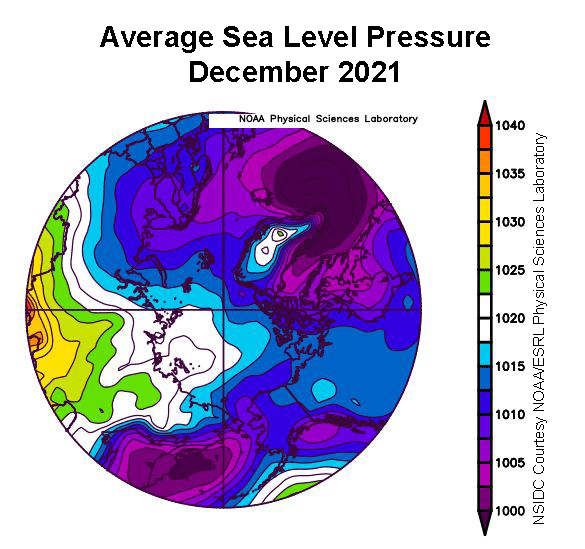
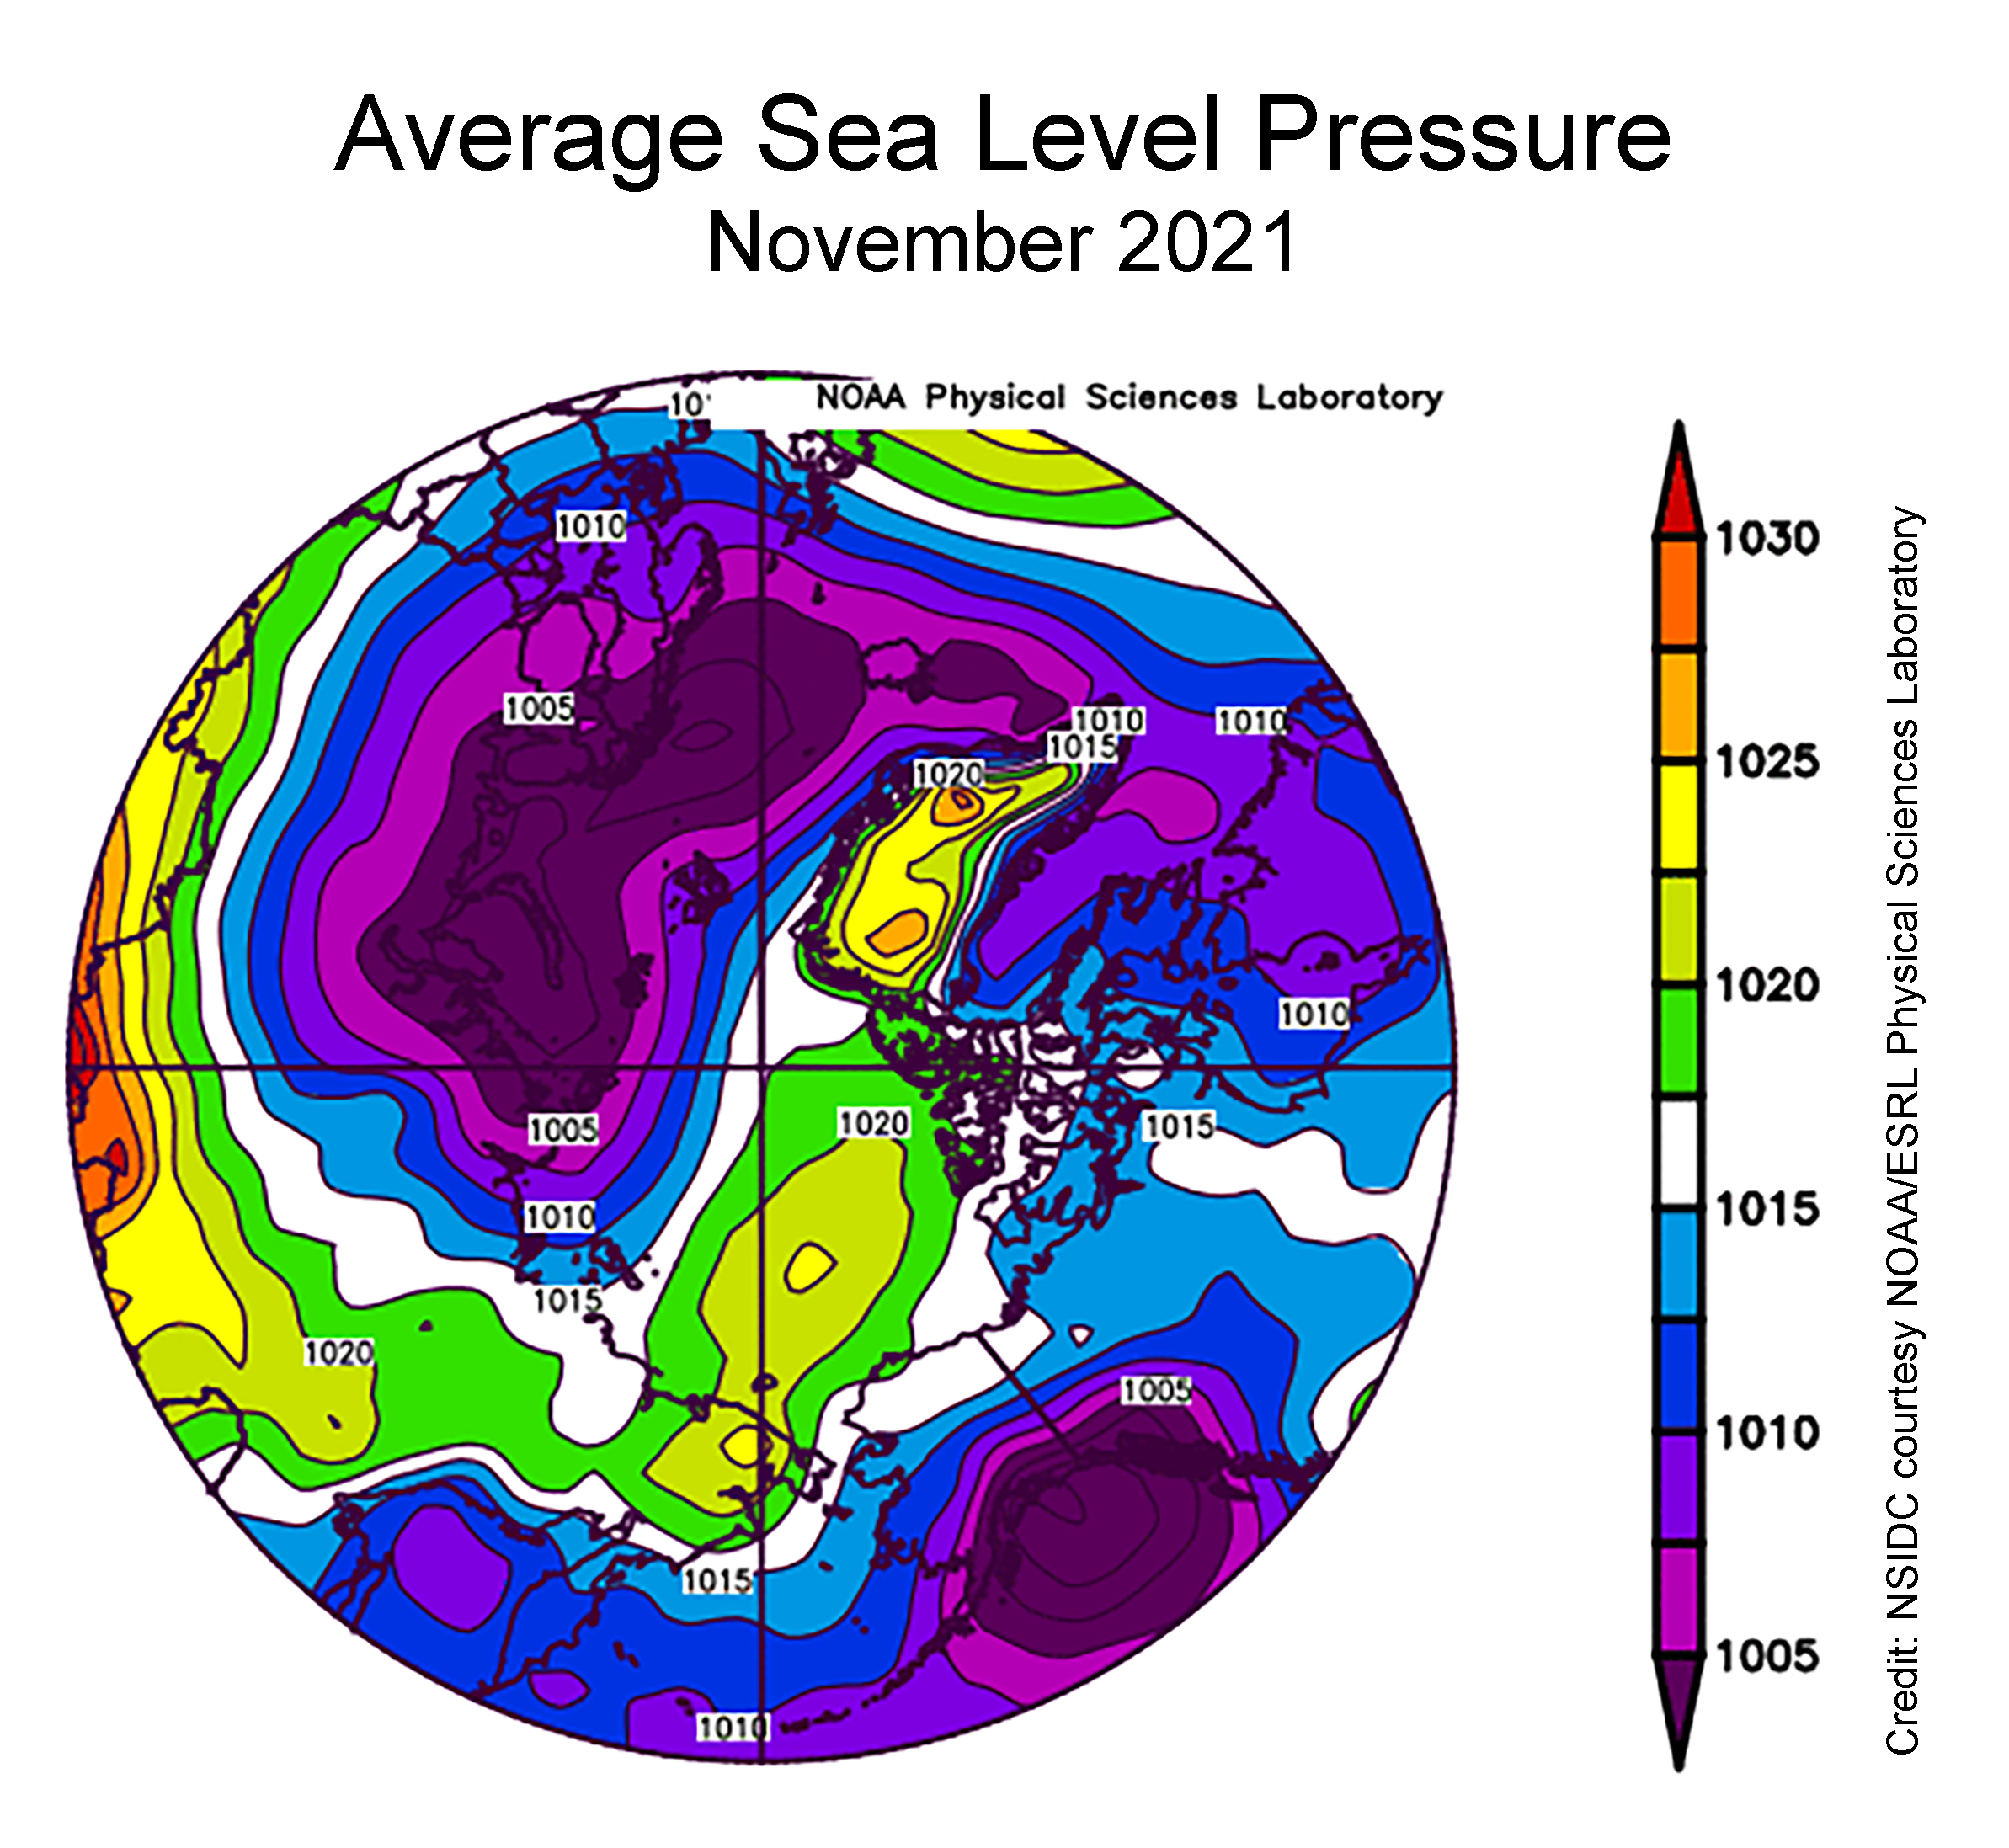
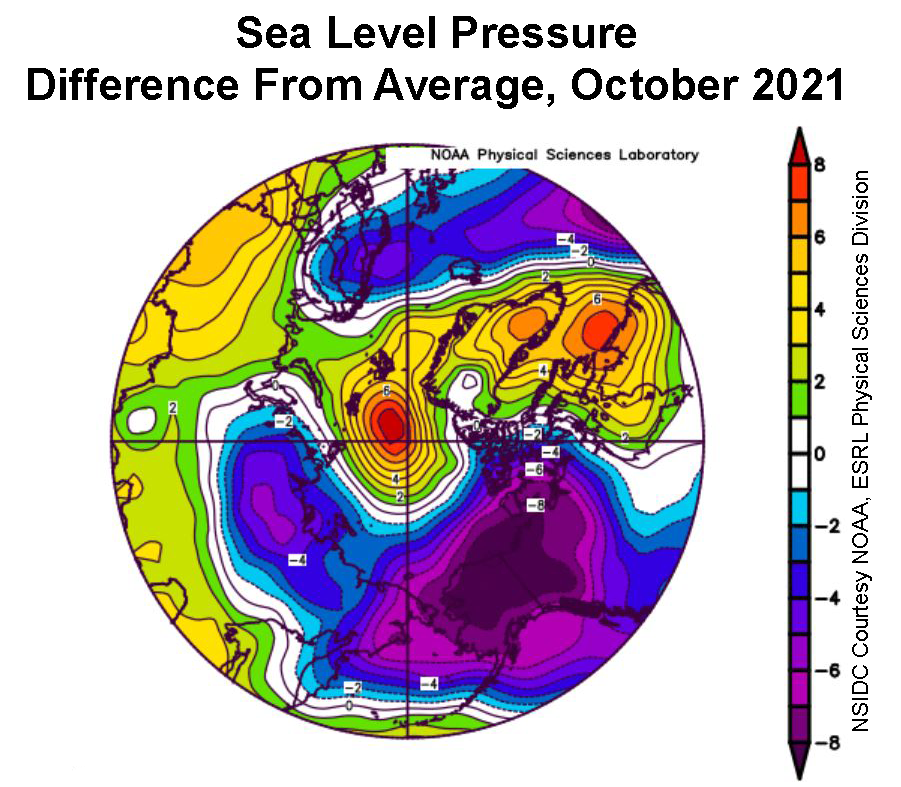
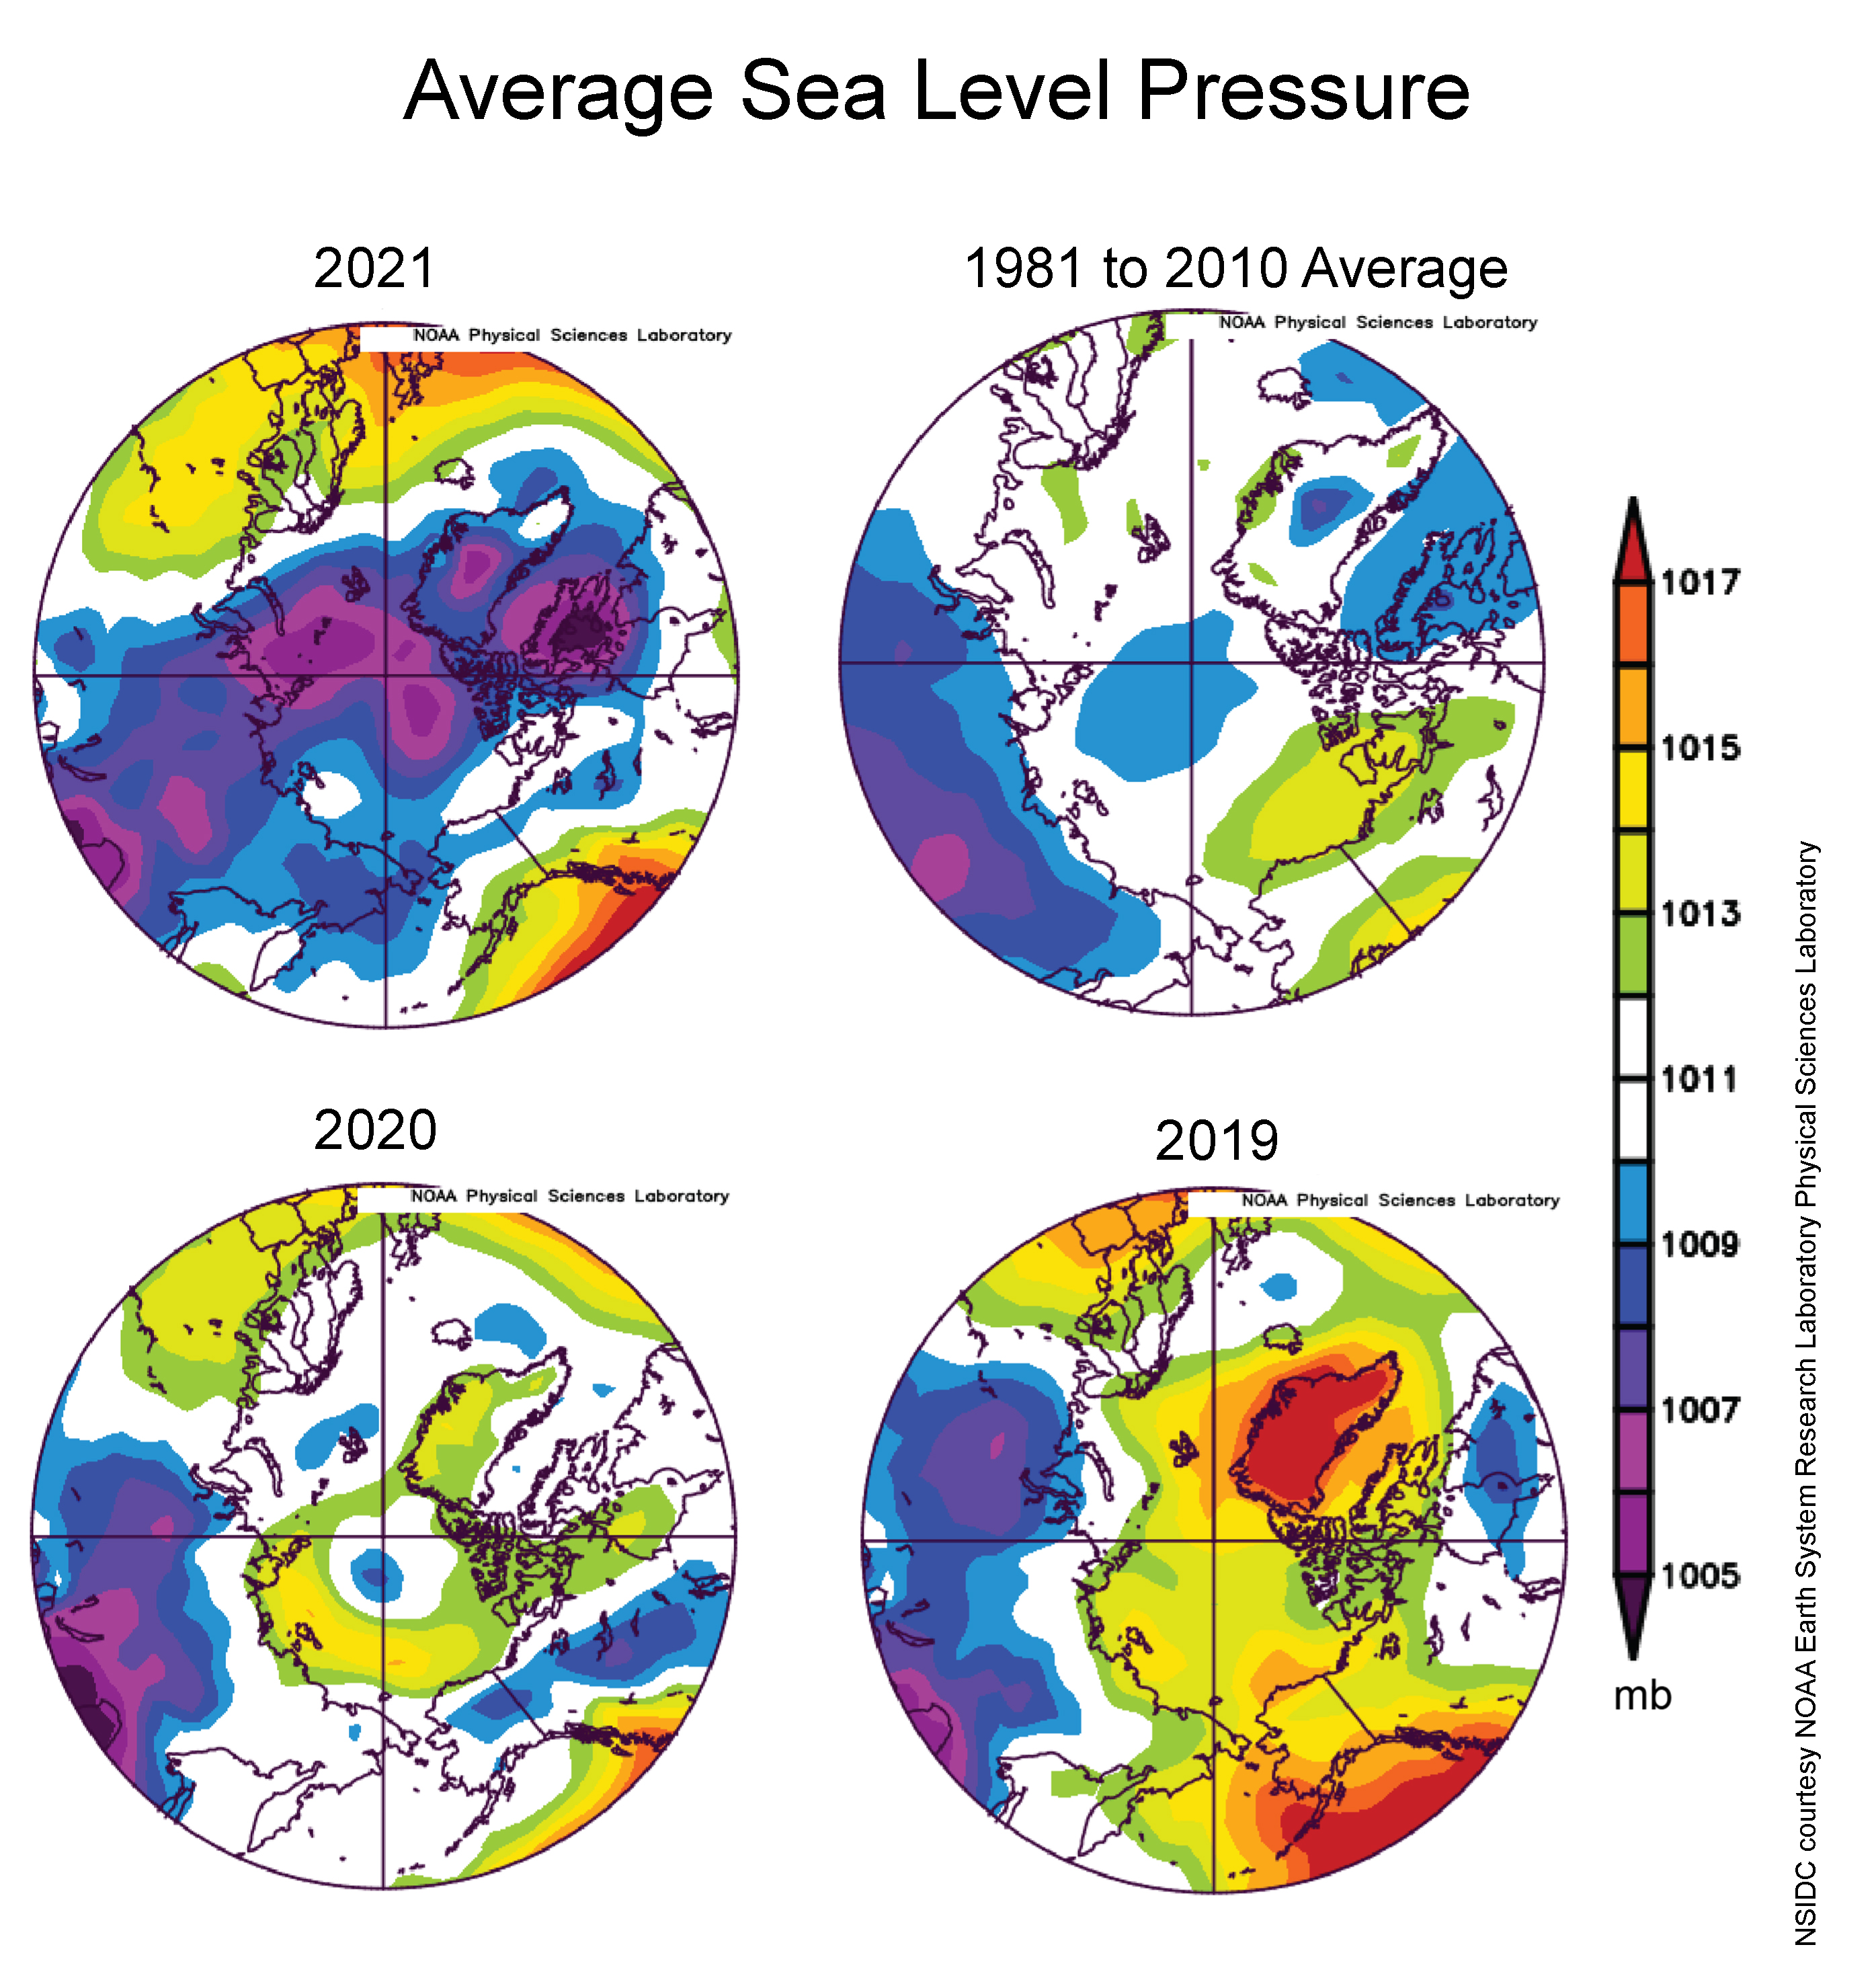
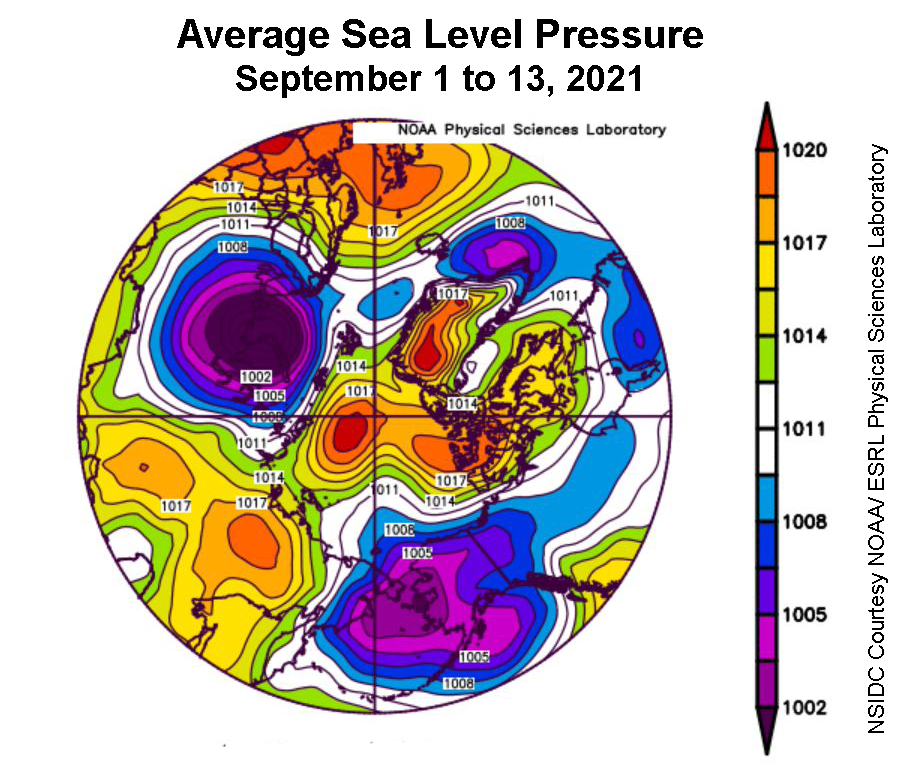
Figure 2b. This plot shows average sea level pressure in the Arctic in millibars for February 2022. Yellows and reds indicate high air pressure; blues and purples indicate low pressure.
Credit: NSIDC courtesy NOAA Earth System Research Laboratory Physical Sciences Laboratory
High-resolution image
In February 2022, temperatures at the 925 hPa level (about 2,500 feet above sea level) ranged from 1 to over 8 degrees Celsius (2 to 14 degrees Fahrenheit) above the 1981 to 2010 average along the Eurasian coast and across the central Arctic Ocean (Figure 2a). However, cool conditions prevailed over much of Canada and Baffin Bay; temperatures were generally 2 to 7 degrees Celsius (4 to 13 degrees Fahrenheit) below average. The sea level air pressure pattern in February was marked by strong low pressure centered over the North Atlantic and high pressure over central Asia, acting to drive air northward from Eastern Europe to the central Arctic, consistent with the above average temperatures there (Figure 2b). In North America, low pressure over the North Atlantic, extending over Baffin Bay, drew Arctic air southward over eastern Canada, bringing cool conditions to the area.
February 2022 compared to previous years
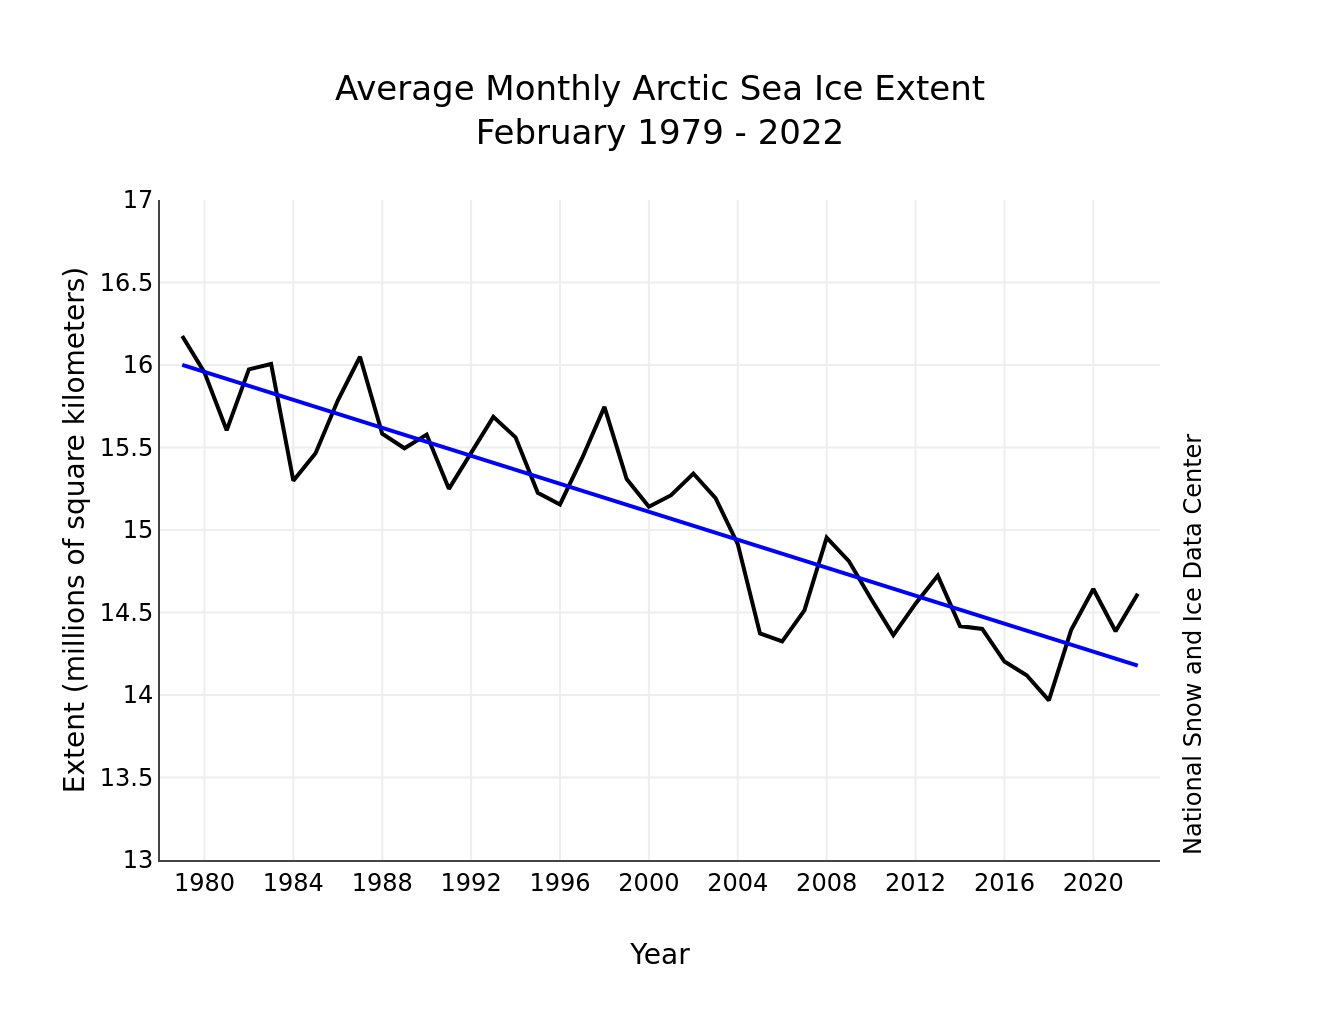
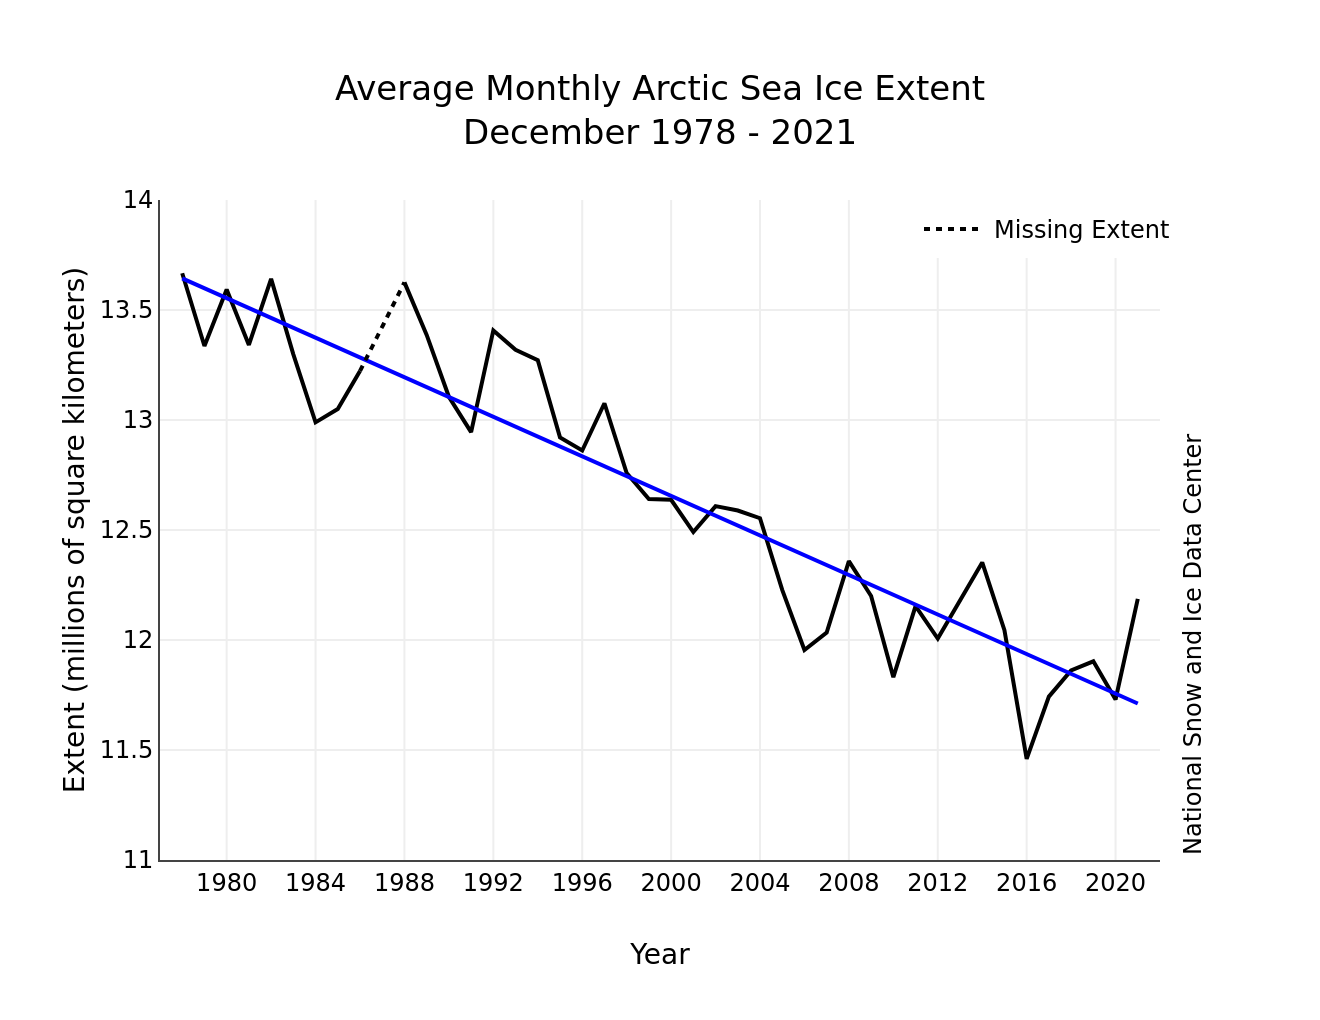
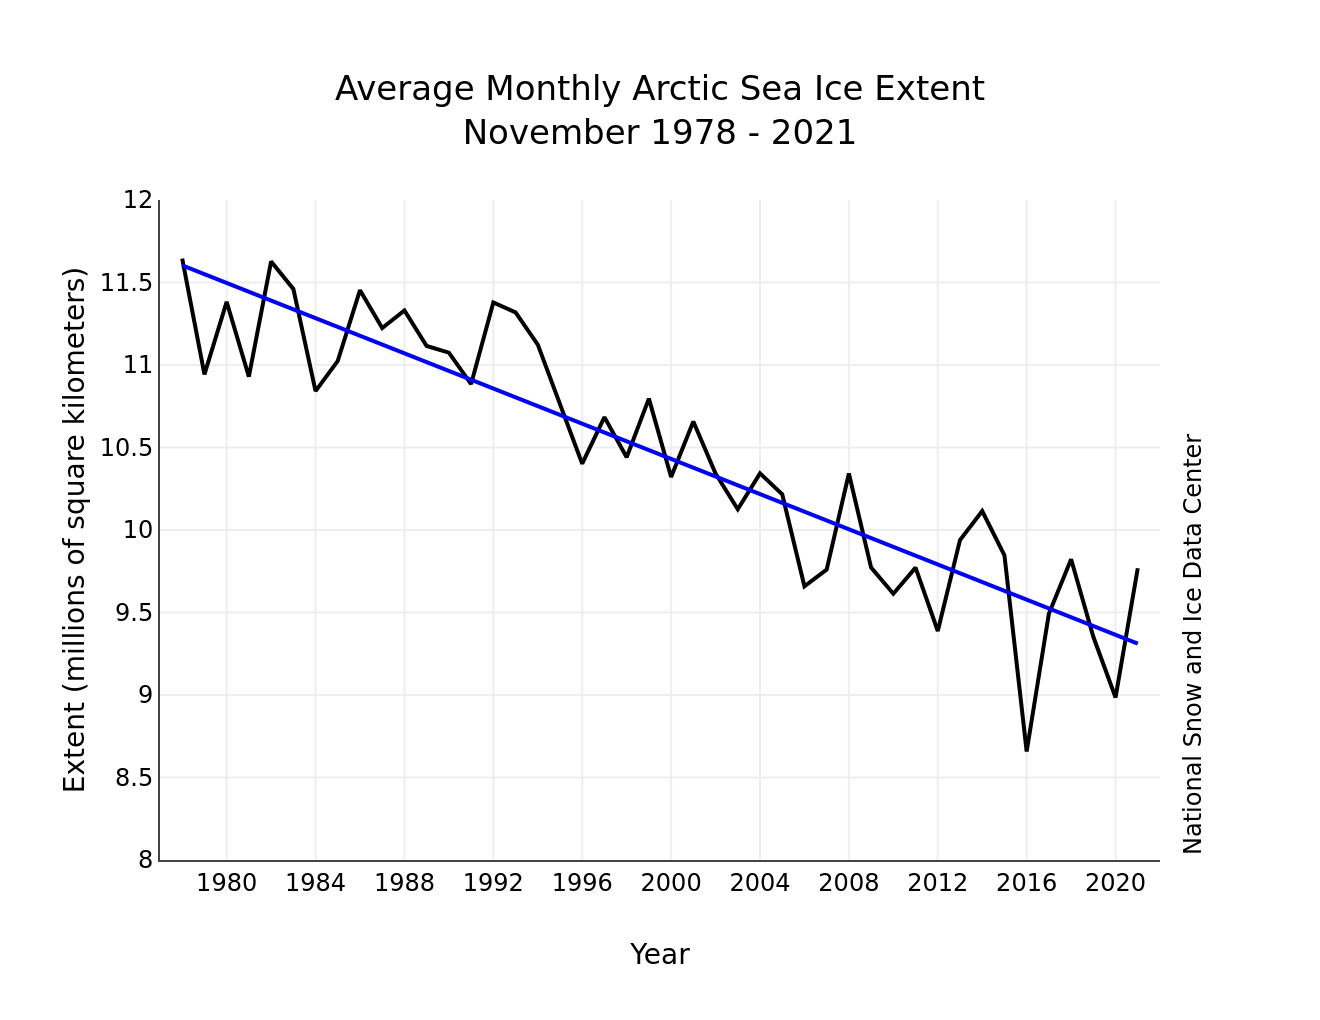
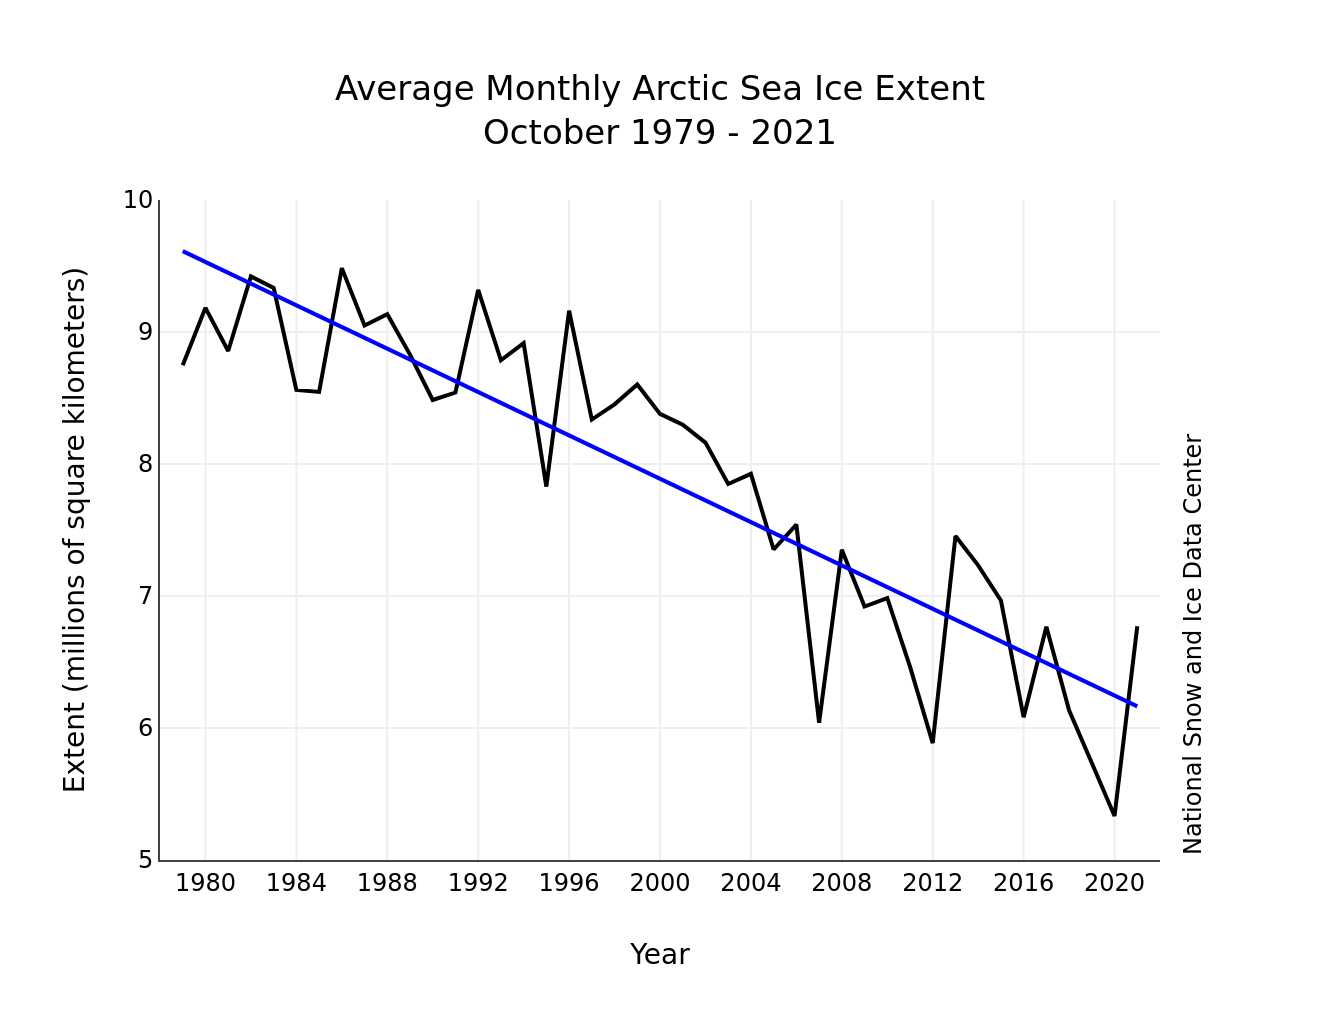
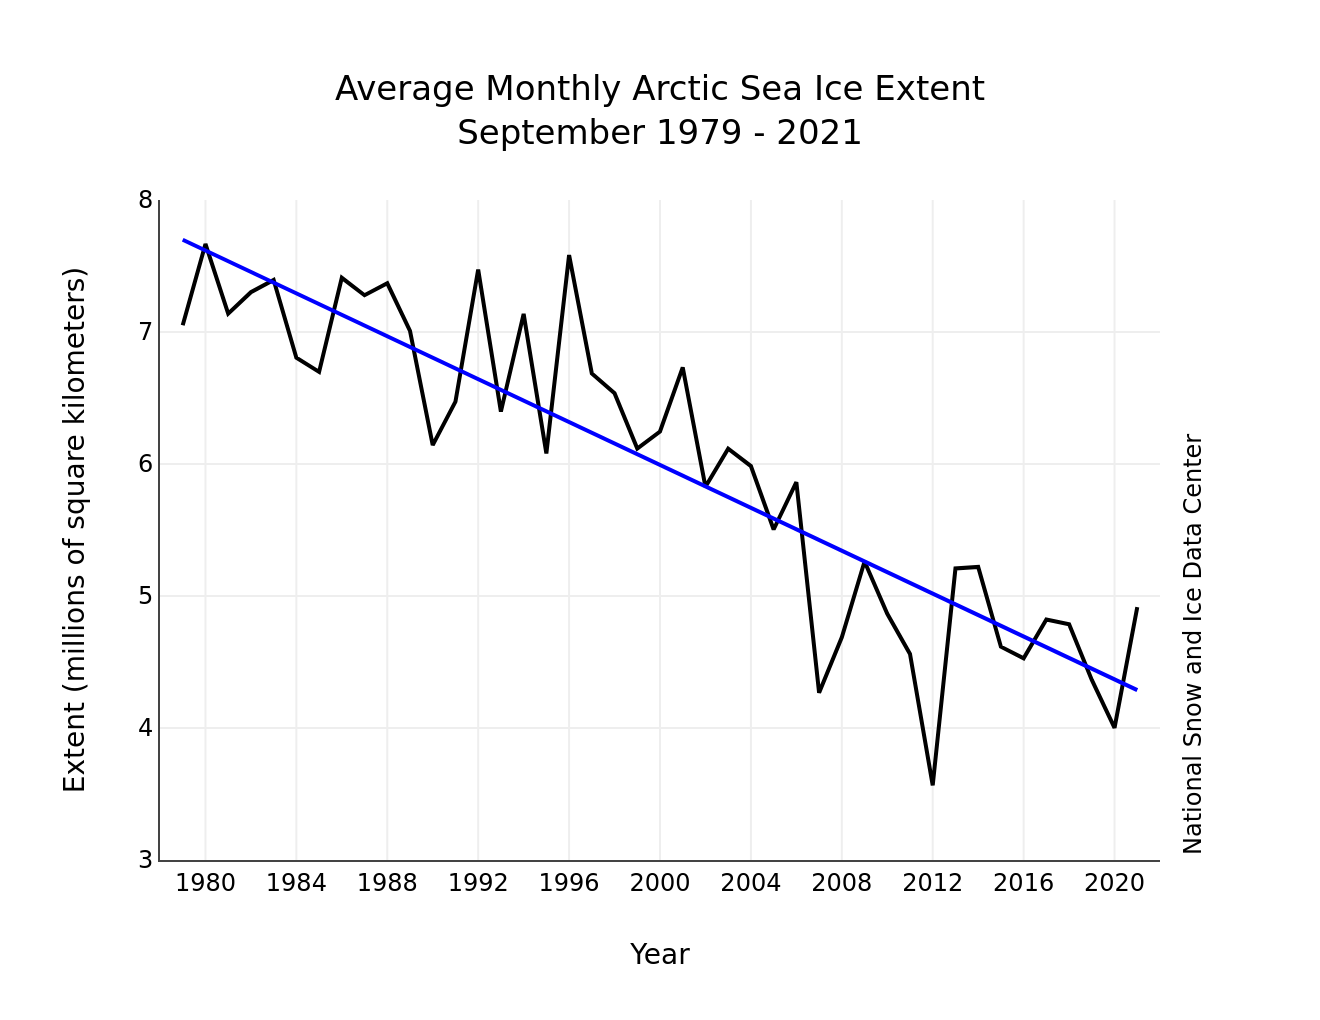
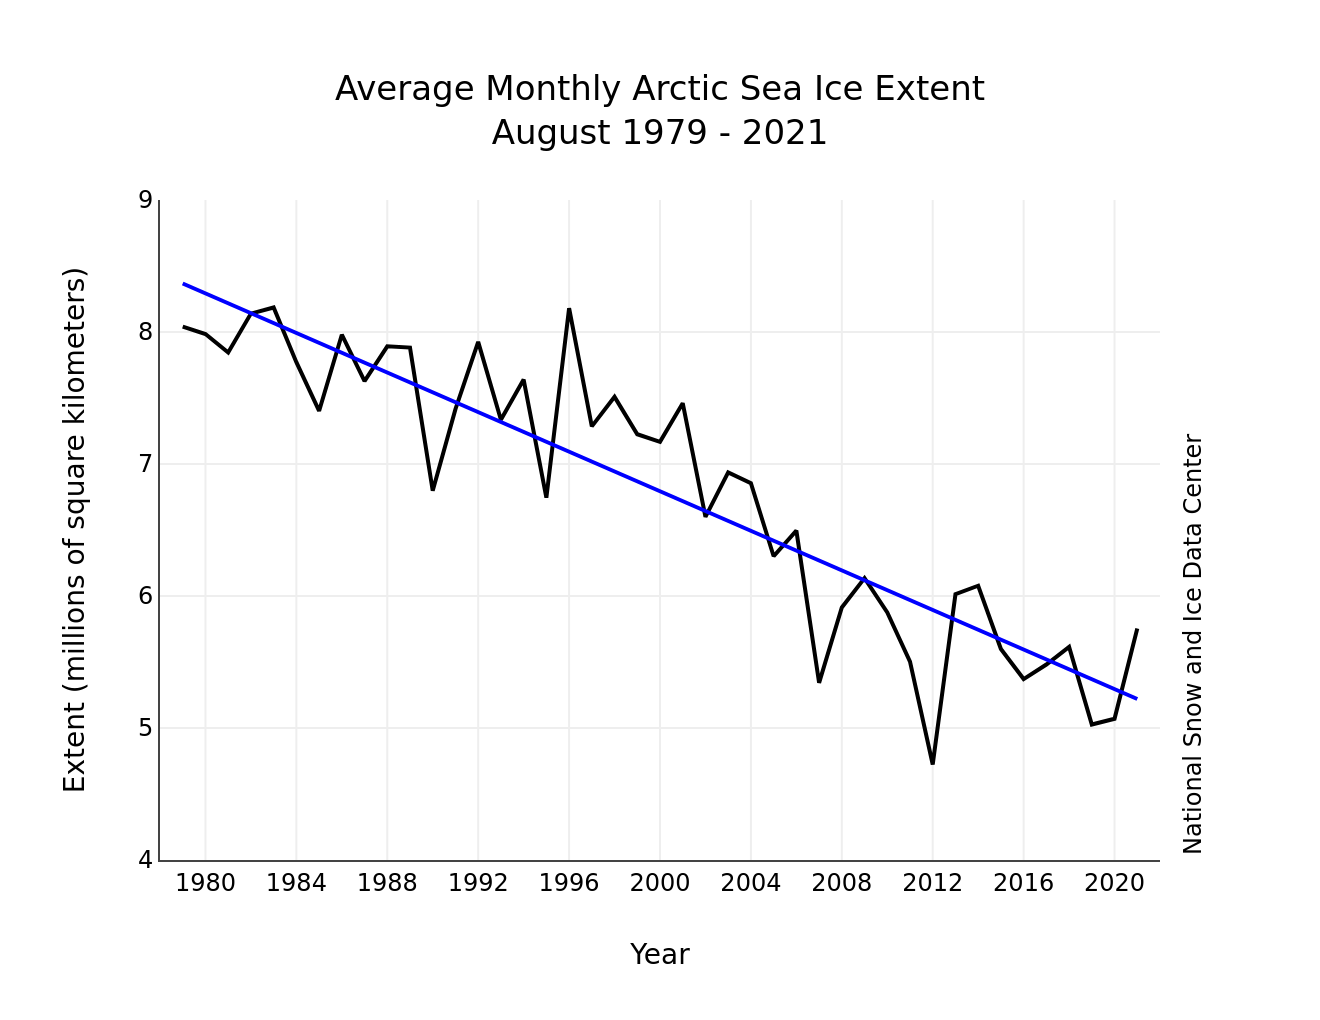
Figure 3. Monthly February ice extent for 1979 to 2022 shows a decline of 2.8 percent per decade.
Credit: National Snow and Ice Data Center
High-resolution image
The downward linear trend in February sea ice extent over the 44-year satellite record is 42,500 square kilometers (16,400 square miles) per year, or 2.8 percent per decade relative to the 1981 to 2010 average. Based on the linear trend, since 1979, February has seen a loss of 1.82 million square kilometers (703,000 square miles). This is equivalent to about seven times the area of Oregon.
Antarctic sea ice minimum sets a record
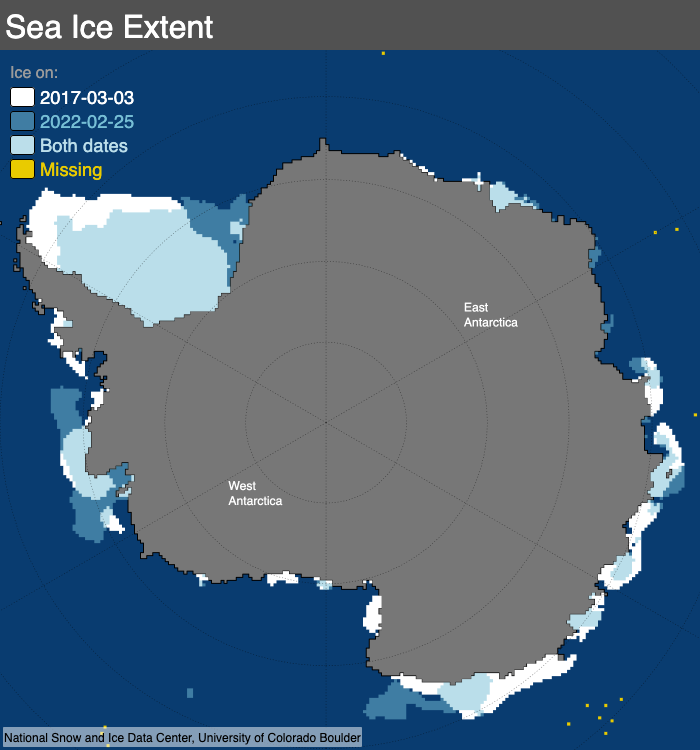
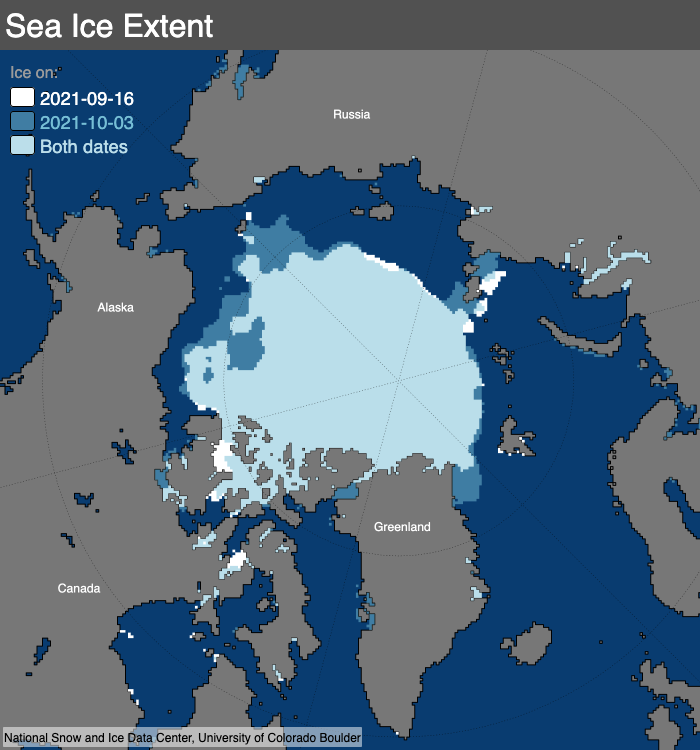
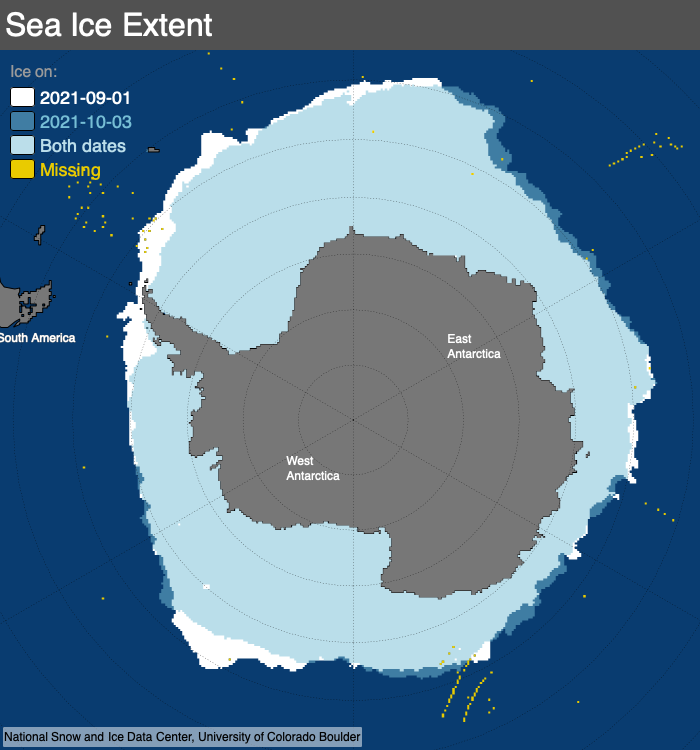
Figure 4a. Before 2022, the previous record low Antarctic sea ice extent was observed on March 3, 2017. This figure shows the difference in sea ice extent from that date (shown in white) compared with the new record low on February 25, 2022 (shown in dark blue). Ice present on both dates is shown in light blue.
Credit: National Snow and Ice Data Center
High-resolution image
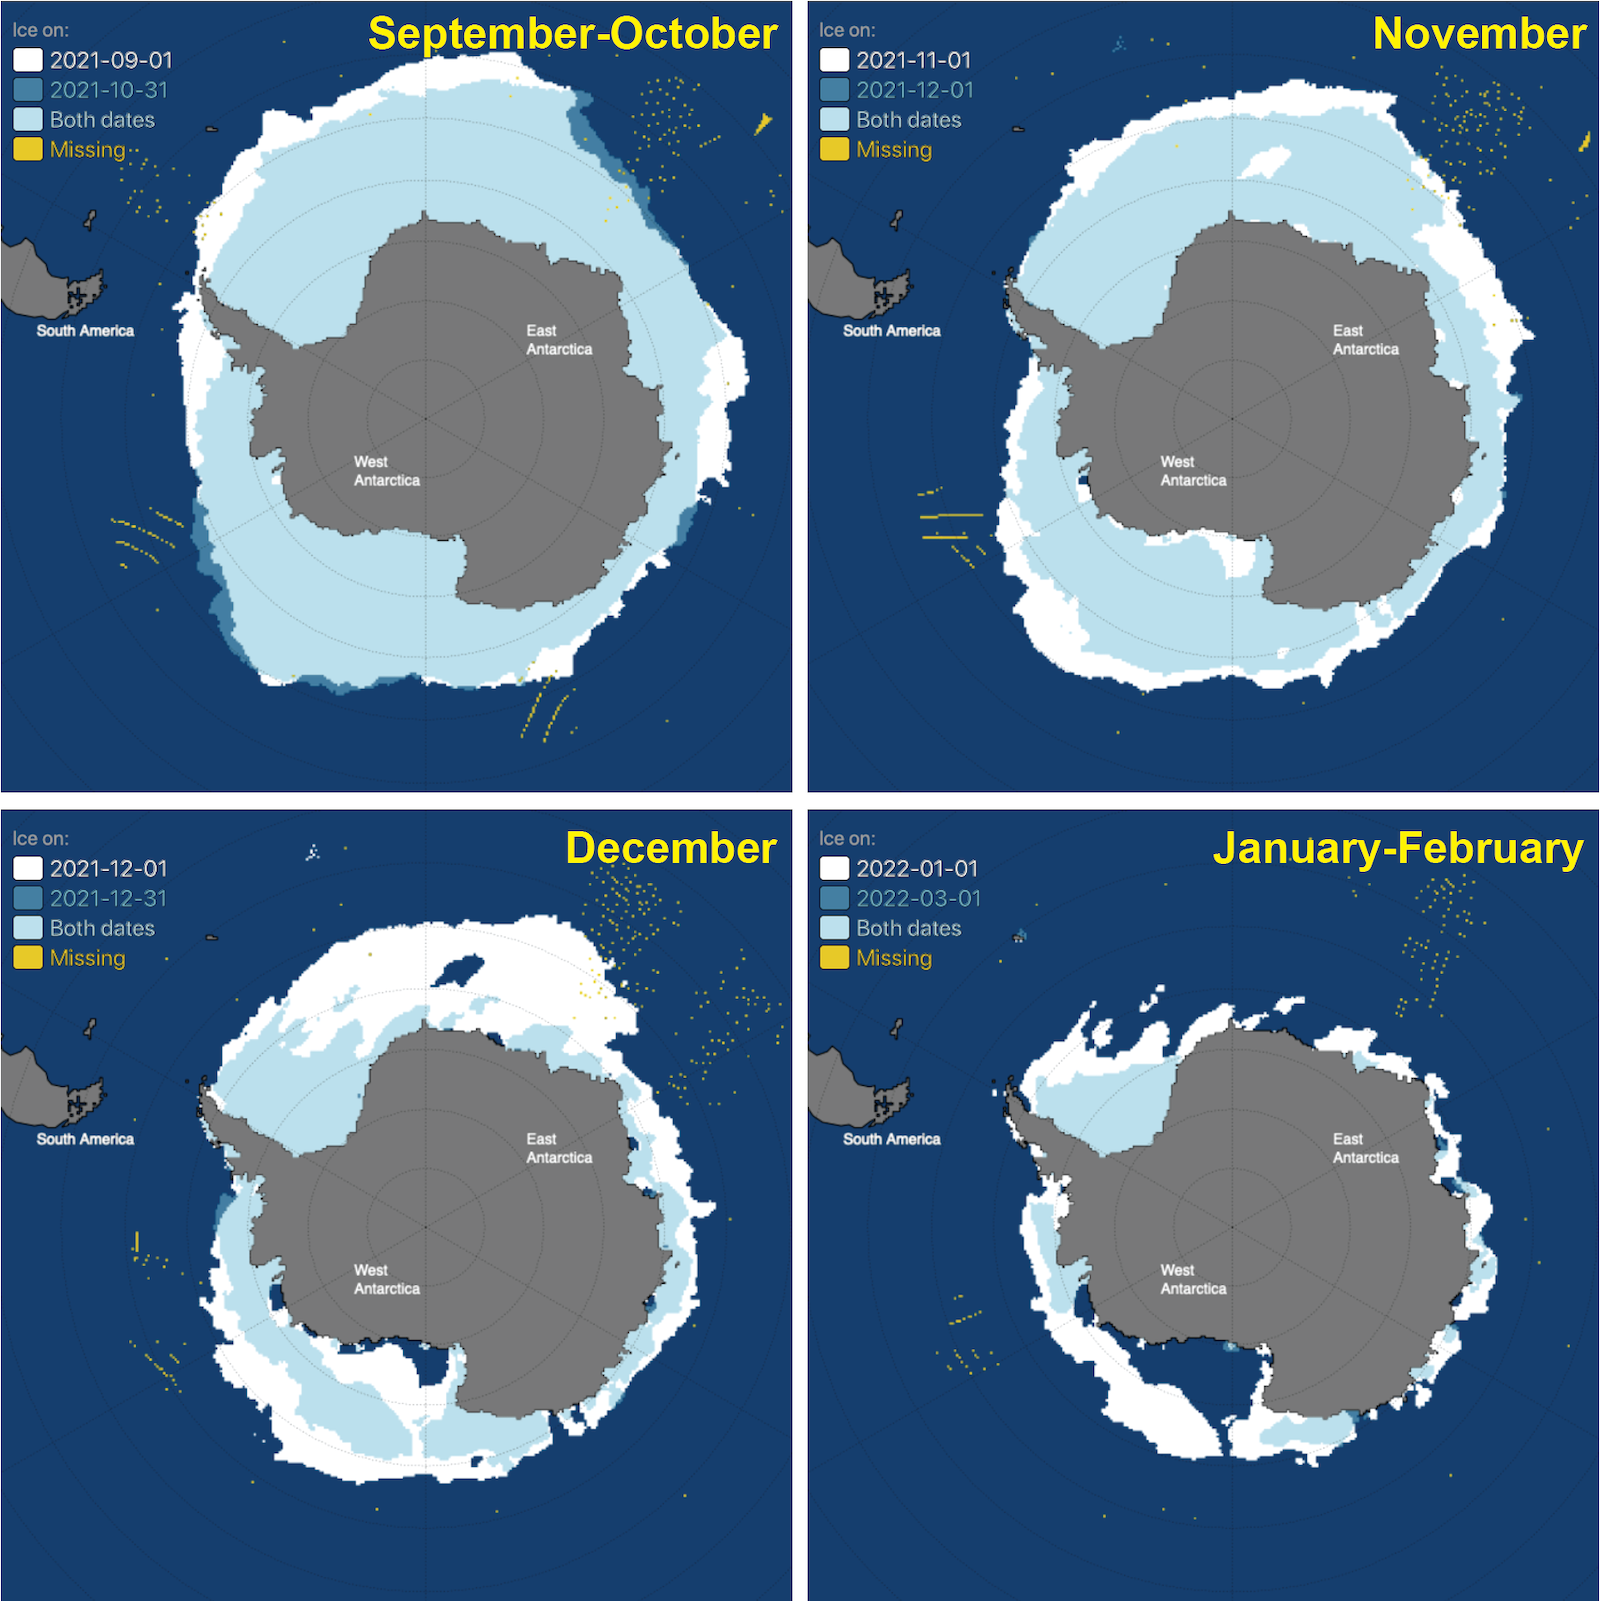
Figure 4b. This figure shows the pattern of the 2021 to 2022 Antarctic sea ice decline since the September winter maximum. Each panel shows the sea ice extent for the two dates in the legend, with the earlier date extent in white and the later date extent in light blue.
Credit: National Snow and Ice Data Center
High-resolution image
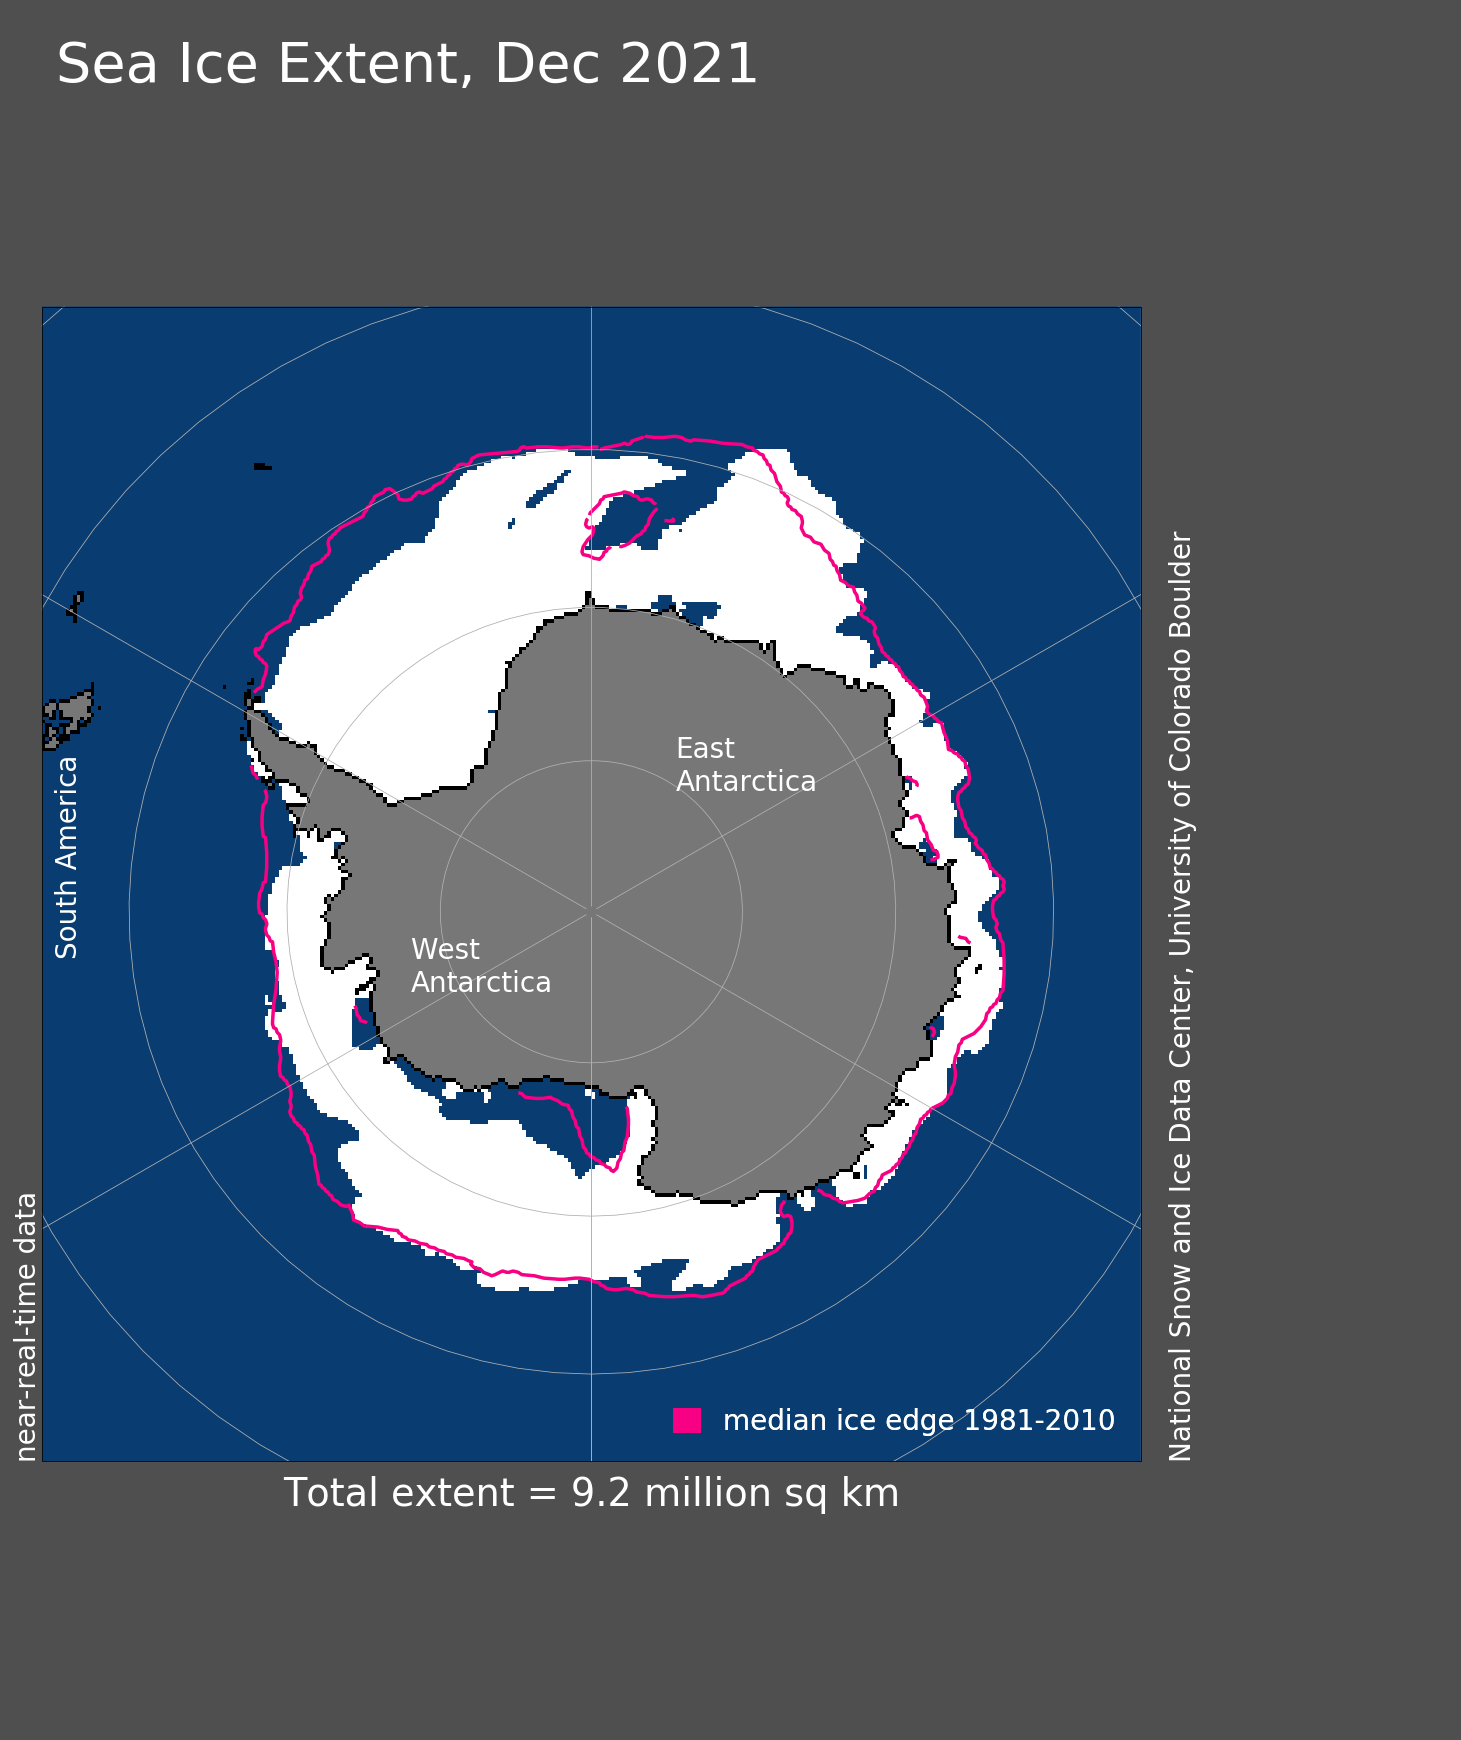
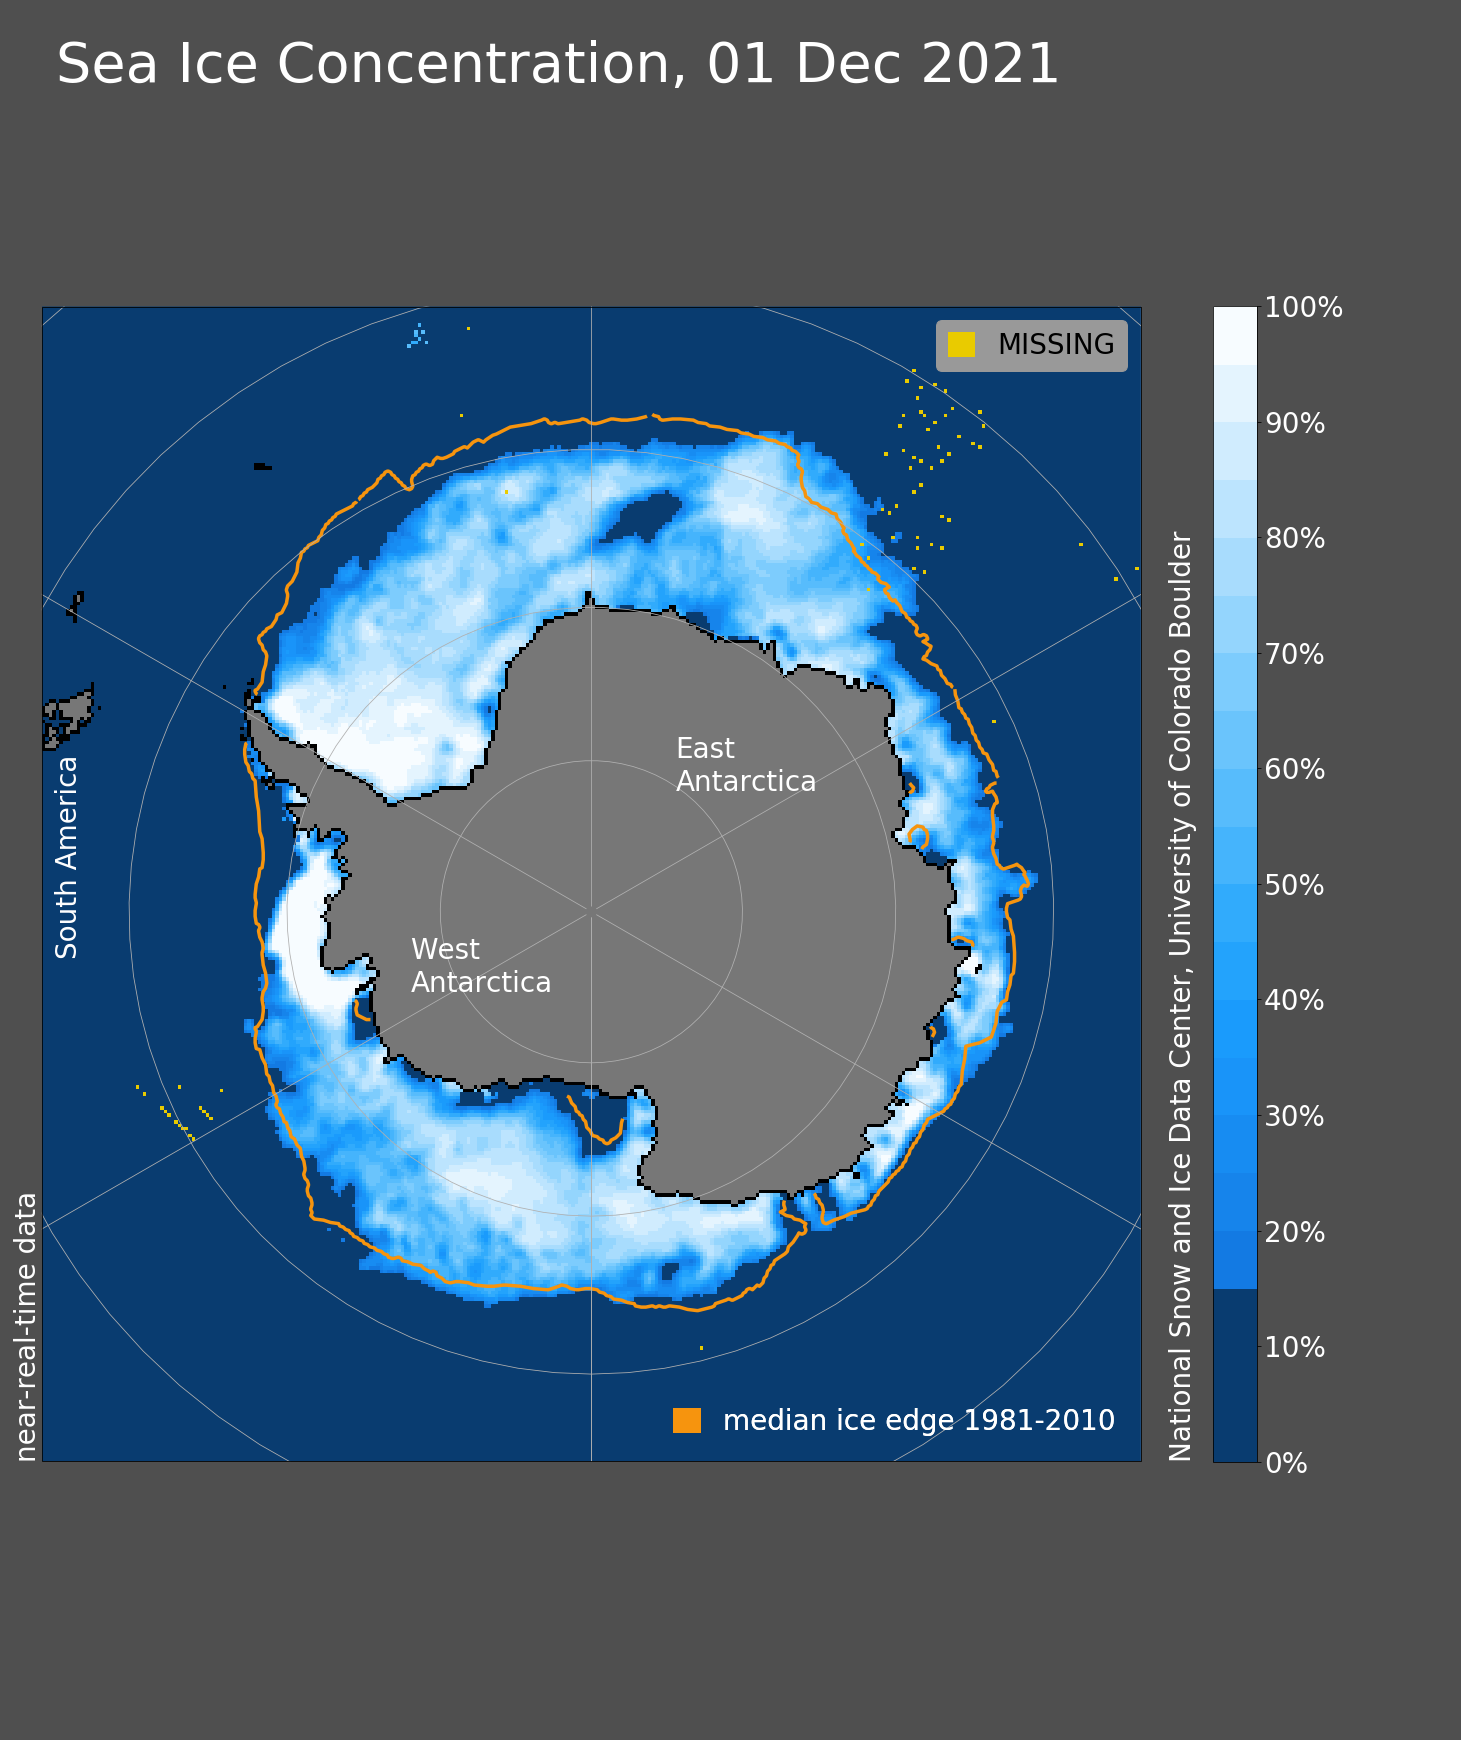
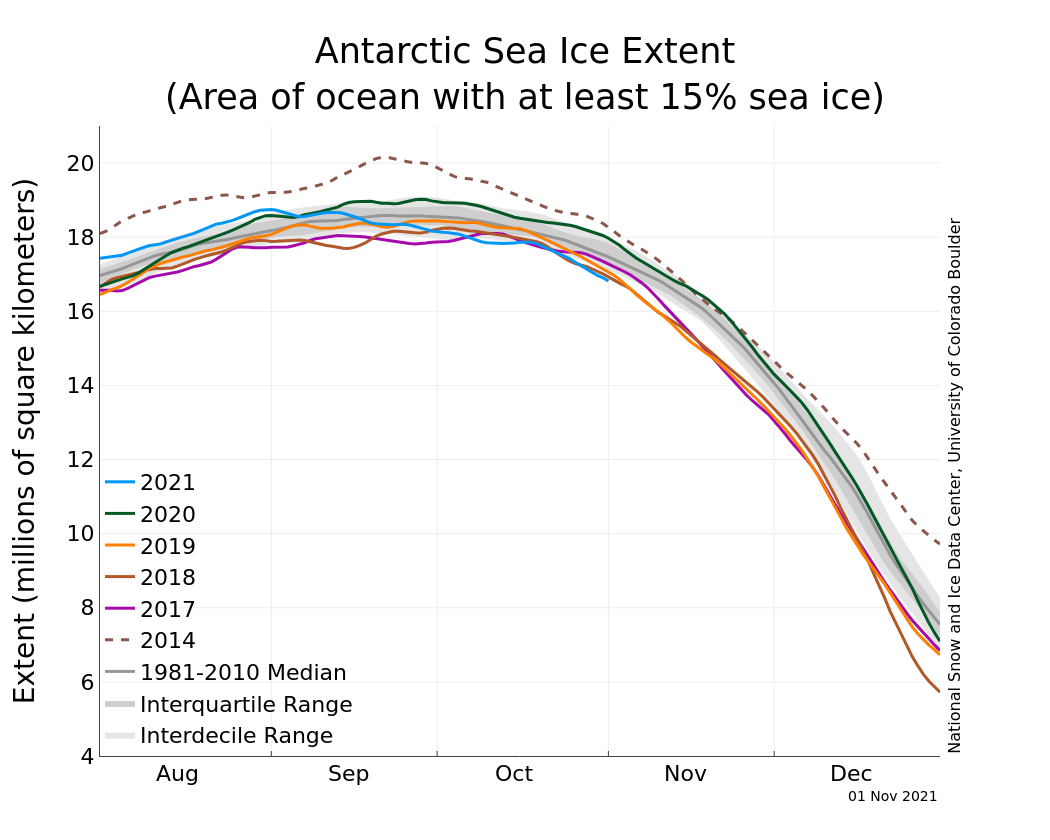
In the south, Antarctic sea ice recently reached its late-summer minimum, dropping below all previous minimum ice extents in the satellite record (Figure 4a). For the first time since the satellite record began in 1979, extent fell below 2 million square kilometers (772,000 square miles), reaching a minimum extent of 1.92 million square kilometers (741,000 square miles) on February 25. Ice extent declined at a near-average rate through most of the month at about 40,000 square kilometers (15,400 square miles) per day, but the decline significantly slowed to about 15,000 square kilometers (5,800 square miles) per day towards the end of the month.
Following the unusually early and above average sea ice maximum extent on September 1, there was a rapid decline in ice extent through the austral spring and summer, with the most notable feature being the clearing out of ice from the Ross and Amundsen Sea sectors during January and February as well as the loss of ice from the northwestern Weddell Sea region during that period (Figure 4b). Much of the Antarctic coast is still ice-free and sea ice remains well below average in the eastern Ross Sea, western Bellingshausen Sea, and northwestern Weddell Sea. However, persistent patches of high concentration sea ice in the area of Pine Island Bay and in the central Weddell Sea are obstructing research groups trying to work in those areas. The RV Nathaniel B Palmer, operated by the National Science Foundation (NSF), and the RV Araon, operated by South Korea’s Korean Polar Research Institute (KOPRI), have been attempting to conduct research near the outlet of Thwaites Glacier. The research teams were forced to work at an adjacent region to the west, the Dotson Ice Shelf, to avoid the heavy ice conditions near Thwaites.
Ups and downs in the southern ice
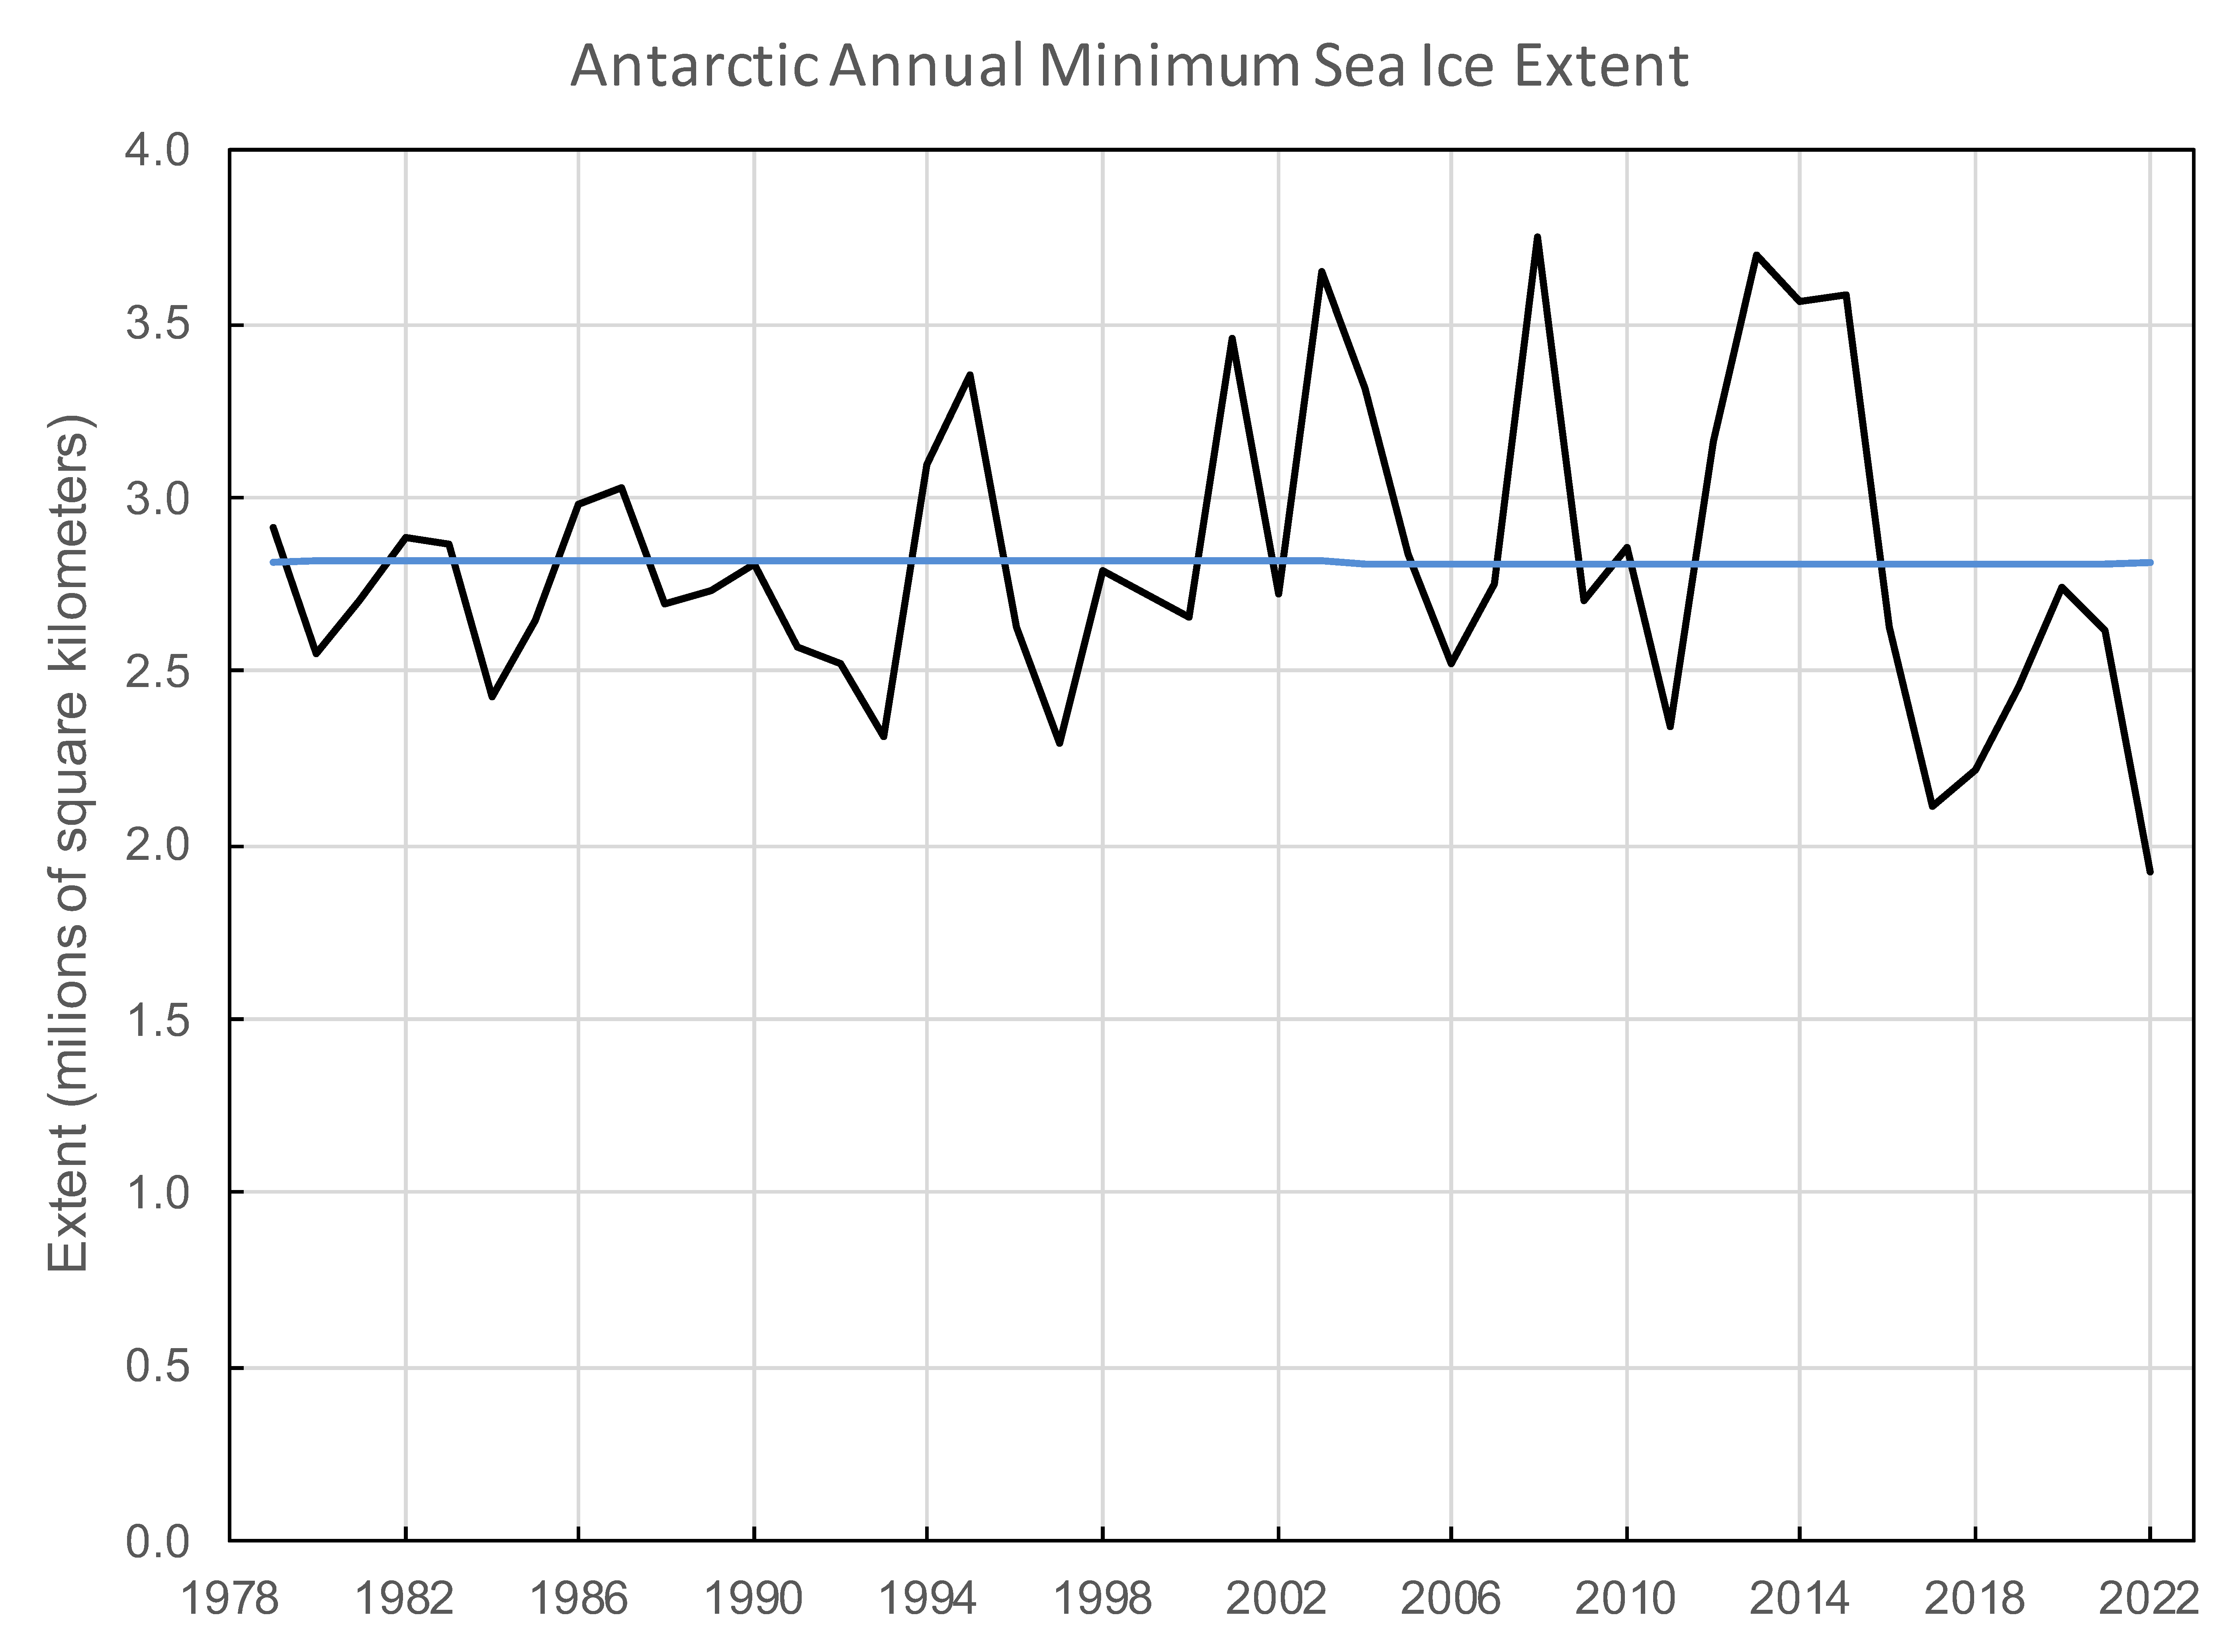
Figure 5a. This plot shows the annual Antarctic minimum daily (5-day running average) extent for 1979 to 2022 (black) and the 1979 to 2022 trend line (blue). For the first time since the satellite record began in 1979, sea ice in the Southern Hemisphere fell below 2 million square kilometers (772,000 square miles), reaching a minimum of 1.92 million square kilometers (741,000 square miles) on February 25.
Credit: National Snow and Ice Data Center
High-resolution image
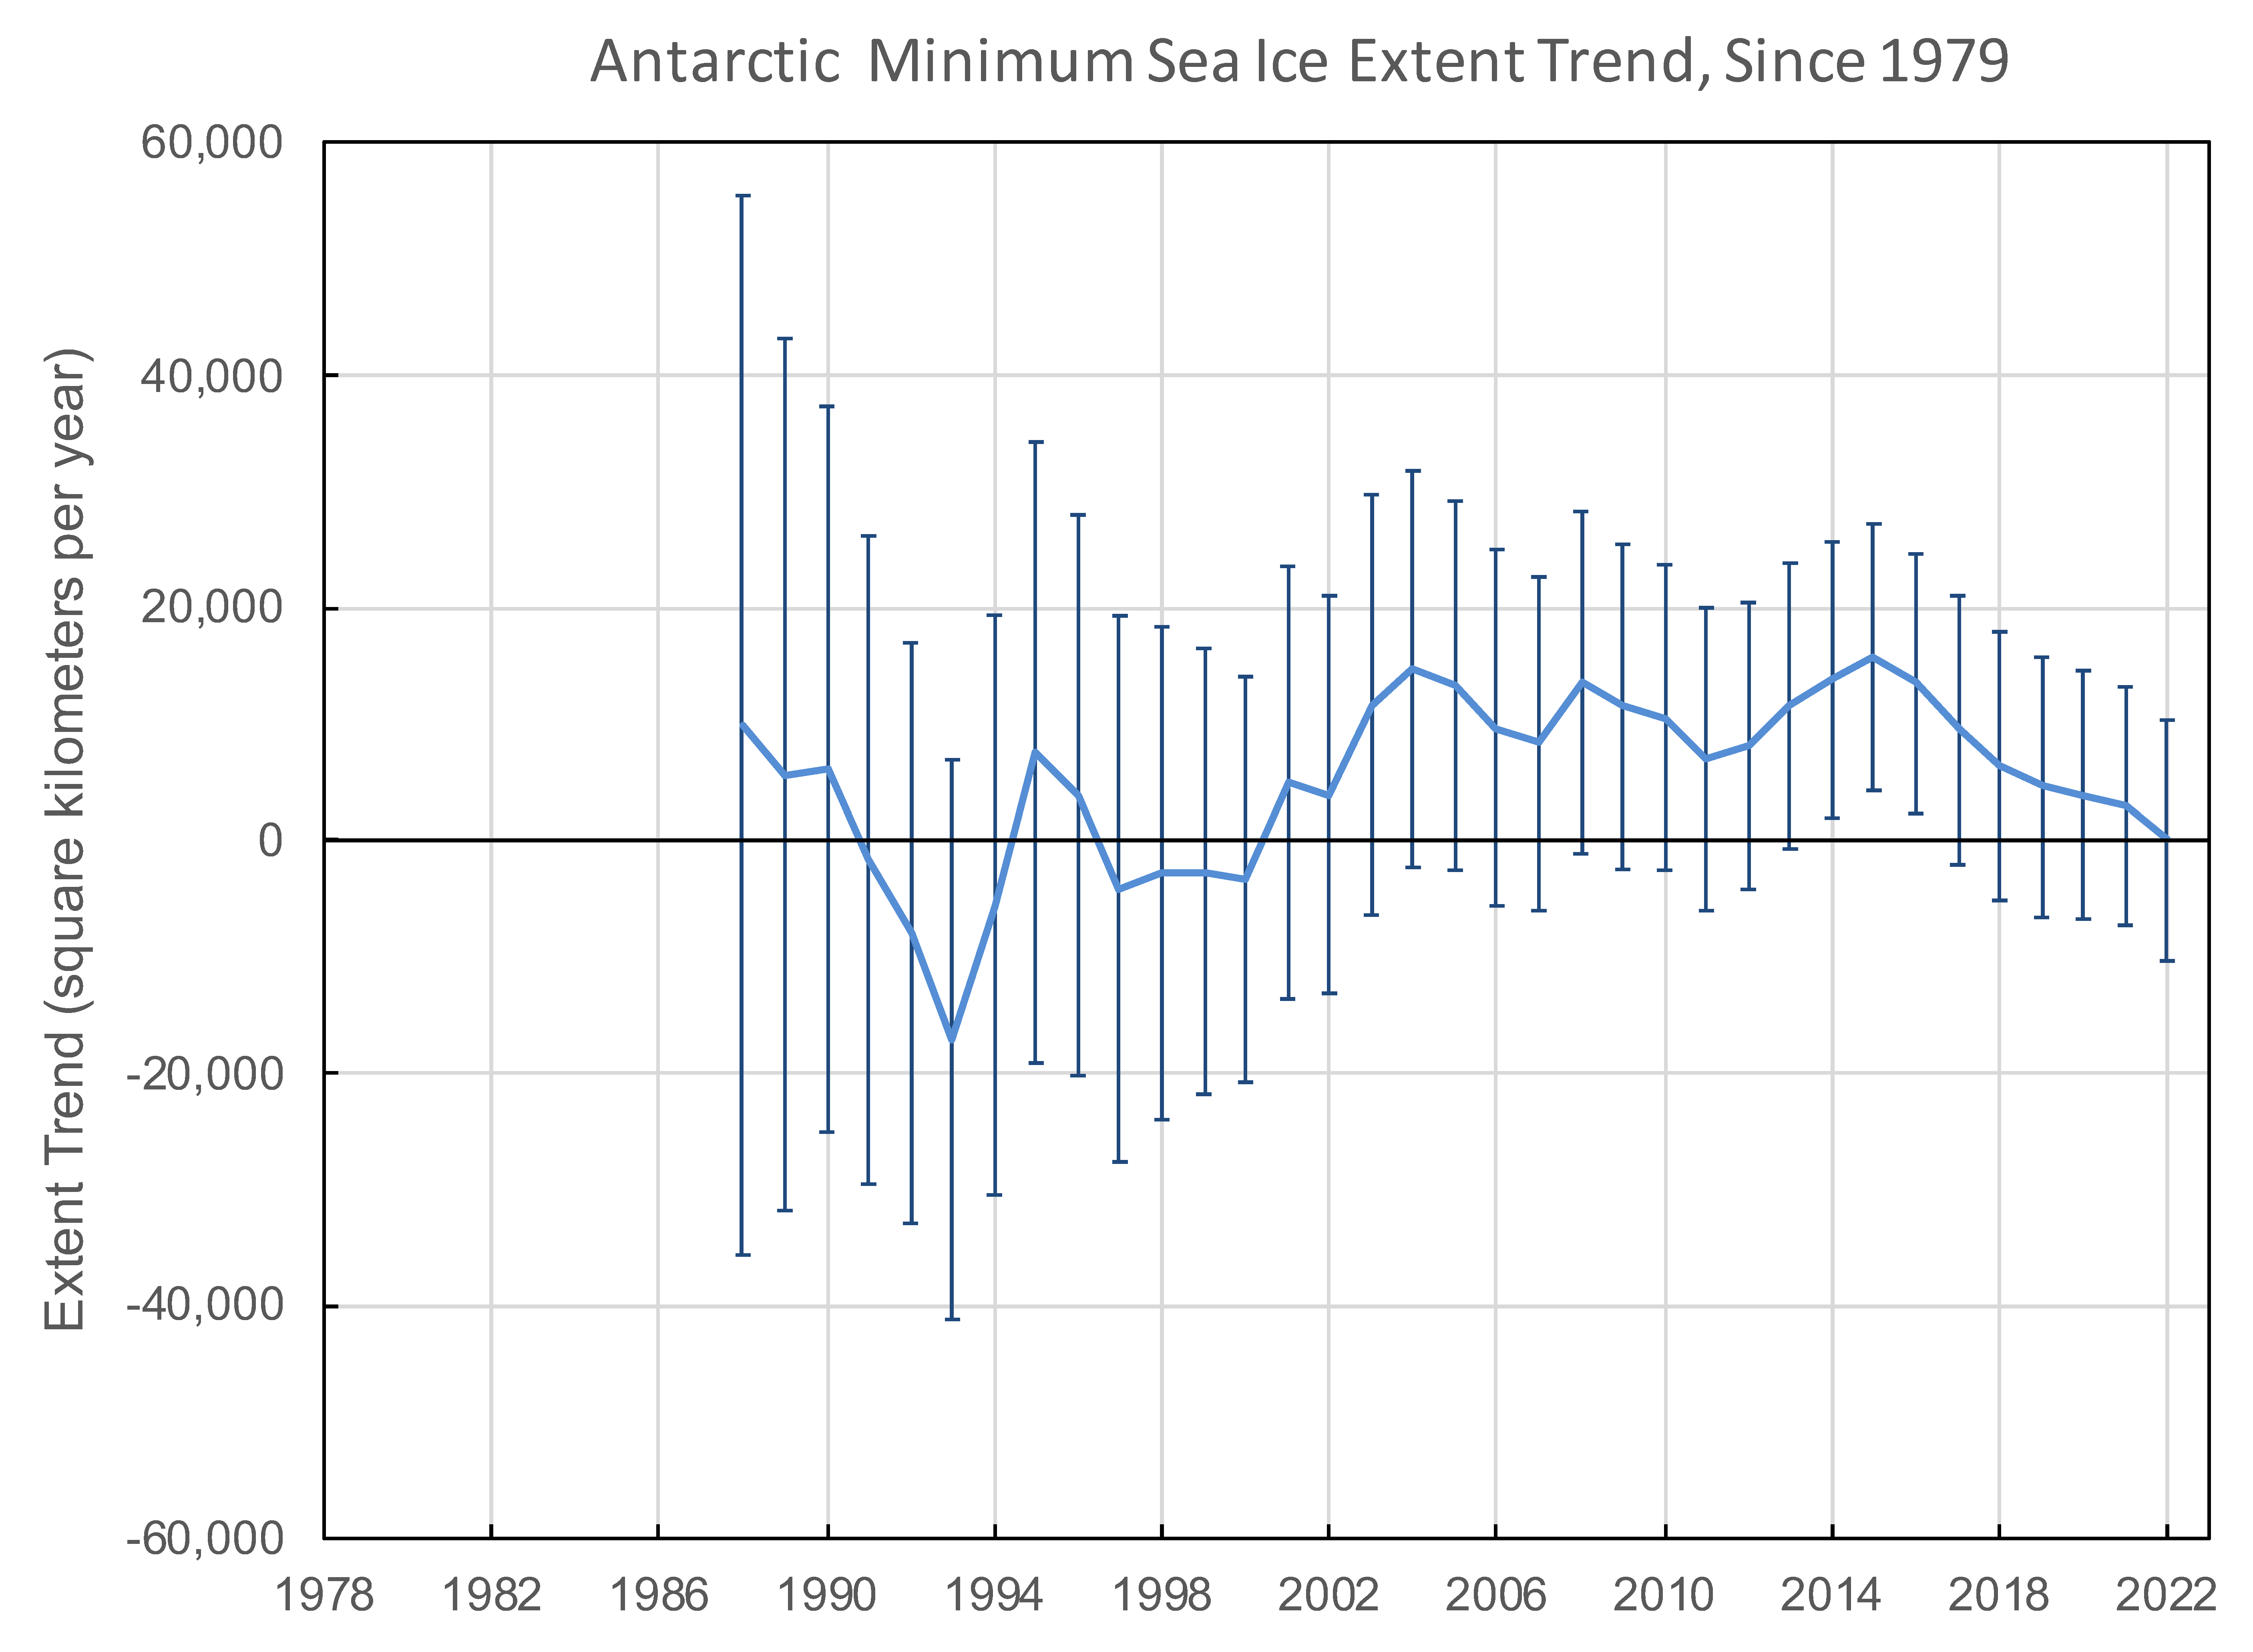
Figure 5b. This plot shows the changes in the trend of seasonal sea ice minimums over the satellite record for Antarctic sea ice, beginning with the trend after ten years and proceeding year-by-year. For much of the satellite monitoring period, the trend has been towards increasing ice, but the vertical bars show that the high variability in the records means that the trend is not statistically significant. As of 2022, the net trend is very close to zero.
Credit: National Snow and Ice Data Center
High-resolution image
The Antarctic sea ice is notable for its variability, both seasonally, losing over 80 percent of its ice cover from its maximum to its annual minimum extent, and from year to year. While 2022 had a record low minimum, the highest minimum in the satellite record was observed as recently as 2015 (Figure 5a). The effect of this large year to year variability on computed trends is evident when plotting how the trend has changed over time (Figure 5b). We calculated the trend for the period of 1979 to 1988, then 1979 to 1989, then 1979 to 1990, and so forth.
The trend is initially positive for the 1979 to 1988 period, but then dips negative for a couple years, then bounces between positive and negative until the year 2001, after which it remained positive through 2021. Also plotted is the 2 standard deviation range of the trend as the vertical “whiskers” for each year; this is a measure of how confident one should be in the trend values. If the 2 standard deviation range for a computed trend crosses the zero line (i.e., encompasses both positive and negative values), it means that the trend value may simply be due to the year-to-year swings in the extent. Phrased differently, it means that the trend does not meet the 95 percent confidence level for statistical significance. So while the trend in minimum extent has been largely positive over the past two decades, it has not been significant except the three-year period, 2014 to 2016. Through 2022, the trend starting in 1979 is ever so slightly negative again: -18 square kilometers (-6.94 square miles) per year. But it is still not a significant trend. Variability in summer continues to rule Antarctic sea ice extent.
Eos recently published an article that summarizes three different modeling studies that attempt to explain the causes of the variability and the (until this year) positive trend in Antarctic sea ice extent. The article finds that while winds and sea surface temperature are important contributors to the growth of Antarctic sea ice over the last 30+ years, there are likely additional factors at play.
Search for the Endurance

Figure 6a. Mrs. Chippy, the resident cat of Endurance, the vessel that carried Ernest Shackleton and his team to Antarctica in 1914, stands on the shoulder of a crewmember. Mrs. Chippy did not survive the expedition.
Credit: Perce Blackborow
High-resolution image
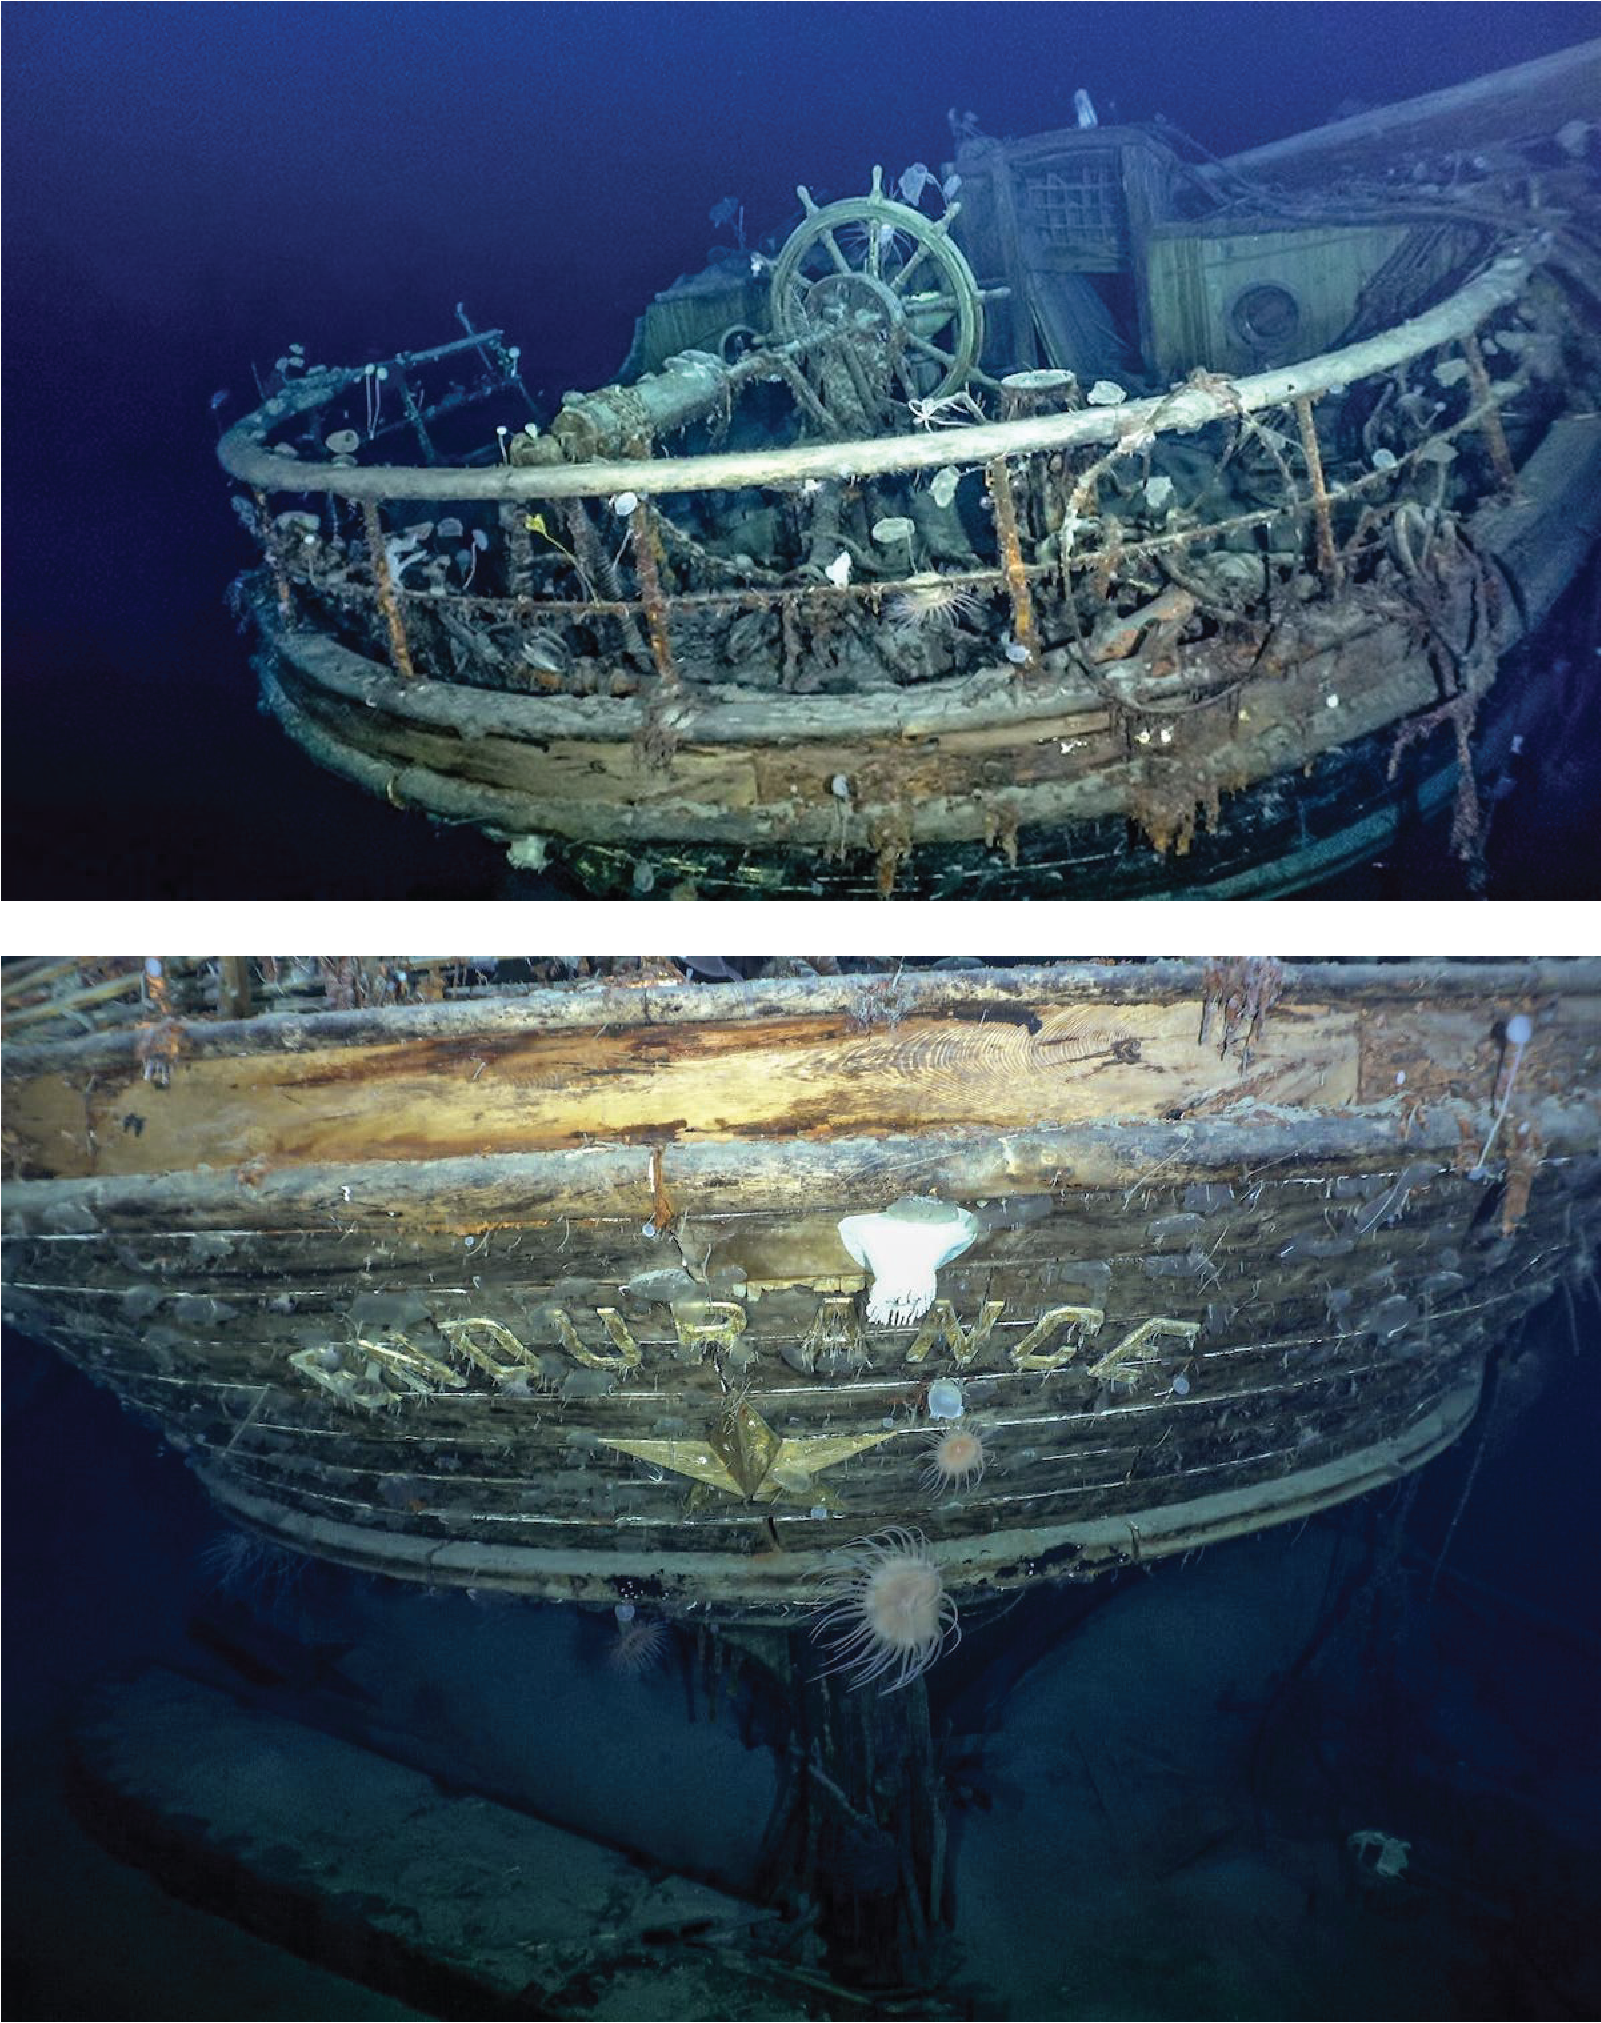
Figure 6b. These images show the stern of the Endurance, the ship used by Ernest Shackleton to reach the Weddell Sea on his ill-fated Imperial Trans-Antarctic Expedition. The ship was found in 3,000 meters (10,000 feet) of water in the northwestern Weddell Sea by a search expedition using uncrewed submersible vehicles.
Credit: Falklands Maritime Heritage Trust and National Geographic.
High-resolution image
In the Weddell Sea, the South African research icebreaker RV Agulhas II has been attempting to find the wreck of the Endurance on the seafloor. The Endurance is the vessel that brought Ernest Shackleton and his team to Antarctica in 1914, only to be blocked by sea ice. The ice later crushed the ship and the team was forced to trek across the sea ice and sail to a small, uninhabited island near the tip of the Antarctic Peninsula. Shackleton and five others then sailed in a lifeboat over 1,600 kilometers (1,000 miles) to South Georgia Island, one of the greatest polar voyages in history, to reach civilization. They then returned in a Chilean ship, the Yelcho, to rescue the rest of the expeditioners on Elephant Island. Miraculously, all of the human crew were successfully rescued. However, several sled dogs and one male cat, Mrs. Chippy, did not survive (Figure 6a).
On March 5, the Endurance was found by undersea drones operating from the South African ice breaker (Figure 6b). This was after just two weeks of searching in the area where the navigator of the 1915 expedition, Frank Worsely, noted its last location. It was found in 3,000 meters (10,000 feet) of water in near-pristine condition because of the absence of wood-boring worms in the Weddell benthic ecosystem. The ship was found just 6 kilometers (4 miles) from the last reported location, made on November 21, 1915, with sextant and chronometer.
Further reading
Alexander, C., and J. Dorman. 2003. The Endurance: Shackleton’s Legendary Antarctic Expedition. Columbia TriStar.
Amos, J. 2022. Endurance: Shackleton’s lost ship is found in Antarctic. BBC. https://www.bbc.com/news/science-environment-60662541
Blanchard-Wrigglesworth, E., I. Eisenman, S. Zhang, S. Sun, and A. Donohoe. 2022. New Perspectives on the Enigma of Expanding Antarctic Sea Ice. Eos.
https://eos.org/science-updates/new-perspectives-on-the-enigma-of-expanding-antarctic-sea-ice
Davidson, L. 2022. The Adventures of Mrs. Chippy, Shackleton’s Seafaring Cat. History Hit. https://www.historyhit.com/mrs-chippy-shackletons-seafaring-cat/
Sir Ernest Shackleton Endurance Expedition Trans-Antarctica 1914-1917 – 1, Departure. Cool Antarctica. https://www.coolantarctica.com/Antarctica%20fact%20file/History/Shackleton-Endurance-Trans-Antarctic_expedition.php
Worsley, F. A. 1998. Shackleton’s boat journey. WW Norton & Company.
Update
When we first published this post, the Endurance had not yet been found. We updated this post on March 9, 2022, to include the information about the discovery of the Endurance.


