The Arctic sea ice minimum extent is imminent. After a cool and stormy summer, this year’s minimum extent will be one of the highest of the past decade, despite the amount of multiyear ice standing at a near-record low. A large area of low ice concentration persists in the Beaufort and Chukchi Seas, and some of this may still be compacted by winds or melt away because of the remaining heat in the upper ocean.
Overview of Conditions
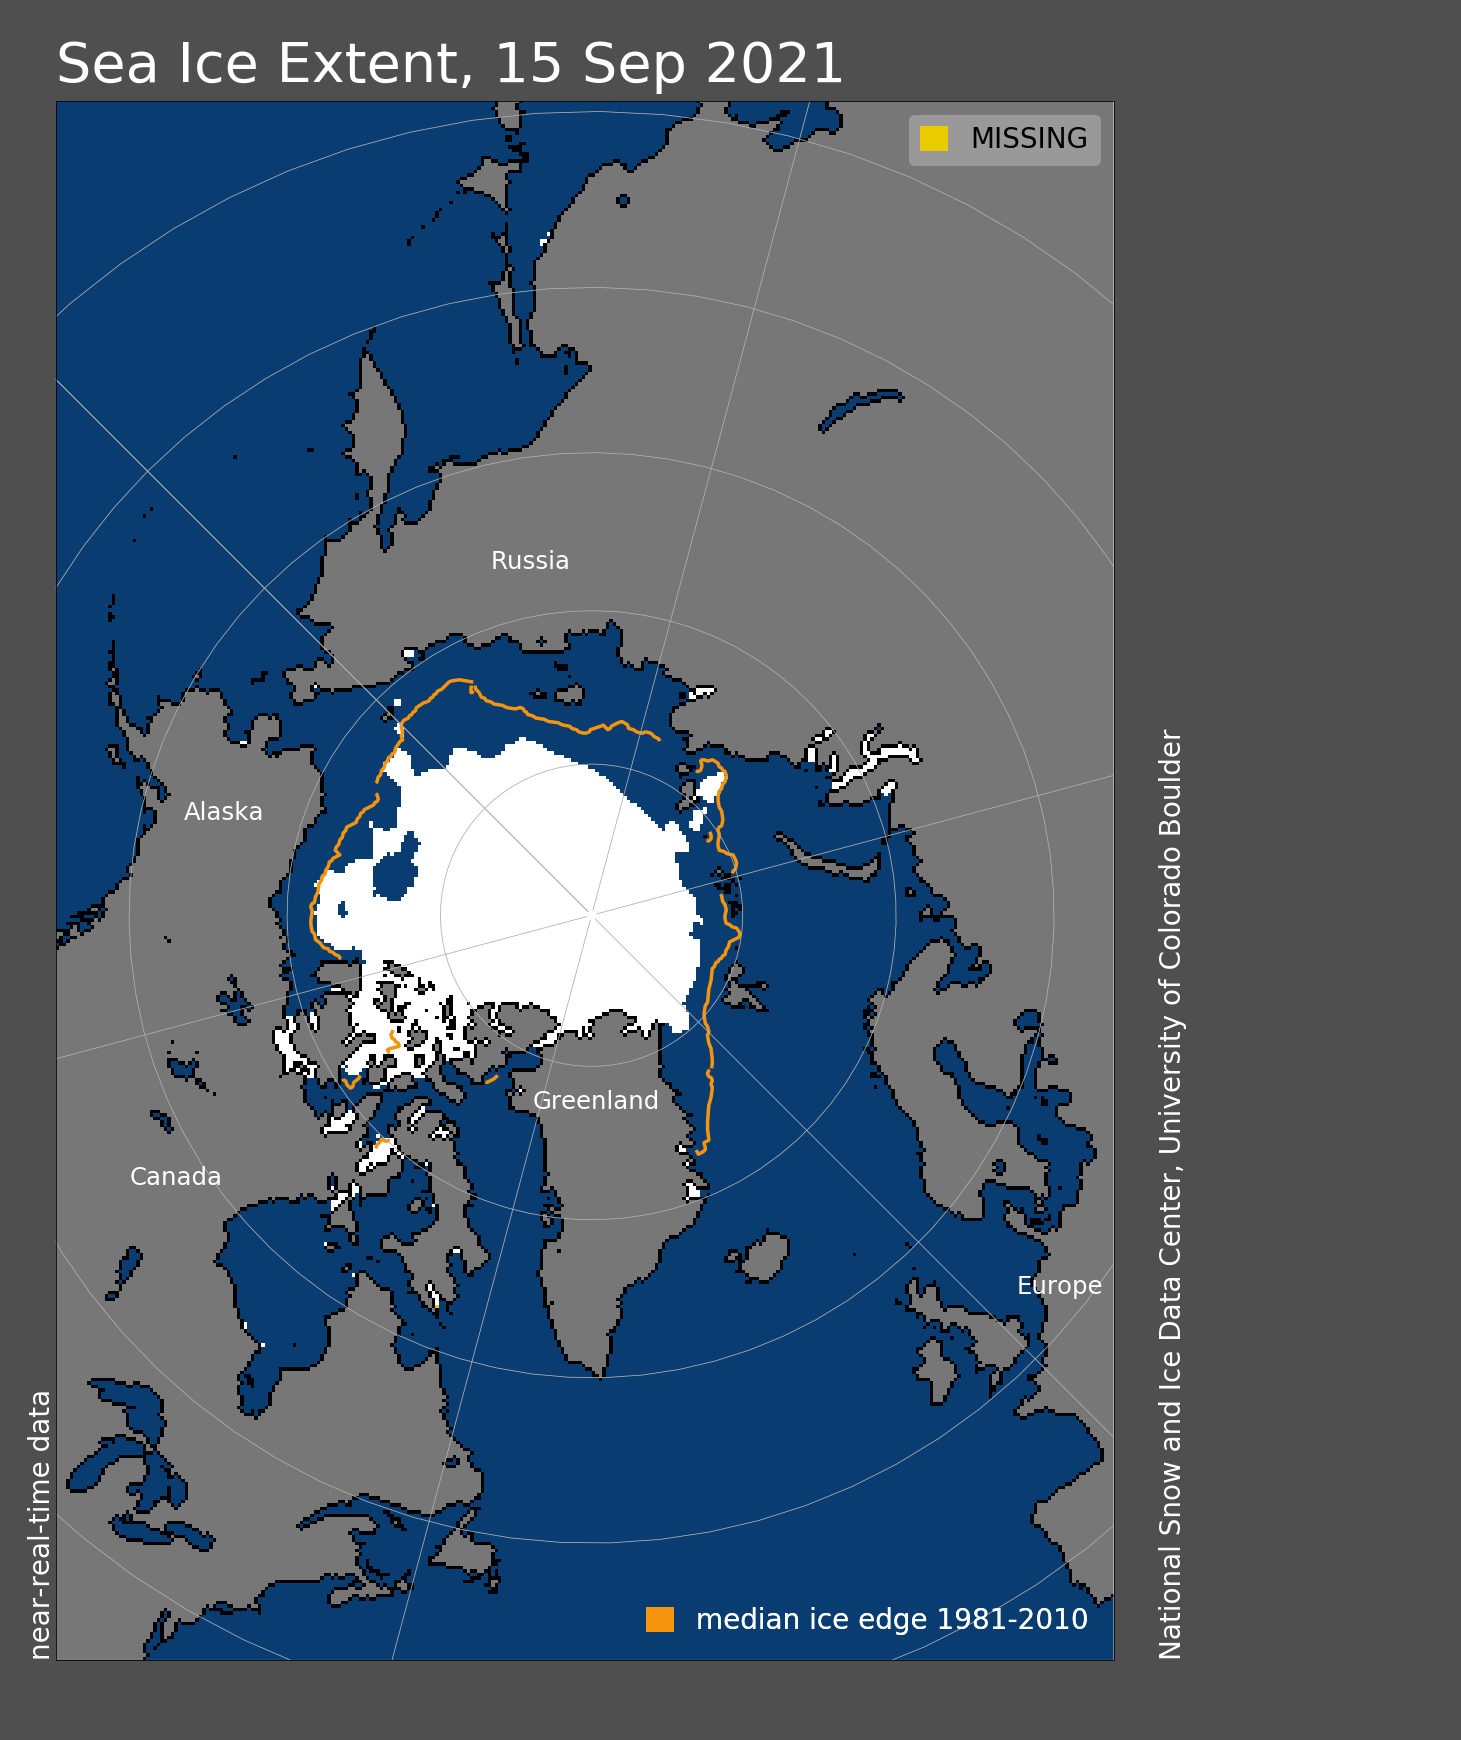
Figure 1a. Arctic sea ice extent for September 15, 2021 was 4.73 million square kilometers (1.83 million square miles). The orange line shows the 1981 to 2010 average extent for that day. Sea Ice Index data. About the data
Credit: National Snow and Ice Data Center
High-resolution image
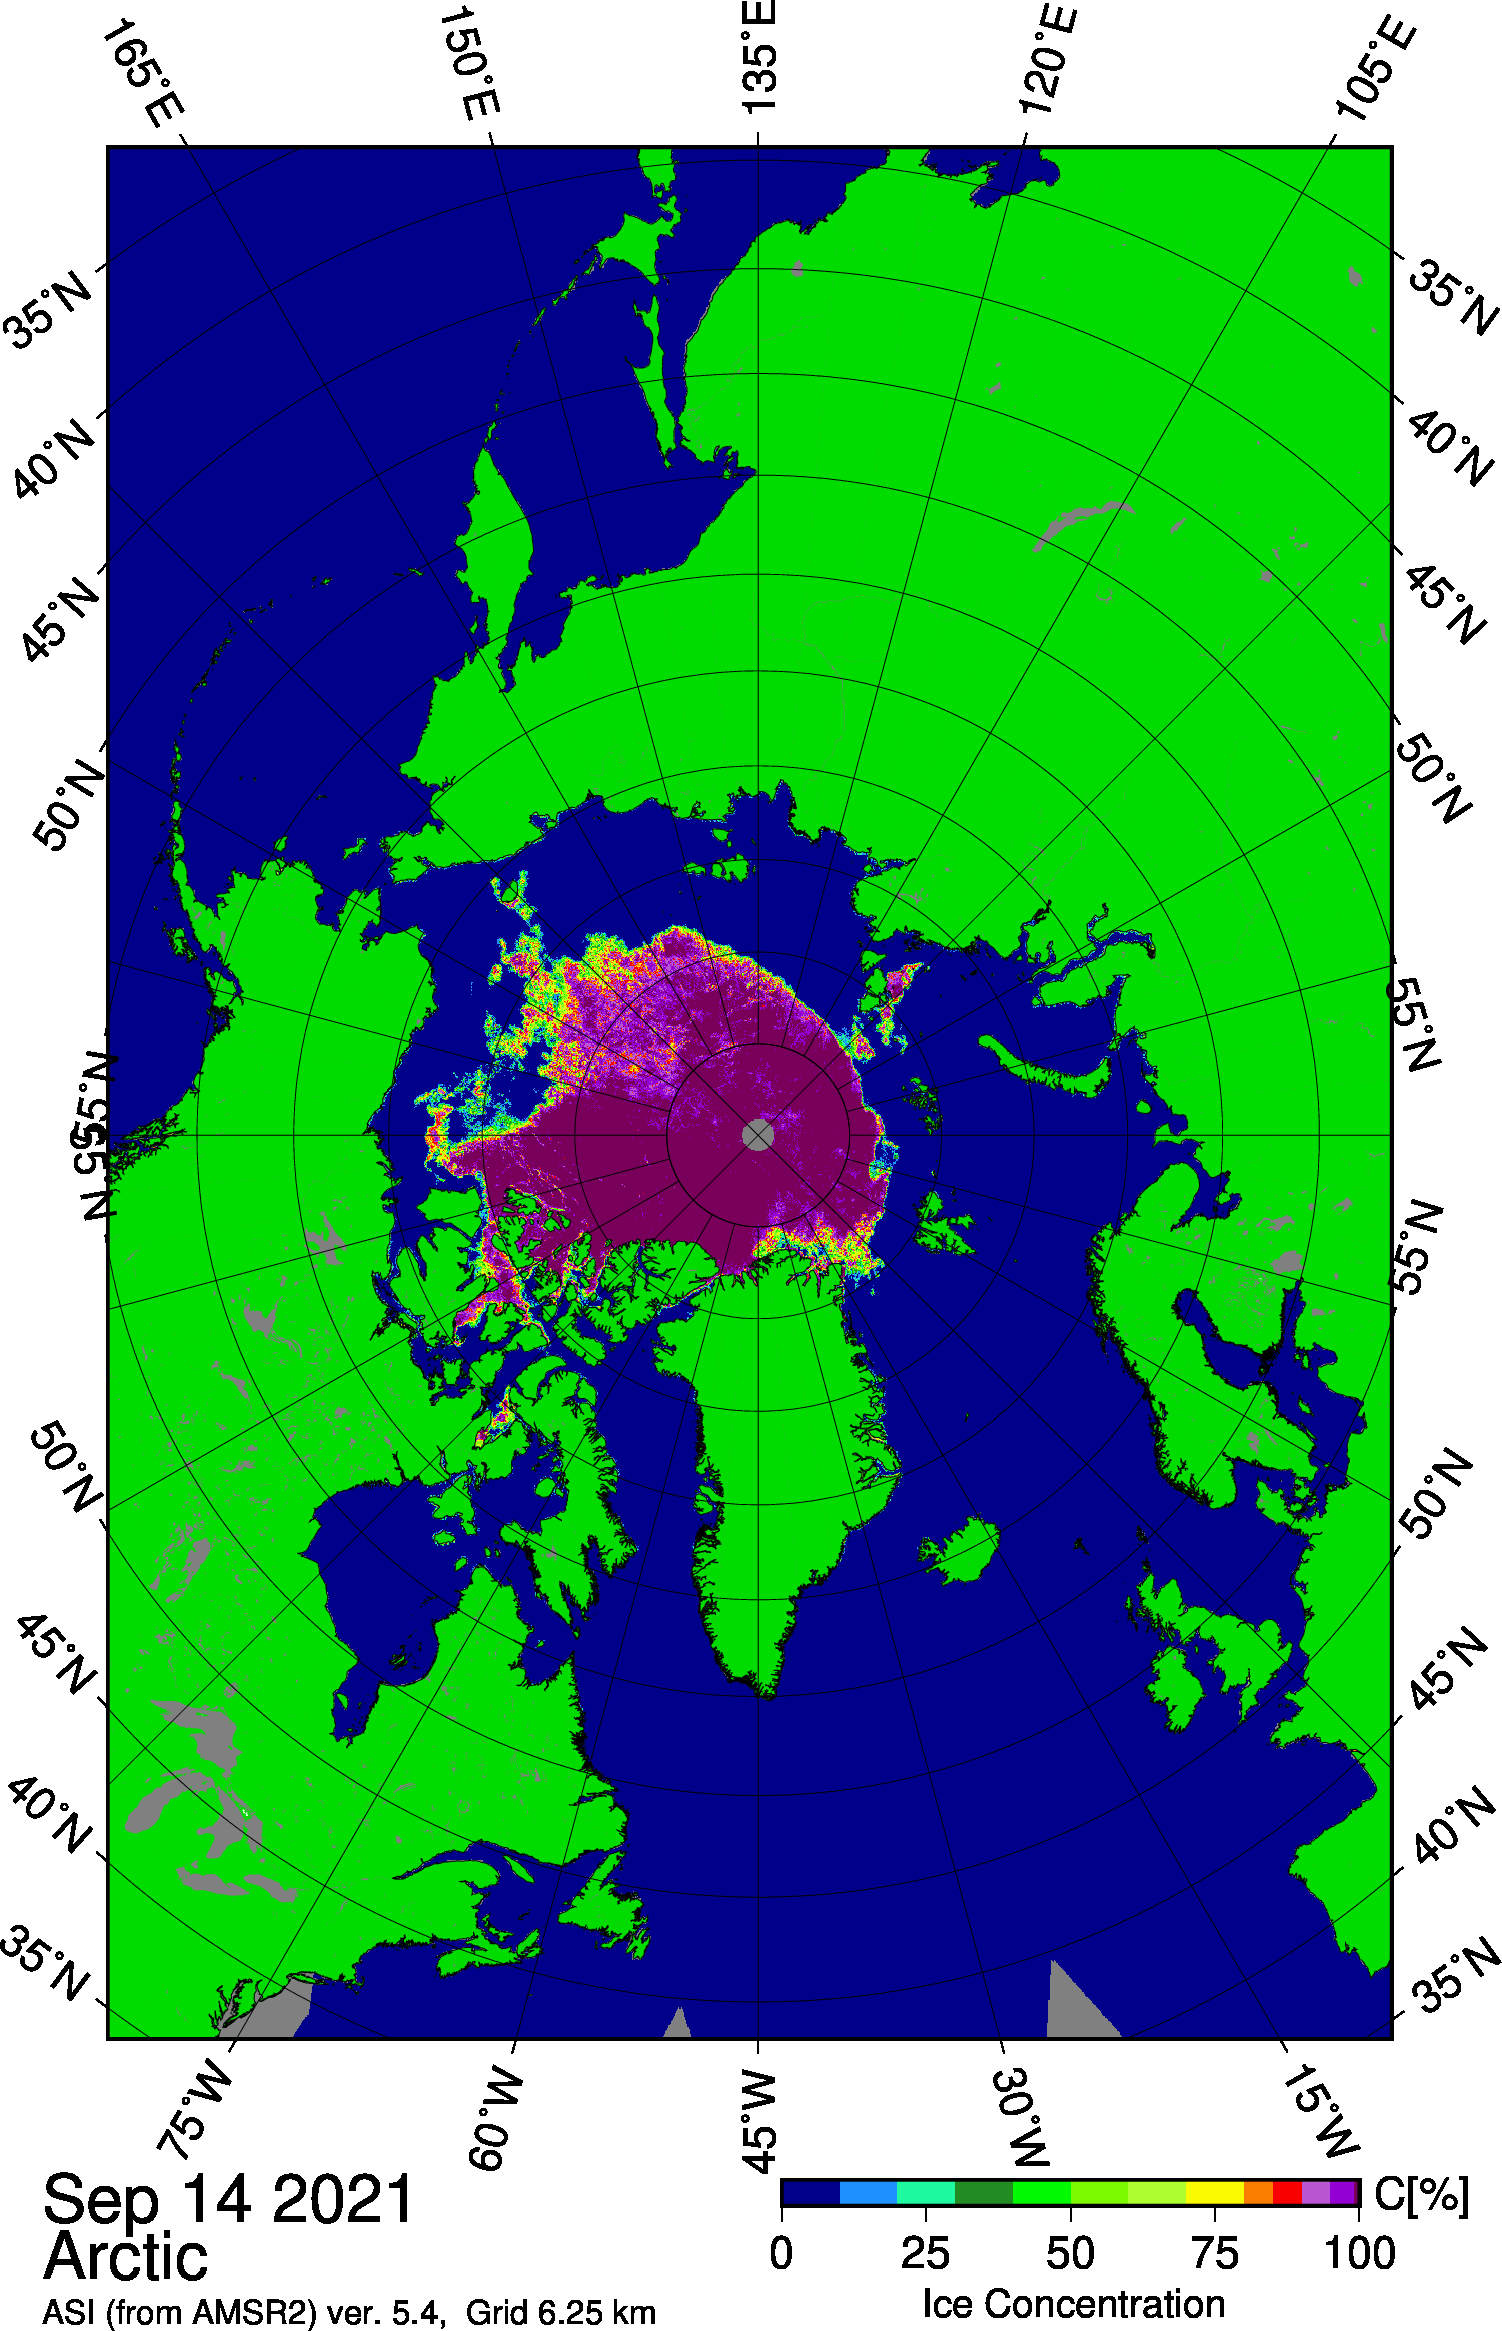
Figure 1b. This map shows Arctic sea ice concentration based on data from the Advanced Microwave Scanning Radiometer 2 (AMSR2) data as of September 14, 2021. Yellows indicate sea ice concentration of 75 percent; dark purples indicate sea ice concentration of 100 percent.
Credit: University of Bremen
High-resolution image
As of September 15, Arctic sea ice extent stood at 4.73 million square kilometers (1.83 million square miles), placing it tenth lowest in the satellite record for the date. While extent continues to decline as of this post, the seasonal minimum is likely to occur soon, depending on how much heat remains in the upper ocean and on winds, which can compact the ice cover or spread it out. If the winds push the ice poleward, this may further reduce the total extent. Nevertheless, the seasonal minimum extent promises to be one of the highest of the past decade—only 2013, 2014, and 2018 are currently tracking above the 2021 sea ice extent.
It has been an odd summer. While fairly cool and stormy summer conditions limited summer melt, as discussed in our earlier post, the amount of multiyear ice is at a record low, roughly one-fourth of the amount seen in the early 1980s. Ice loss the first two weeks of September primarily occurred in the Beaufort and Chukchi Seas, and to a lesser extent also surrounding Severnaya Zemlya. As seen in Advanced Microwave Scanning Radiometer 2 (AMSR-2) imagery (Figure 1b), areas of low concentration ice persist in the Beaufort and Chukchi Seas; how much of this ice melts away largely depends on ocean heat. Satellite mapping of sea surface temperatures shows much of the open ocean surrounding the low ice concentration area is already near the freezing point. By contrast, the compact, well-defined ice edge along most of the Russian side of the Arctic Ocean indicates that freezing is already underway in this area.
Conditions in context
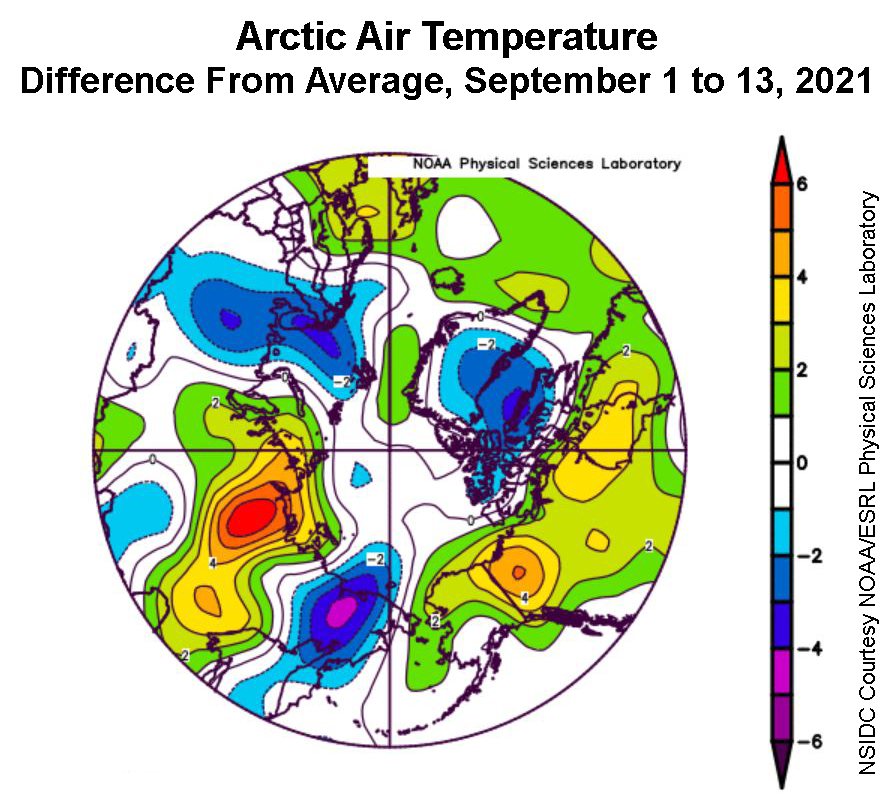
Figure 2a. This plot shows the departure from average air temperature in the Arctic at the 925 hPa level, in degrees Celsius, between September 1 to 13, 2021. Yellows and reds indicate higher than average temperatures; blues and purples indicate lower than average temperatures.
Credit: NSIDC courtesy NOAA Earth System Research Laboratory Physical Sciences Laboratory
High-resolution image
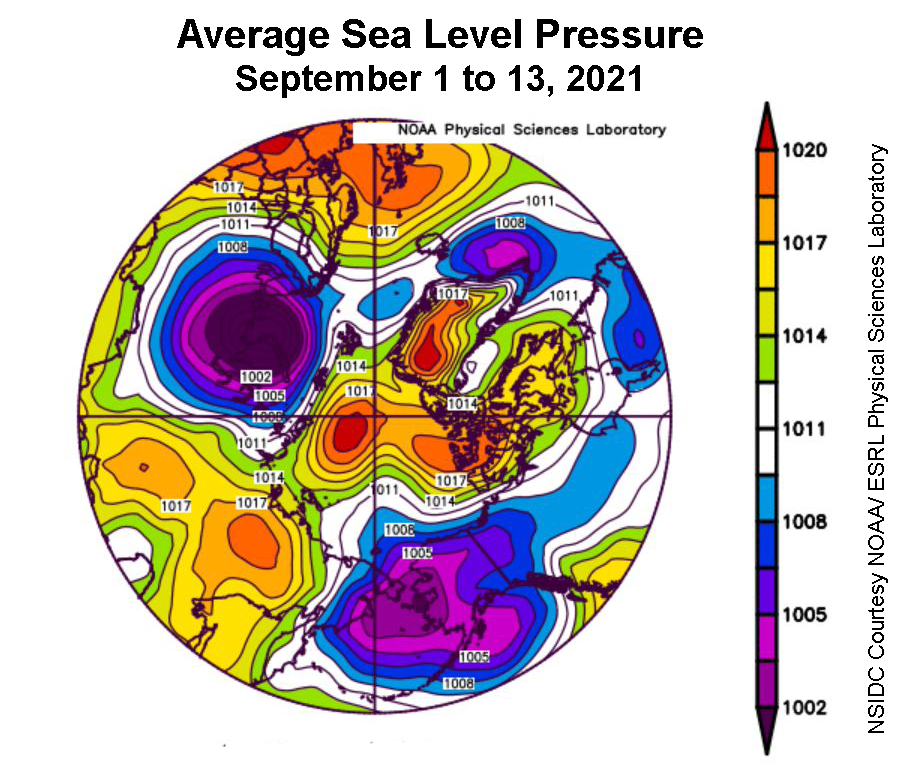
Figure 2b. This plot shows average sea level pressure in the Arctic in millibars from September 1 to 13, 2021. Yellows and reds indicate high air pressure; blues and purples indicate low pressure.
Credit: NSIDC courtesy NOAA Earth System Research Laboratory Physical Sciences Laboratory
High-resolution image
Air temperatures at the 925 hPa level (about 2,500 feet above the surface) as assessed over the first 13 days of September were near average over most of the Arctic Ocean. Temperatures from 2 to 4 degrees Celsius (4 to 7 degrees Fahrenheit) above average were the rule along the coasts of the Kara and Laptev Seas (Figure 2a). In sharp contrast to the persistent pattern of low pressure over the Arctic Ocean characterizing this summer, the first 13 days of September saw high average air pressure (Figure 2b).
Focus on the Northwest Passage
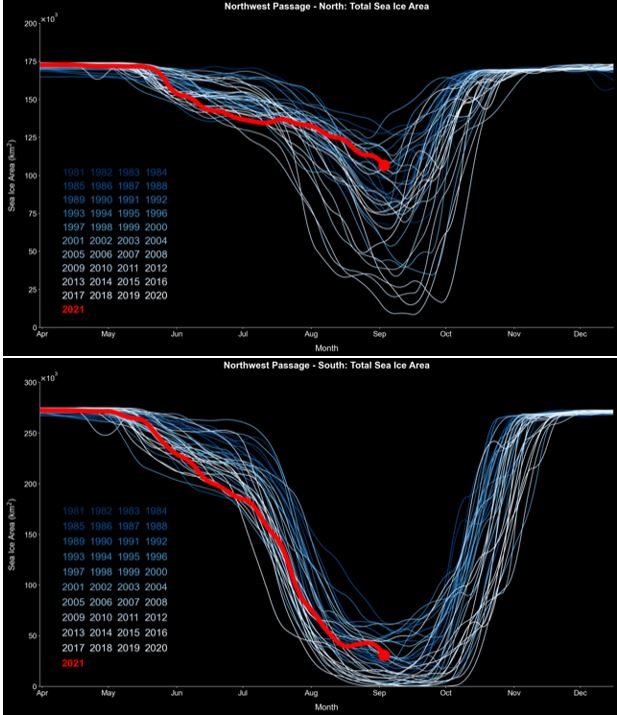
Figure 3. These graphs show the total sea ice area along each Northwest Passage route (y axis) by day (x axis) dating back to 1981. The top graph shows the northern route and the bottom graph shows the southern route.
Credit: Canadian Ice Service
High-resolution image
Data from the Canadian Ice Service compiled by colleague Steve Howell of Environment and Climate Change Canada allows for a closer look at sea ice conditions in the Northwest Passage. While there are multiple Northwest Passage routes, most attention is focused on the southern route, known as Amundsen’s route, entered from the Pacific side through Amundsen Gulf, and the northern route entered from the Pacific side via M’Clure Strait. This wide, deeper-water route is the one that might become a viable waterway for commercial shipping in the future. As of early to mid-September, the northern deep-water route is choked with ice and will not open this year; ice conditions are quite severe compared to the past couple of decades. By contrast, there is much less ice in the southern route, approximately 30,000 square kilometers (11,600 square miles). Most of this is located on Somerset and Prince of Wales Islands. On the other side of the Arctic, the Northern Sea Route is essentially open, though some areas of ice remain near Severnaya Zemlya.
Antarctic oddities
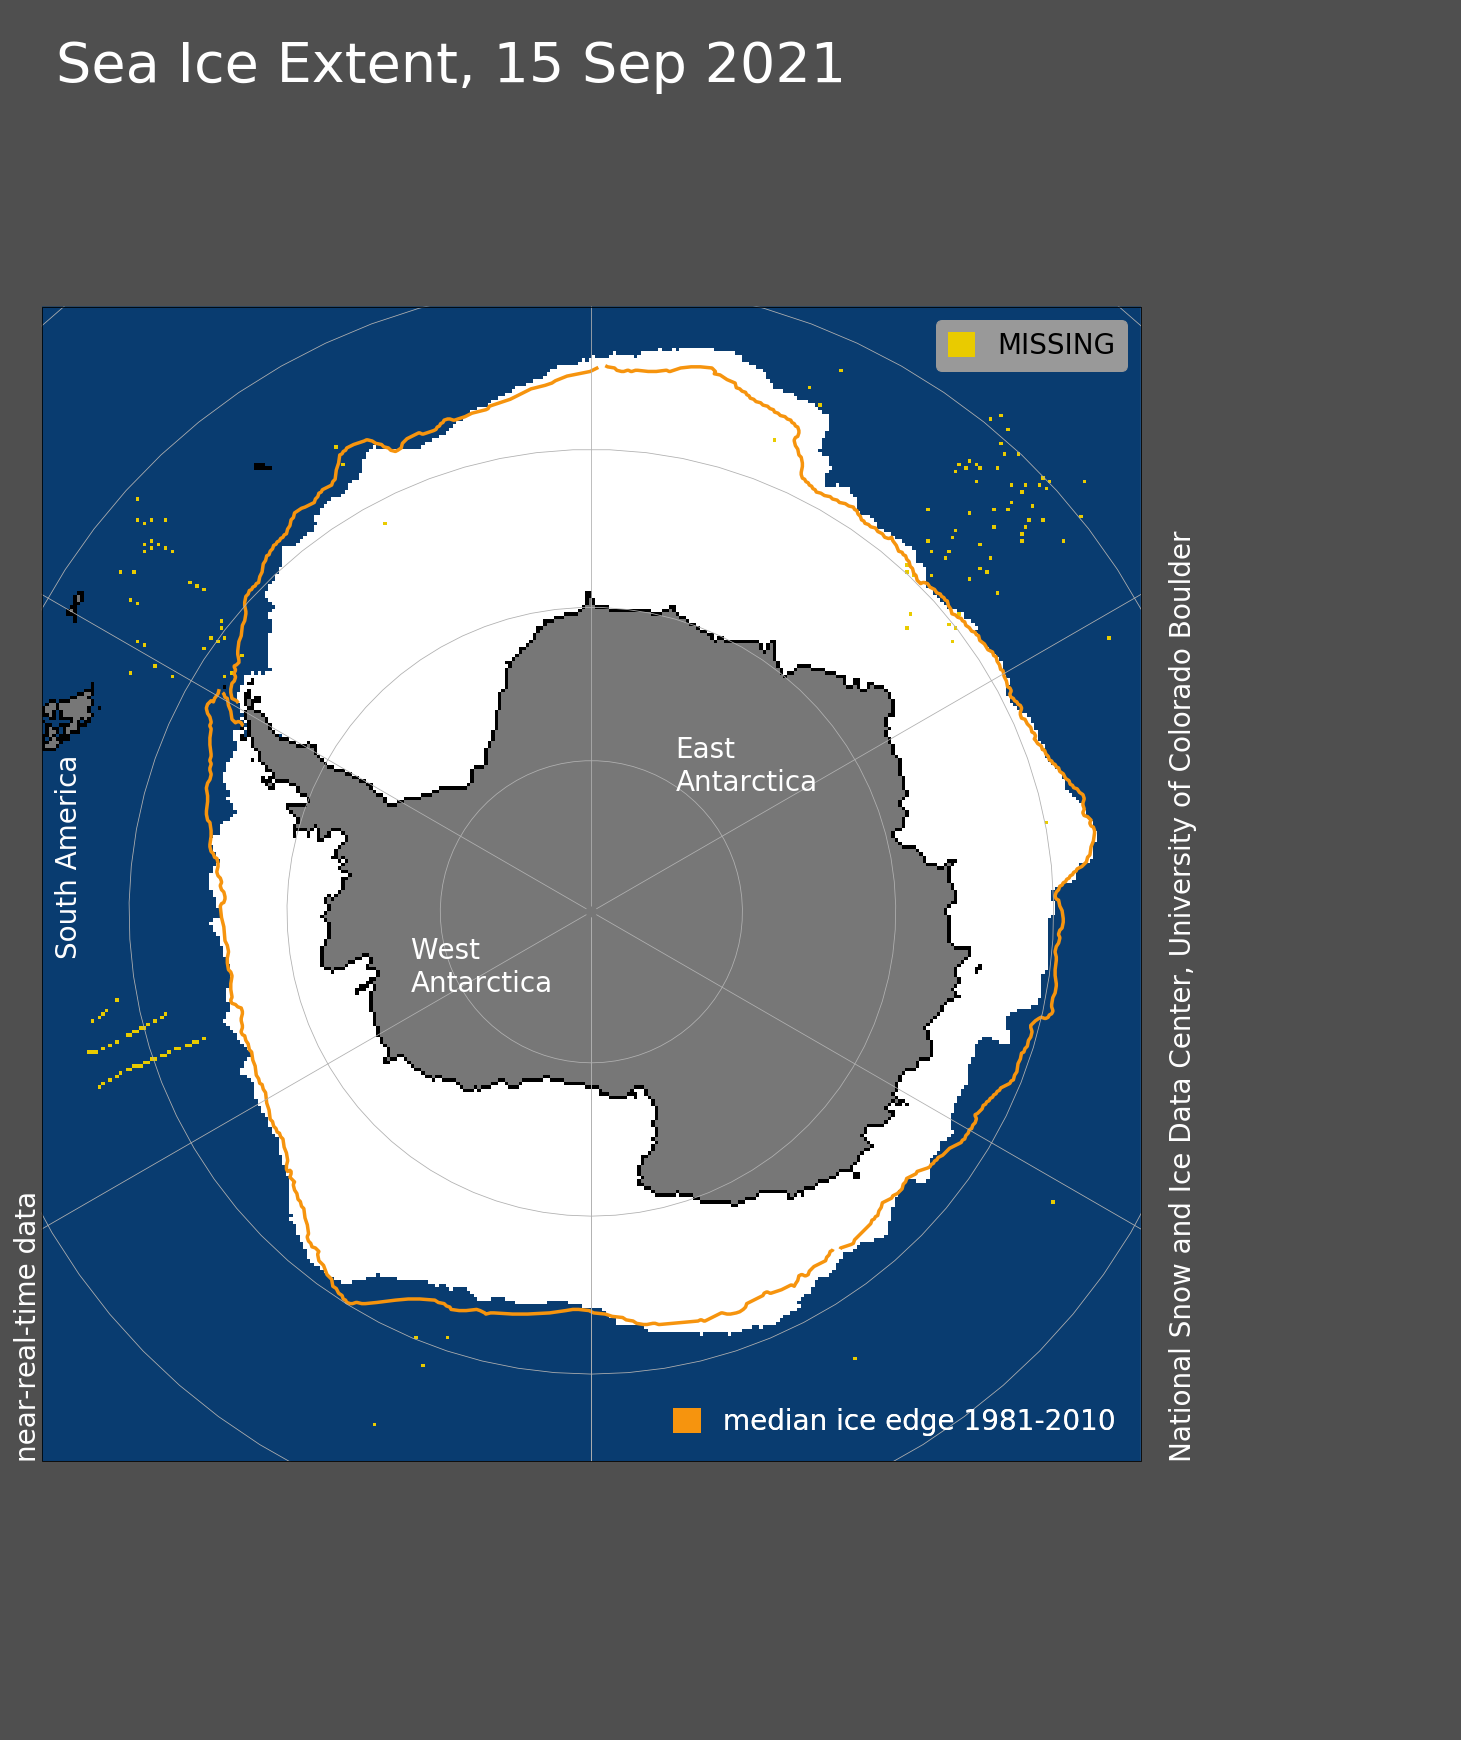
Figure 4. Antarctic sea ice extent for September 15, 2021 was 18.64 million square kilometers (7.20 million square miles). The orange line shows the 1981 to 2010 average extent for that day. Sea Ice Index data. About the data
Credit: National Snow and Ice Data Center
High-resolution image
Antarctic sea ice extent is approaching its seasonal maximum, which typically occurs in late September. A surge in sea ice growth or outward transport in late August in the northeastern Weddell Sea and the area north of Dronning Maud Land brought sea ice extent to the fifth-highest level for the last day of the month. Since then, losses in the areas around the tip of the Antarctic Peninsula and the northeastern Ross Sea have reduced the total ice extent, although at this time of year, ice extent can change rapidly up or down as storms play havoc with thin, low concentration ice in the extended ice edge regions. As of this post, Antarctic ice extent remains well above the long-term average.

