By early January 2022, Arctic sea ice extent, while well below average, was within the lowest decile of recorded extents of the 1981 to 2010 reference period. Sea ice now completely covers Hudson Bay; the only area with substantially below average extent is in southern Baffin Bay and north of Labrador.
Overview of conditions
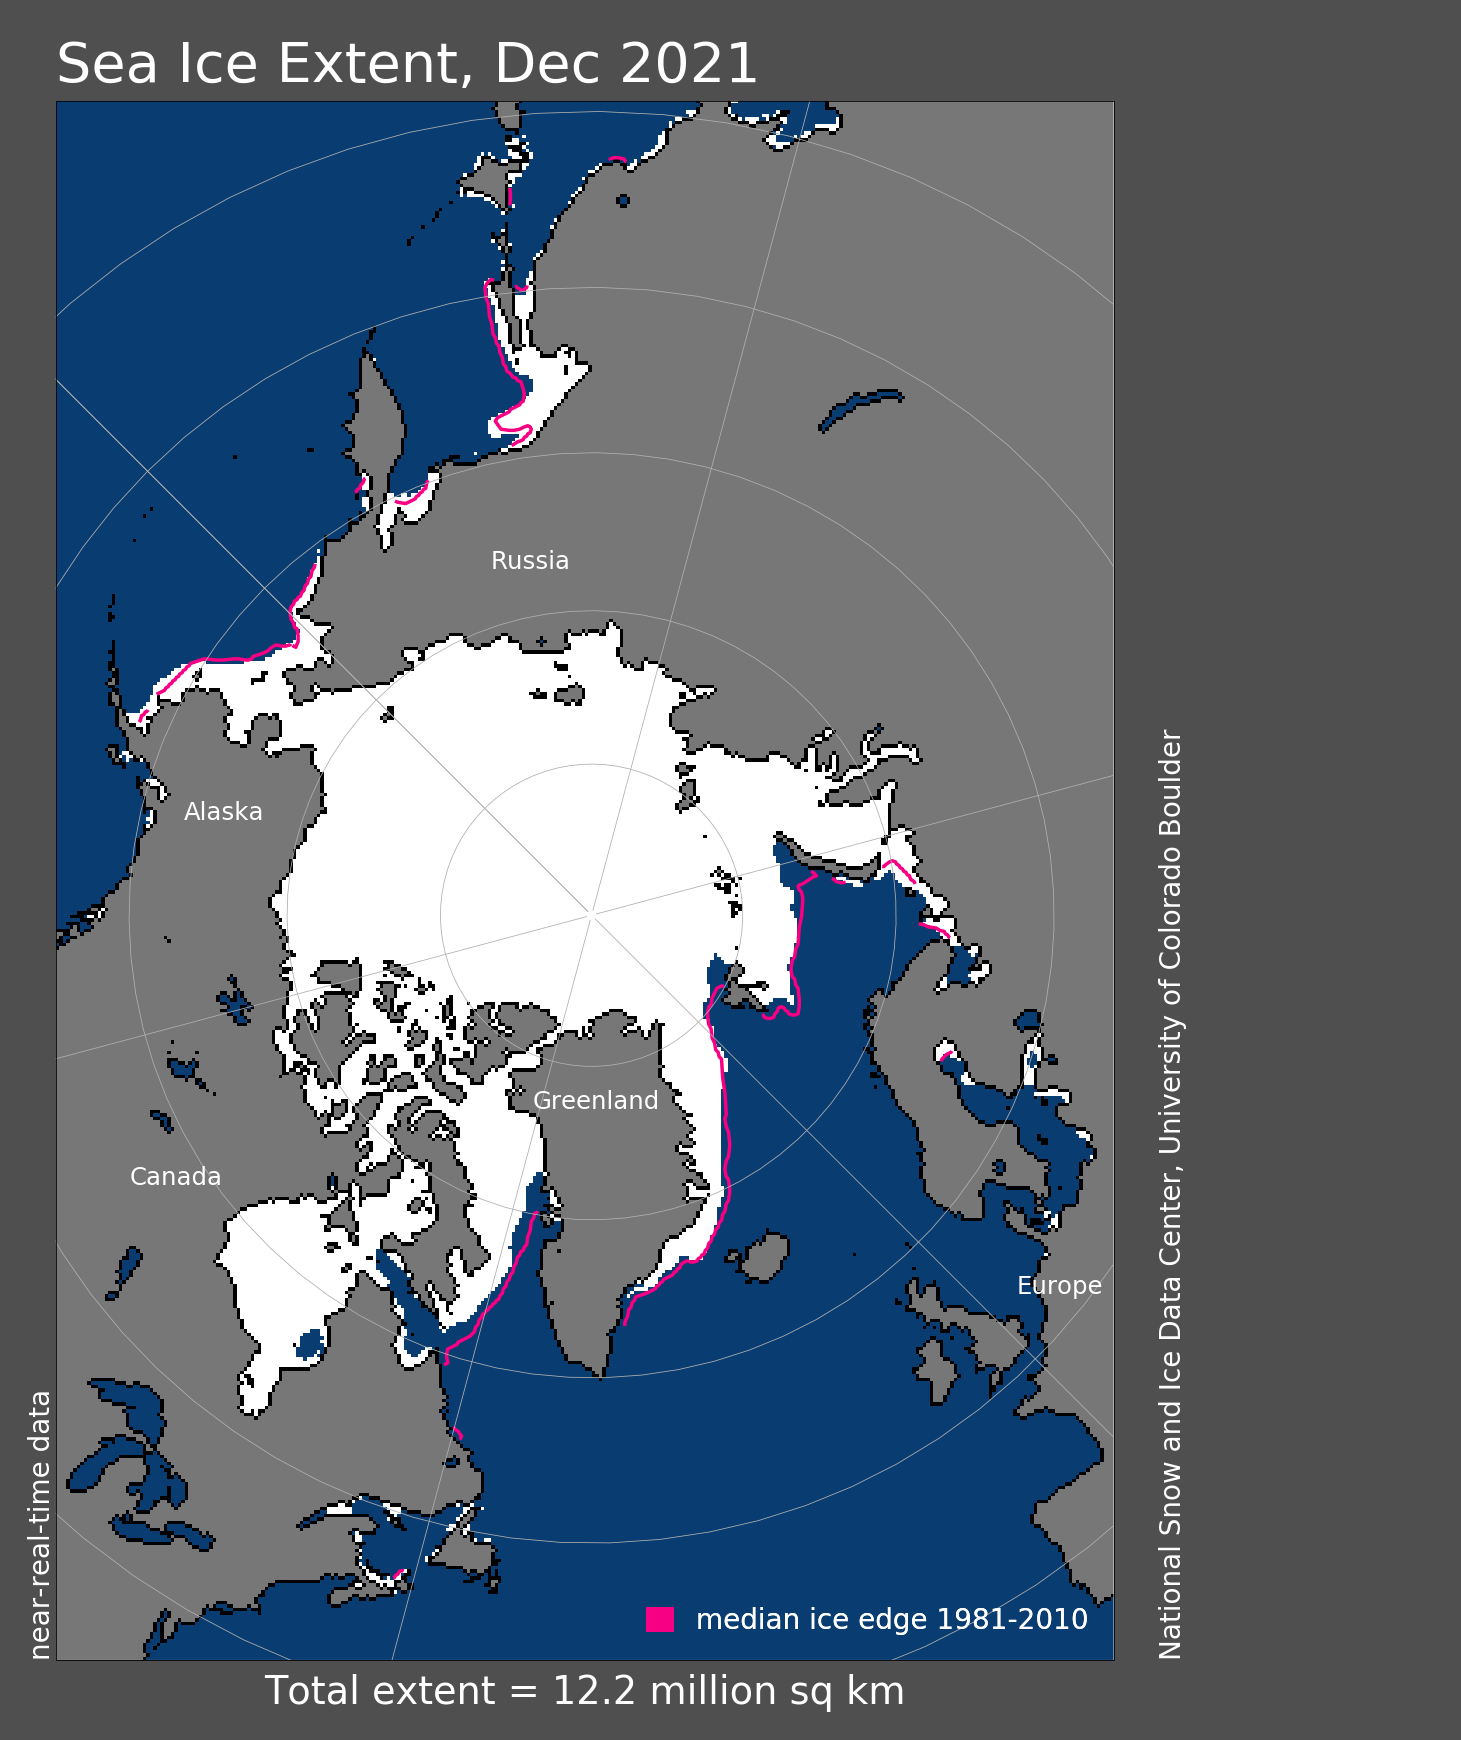
Figure 1. Arctic sea ice extent for December 2021 was 12.19 million square kilometers (4.71 million square miles). The magenta line shows the 1981 to 2010 average extent for that month. Sea Ice Index data. About the data
Credit: National Snow and Ice Data Center
High-resolution image
Average Arctic sea ice extent for December 2021 was 12.19 million square kilometers (4.71 million square miles), which ranked thirteenth lowest in the satellite record. The 2021 extent was 650,000 square kilometers (251,000 square miles) below the 1981 to 2010 average. As of early January 2022, sea ice completely covers Hudson Bay. The only area with extent remarkably below normal is southern Baffin Bay and off the coast of Labrador, where the December sea ice extent ranked fourth lowest.
Conditions in context
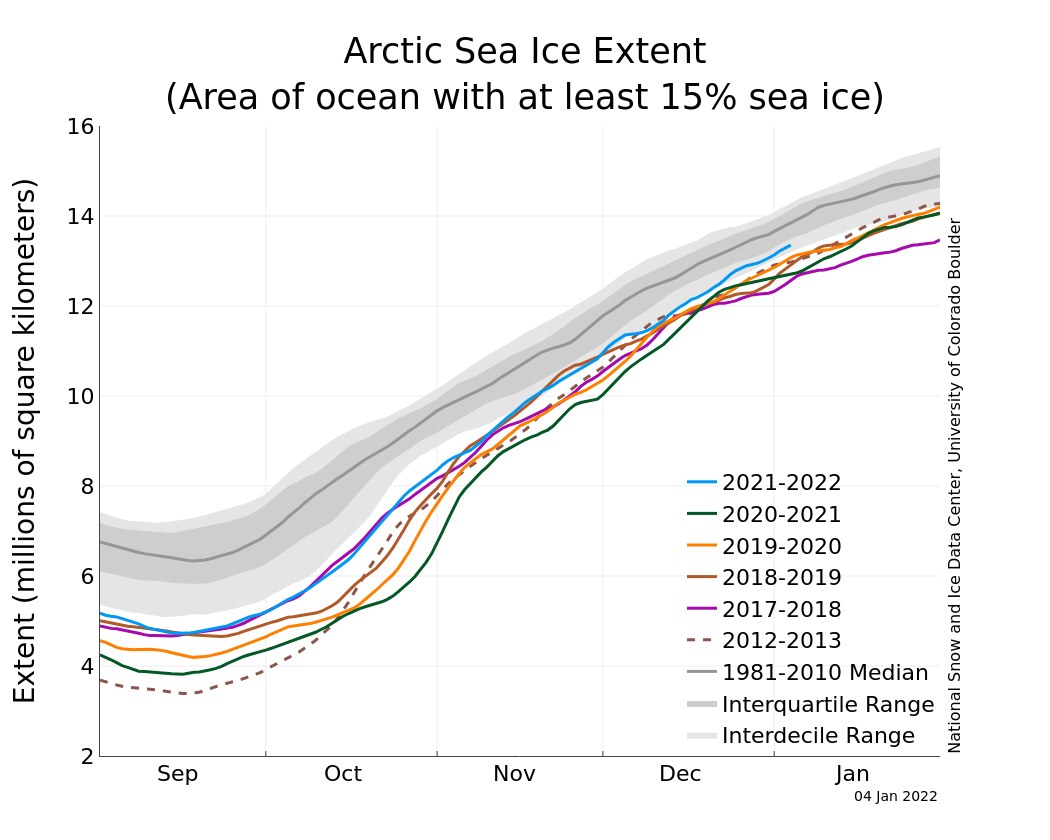
Figure 2a. The graph above shows Arctic sea ice extent as of January 4, 2022, along with daily ice extent data for four previous years and the record low year. 2021 to 2022 is shown in blue, 2020 to 2021 in green, 2019 to 2020 in orange, 2018 to 2019 in brown, 2017 to 2018 in magenta, and 2012 to 2013 in dashed brown. The 1981 to 2010 median is in dark gray. The gray areas around the median line show the interquartile and interdecile ranges of the data. Sea Ice Index data.
Credit: National Snow and Ice Data Center
High-resolution image
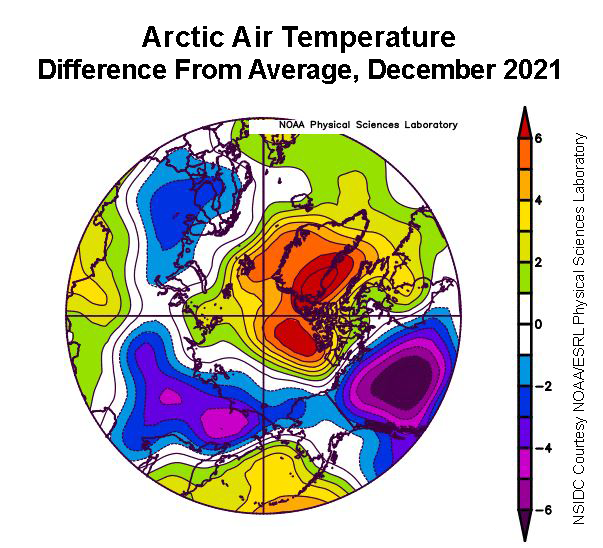
Figure 2b. This plot shows the departure from average air temperature in the Arctic at the 925 hPa level, in degrees Celsius, for December 2021. Yellows and reds indicate higher than average temperatures; blues and purples indicate lower than average temperatures.
Credit: NSIDC courtesy NOAA Earth System Research Laboratory Physical Sciences Laboratory
High-resolution image
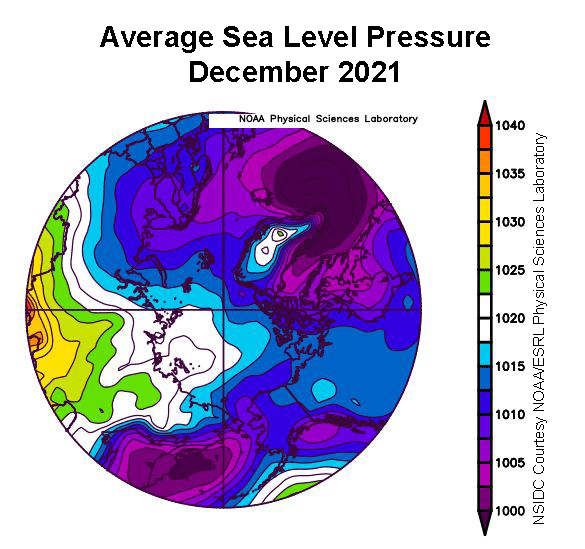
Figure 2c. This plot shows average sea level pressure in the Arctic in millibars for December 2021. Yellows and reds indicate high air pressure; blues and purples indicate low pressure.
Credit: NSIDC courtesy NOAA Earth System Research Laboratory Physical Sciences Laboratory
High-resolution image
The air temperature pattern averaged for December 2021 at the 925 millibar level (about 2,500 feet above the surface) was characterized by above average temperatures. Temperatures were up to 6 degrees Celsius (11 degrees Fahrenheit) above average over Greenland, north of the Canadian Arctic Archipelago, and the East Greenland Sea. Three areas of below average temperatures were found over western and eastern Eurasia and northwestern Canada (Figure 2b). The corresponding sea level pressure pattern for December 2021 featured fairly low pressures (less than 1,015 millibars) encompassing essentially all of the Arctic except for the Laptev Sea region (Figure 2c). These pressures were nevertheless not substantially unusual compared to average—at most 6 to 7 millibars below average. The notable exception is south of the Aleutian Islands, where the sea level pressure was up to 24 millibars above average.
December 2021 compared to previous years
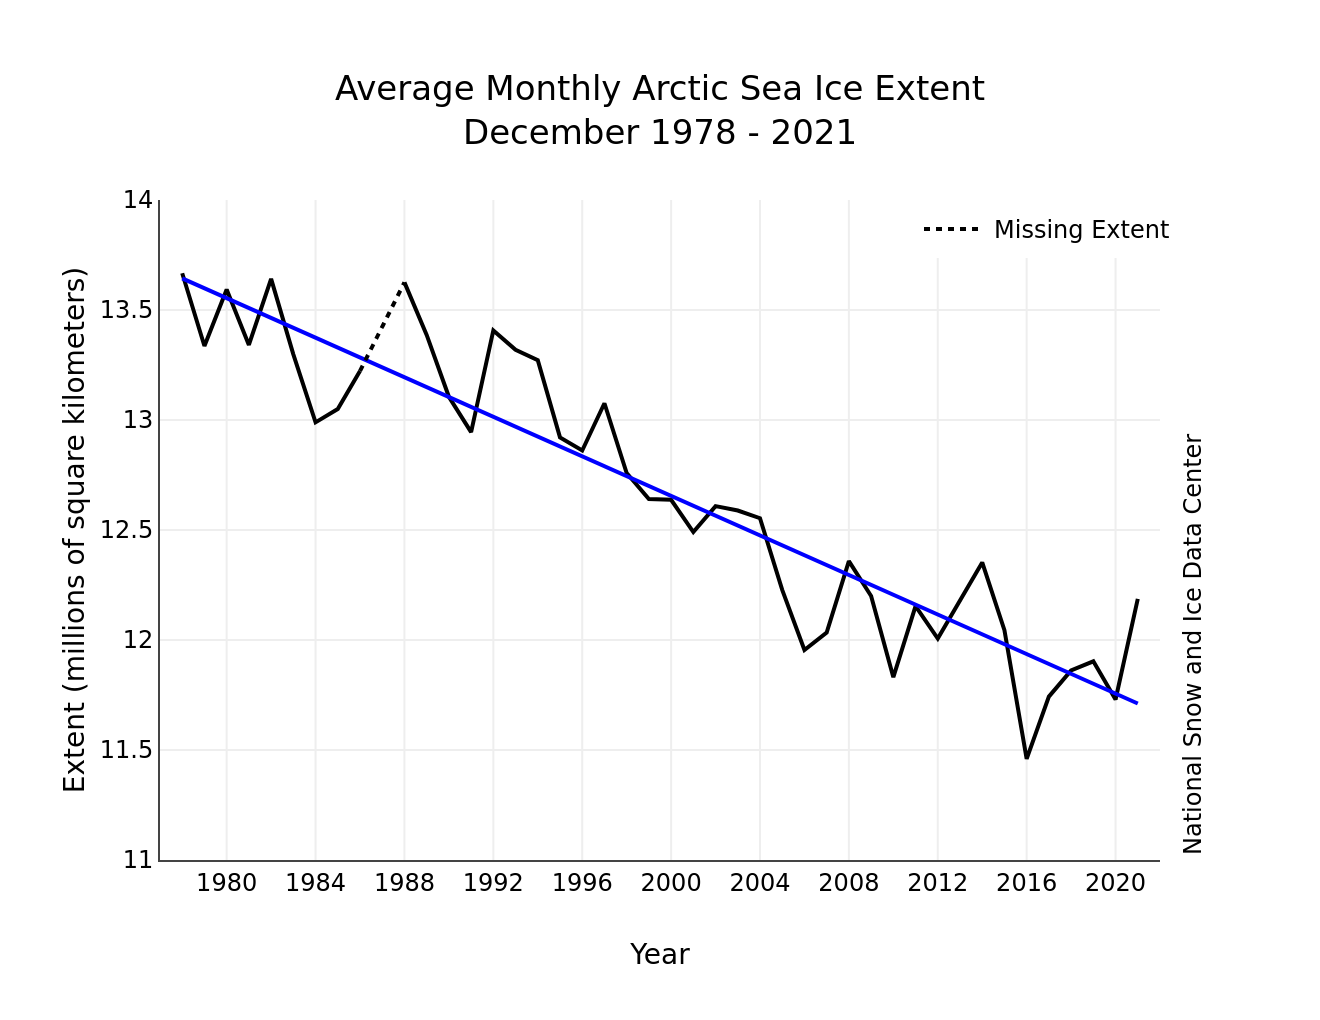
Figure 3. Monthly December ice extent for 1979 to 2021 shows a decline of 3.5 percent per decade.
Credit: National Snow and Ice Data Center
High-resolution image
The downward linear trend in December sea ice extent over the 43-year satellite record is 45,000 square kilometers (17,400 square miles) per year, or 3.5 percent per decade relative to the 1981 to 2010 average. Based on the linear trend, since 1979, December has seen a loss of 1.88 million square kilometers (726,000 square miles). This is equivalent to about three times the size of Texas.
Hudson Bay ices over
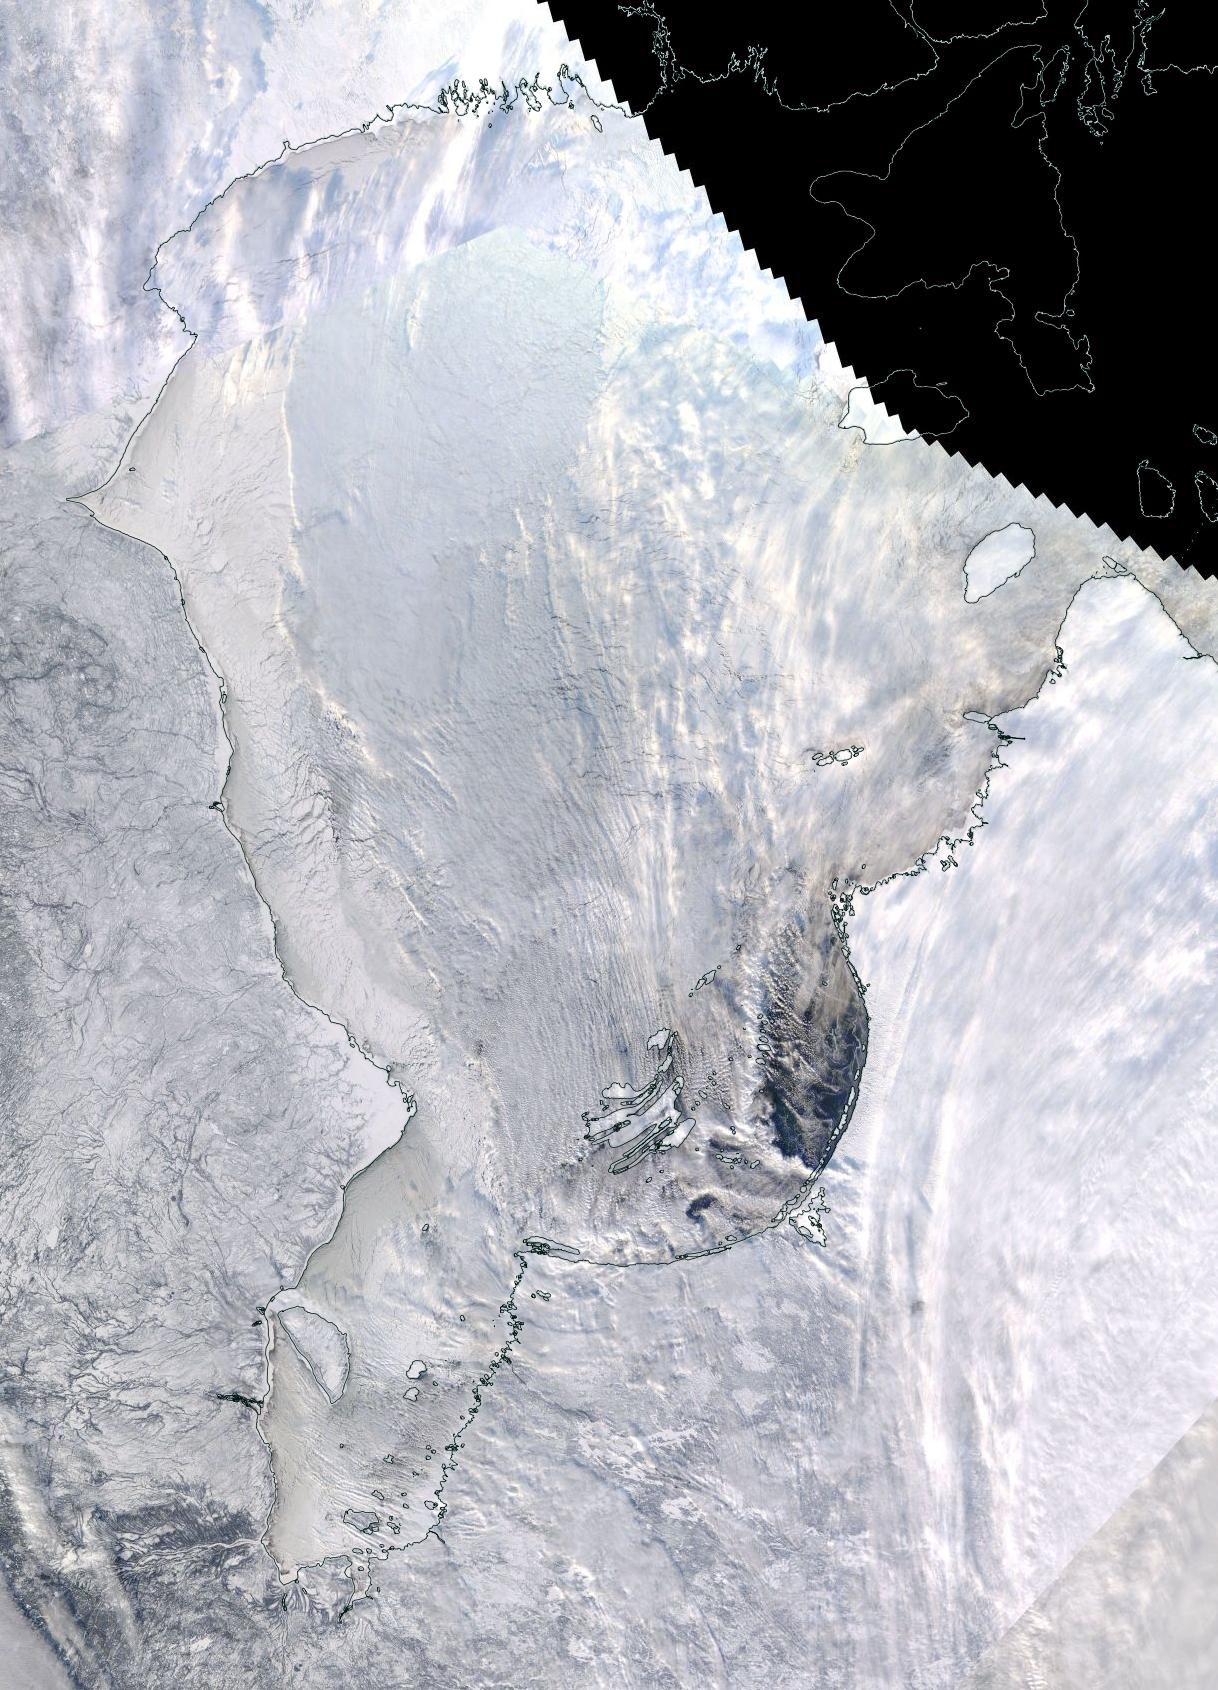
Figure 4. This NASA Worldview image shows the last part of Hudson Bay freezing up along the southeast coast as of December 23, 2021. After a late freeze up, Hudson Bay is completely ice covered as of early January 2022.
Credit: NASA
High-resolution image
In our previous post, we noted that by the end of November, the northern half of Hudson Bay is usually completely iced over. As of the end of November 2021, only the far north was frozen over; the rest of the bay was ice free except for a narrow band of ice along the western coastline. However, as lower temperatures kicked in and the upper ocean lost the heat that it had gained in summer, the entire bay subsequently froze over. The ice cover is now complete.
Antarctic notes
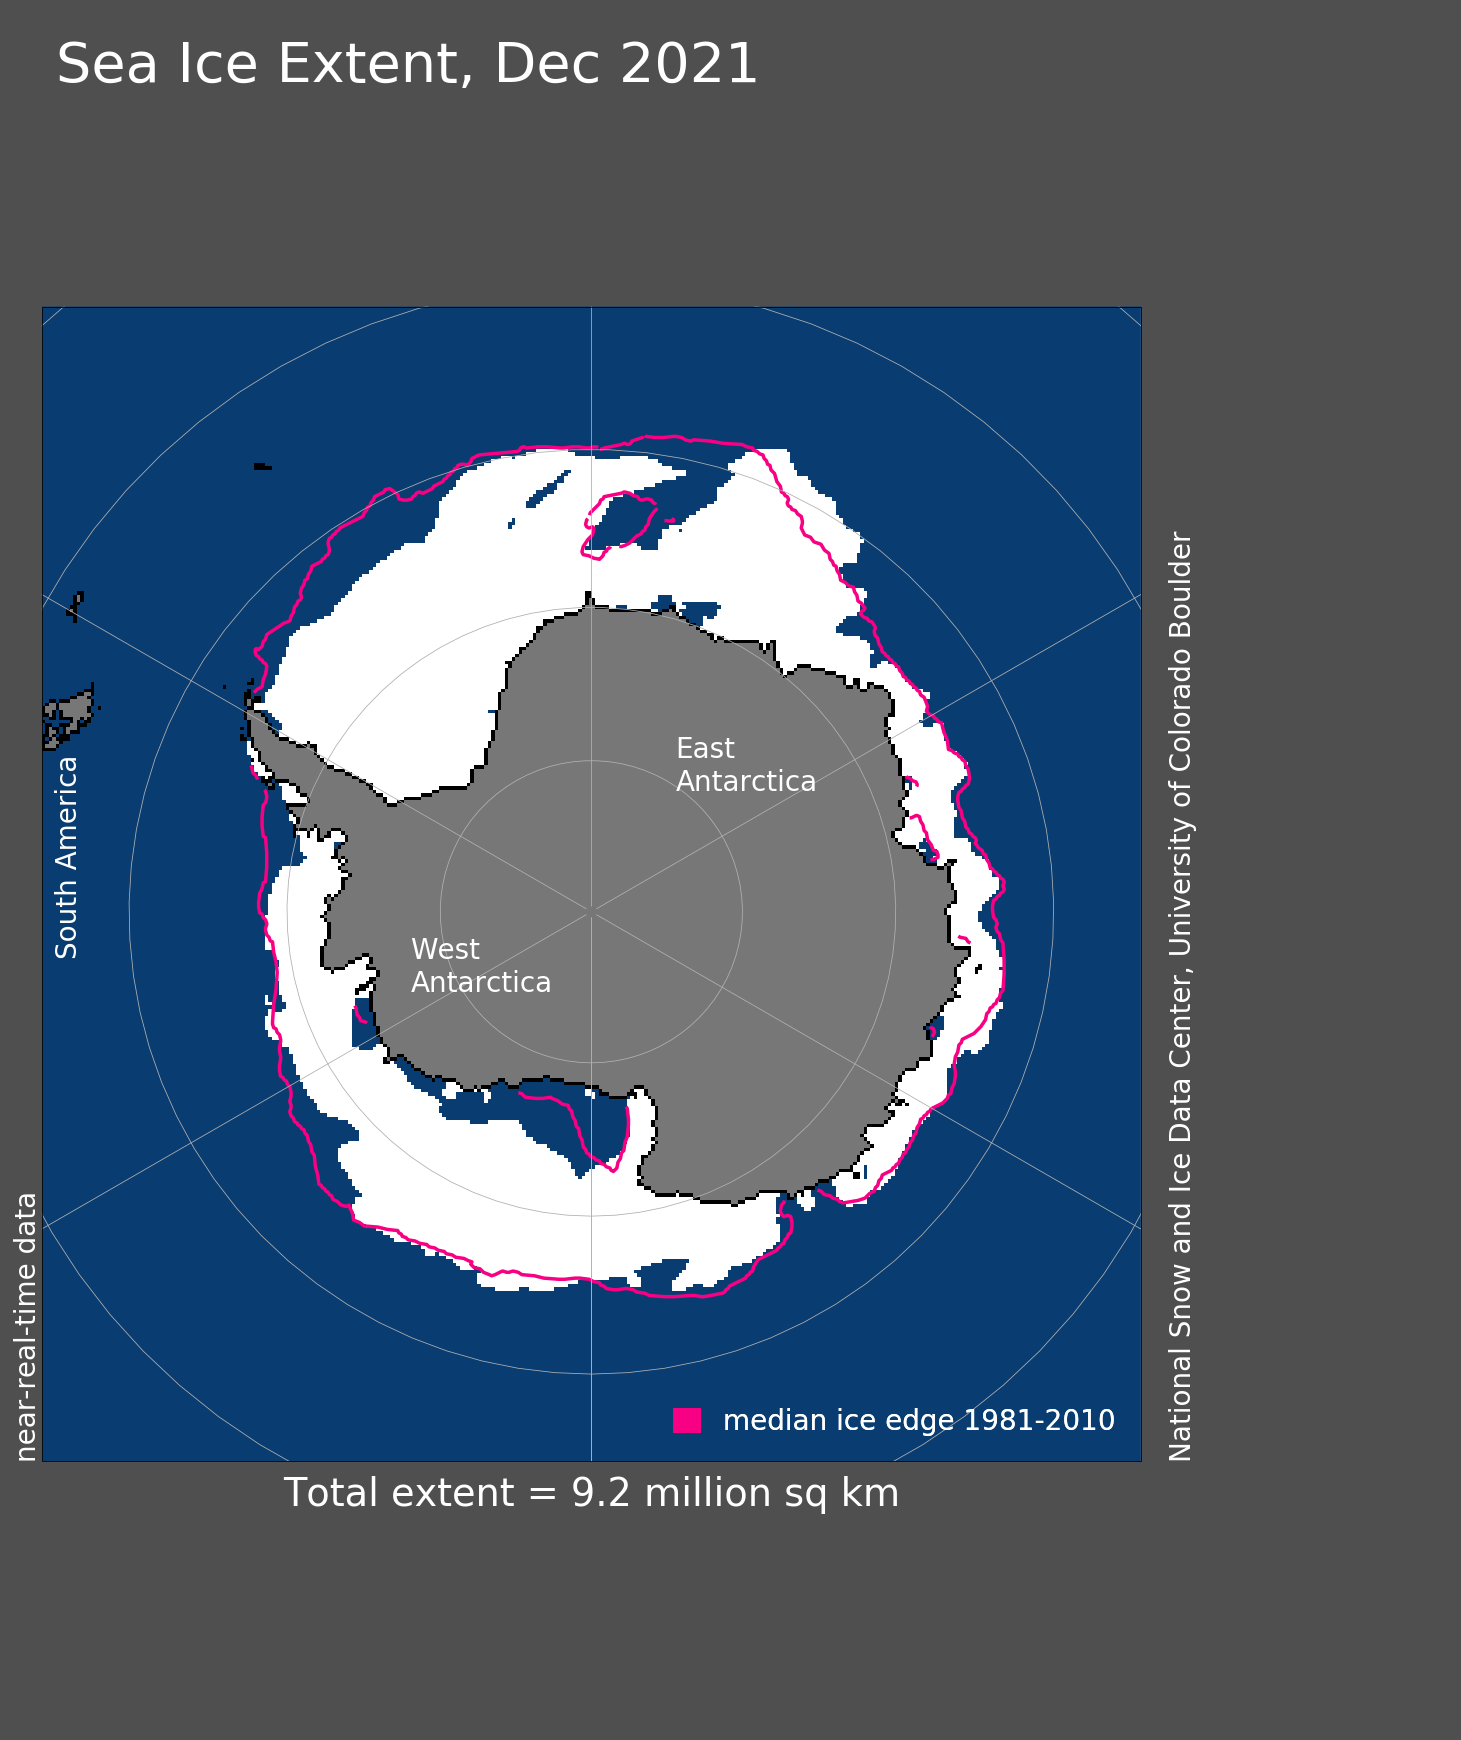
Figure 5. Antarctic sea ice extent for December 2021 was 9.2 million square kilometers (3.55 million square miles). The magenta line shows the 1981 to 2010 average extent for that month. Sea Ice Index data. About the data
Credit: National Snow and Ice Data Center
High-resolution image
Antarctic sea ice extent for December 2021 was low overall, tracking at similar extents seen in 2017. Regionally, extent was particularly low in the Weddell Sea and southern Ross Sea regions. Several large polynyas formed in the eastern Weddell Sea; the Maud Rise Polynya opened in late November and then spread east to northeast. This is unusual; normally, the polynya extends south and west of its initiation point. The Southern Annular Mode (SAM) was in a strong positive phase through the first half of the month, indicating strong westerly winds and a strong low-pressure area in the Amundsen Sea. Sea ice conditions are not yet favorable for two planned cruises near Thwaites Glacier, one by the US Antarctic research program (RV Nathaniel B. Palmer) and the other by the South Korean (RV Araon). Ships are due to arrive in late January.
Killer whales in the Arctic
Bowhead whales have played an integral role in the cultural and subsistence life of Inuit communities for millennia. New research at the University of Washington analyzing acoustic data has found that the loss of sea ice has allowed killer whales, also known as Orcas, to venture into waters that were once inaccessible to them. The expanding range of killer whales, a top predator, has potential ramification for the Arctic food web and especially bowhead whales. Indigenous Arctic communities have noted an increased number of carcasses of bowhead whales in the Chukchi and Beaufort seas that were preyed upon by Orcas. Normally, bowheads can avoid predation by retreating into protective areas of heavy sea ice that the smaller Orcas cannot break through to breathe. If the bowheads must spend more time in thick ice, this can be a problem because feeding opportunities are more limited. Calves that cannot break through the ice may also drown.

