November’s rate of sea ice growth in the Arctic was near average. Several of the peripheral seas have open water areas late into the autumn season. Warm air temperatures persist in the northern North Atlantic and northwestern Europe. In Antarctica, sea ice extent is low, and persistent low air pressure in the Amundsen Sea has created a somewhat unusual sea ice distribution.
Overview of conditions
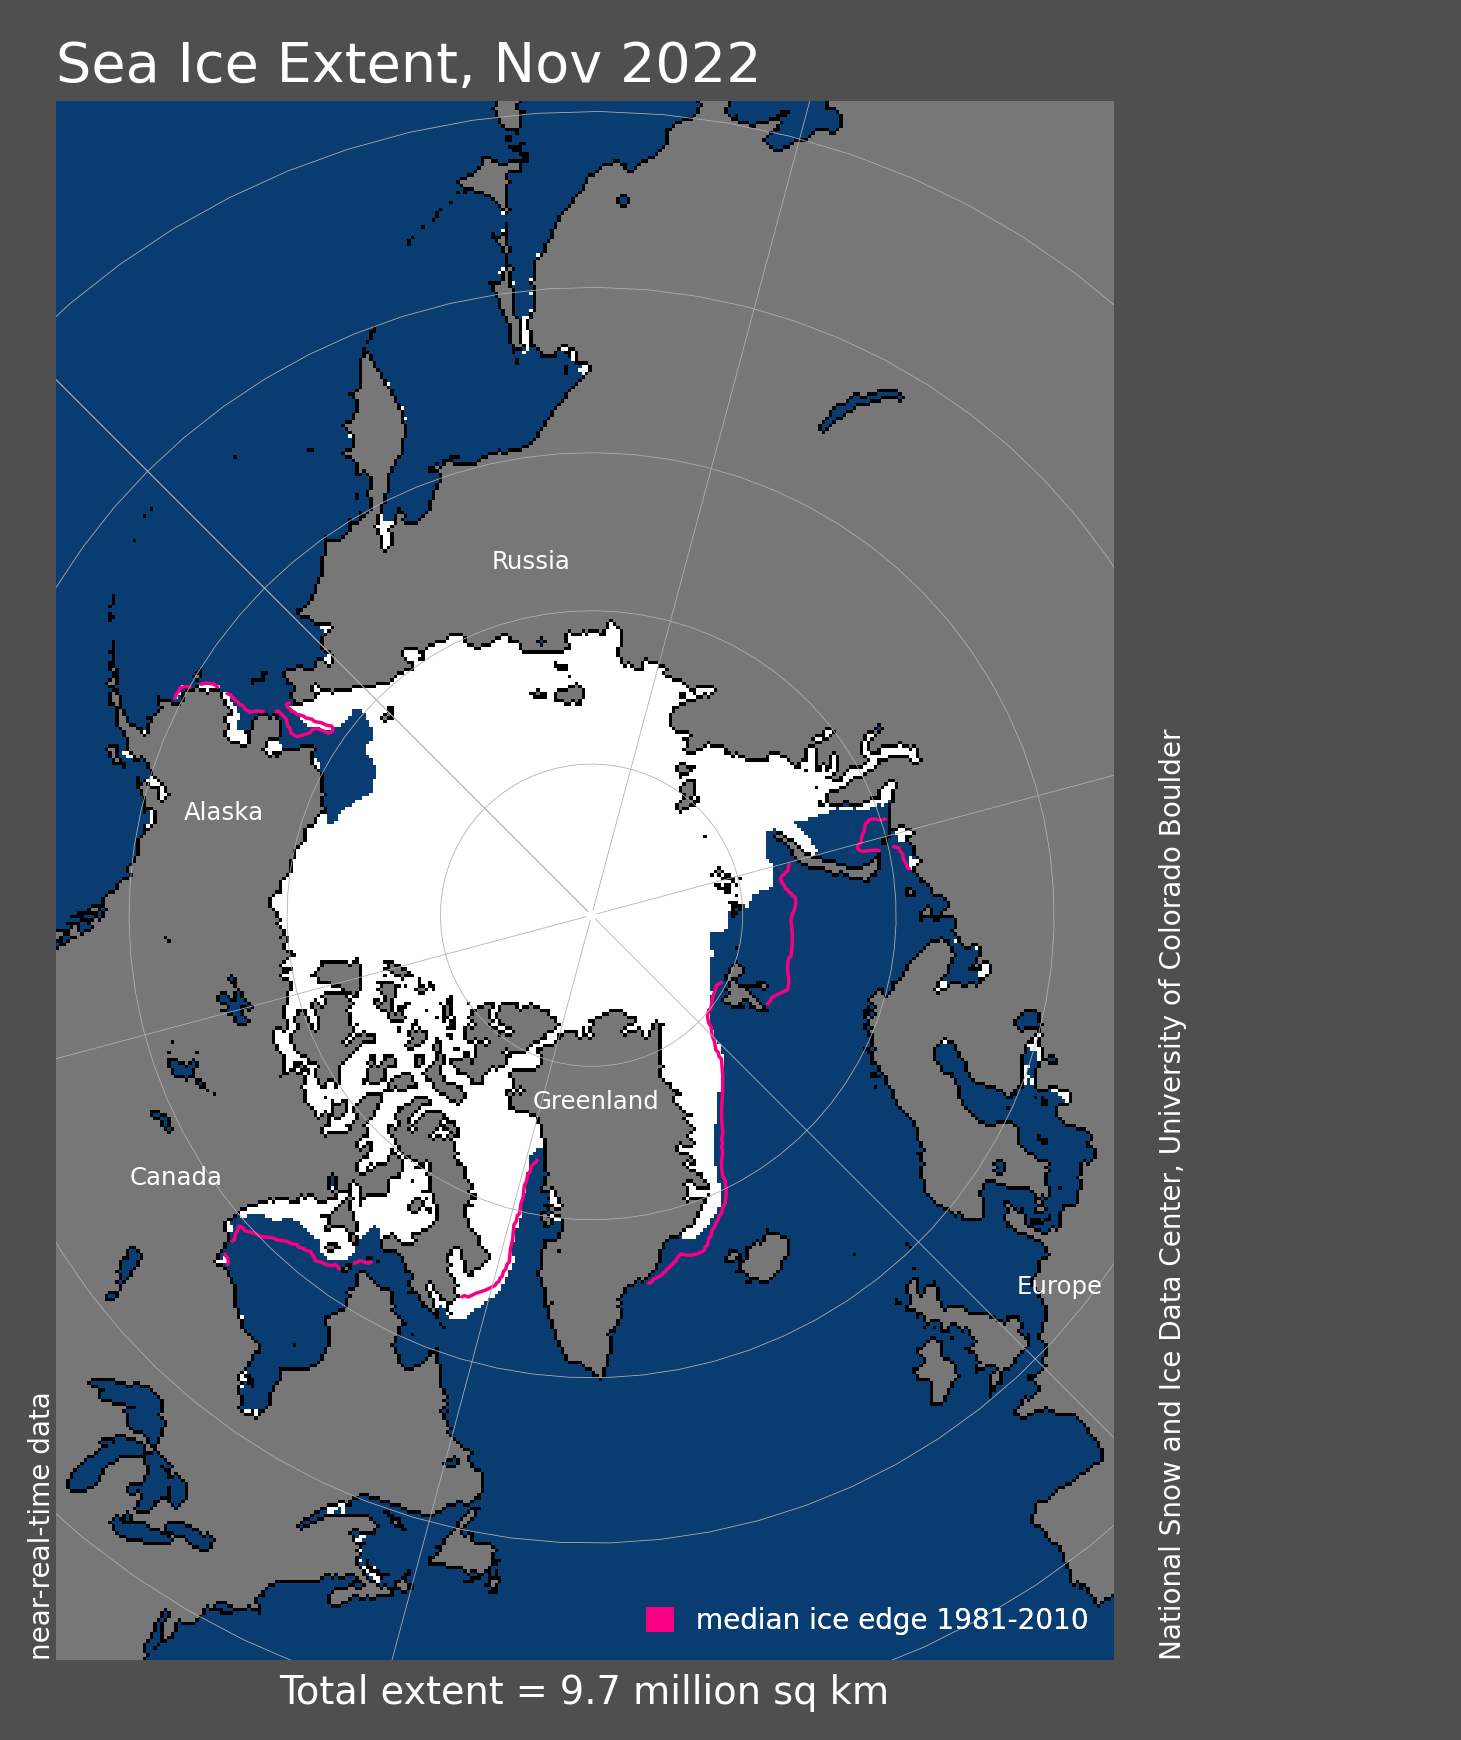
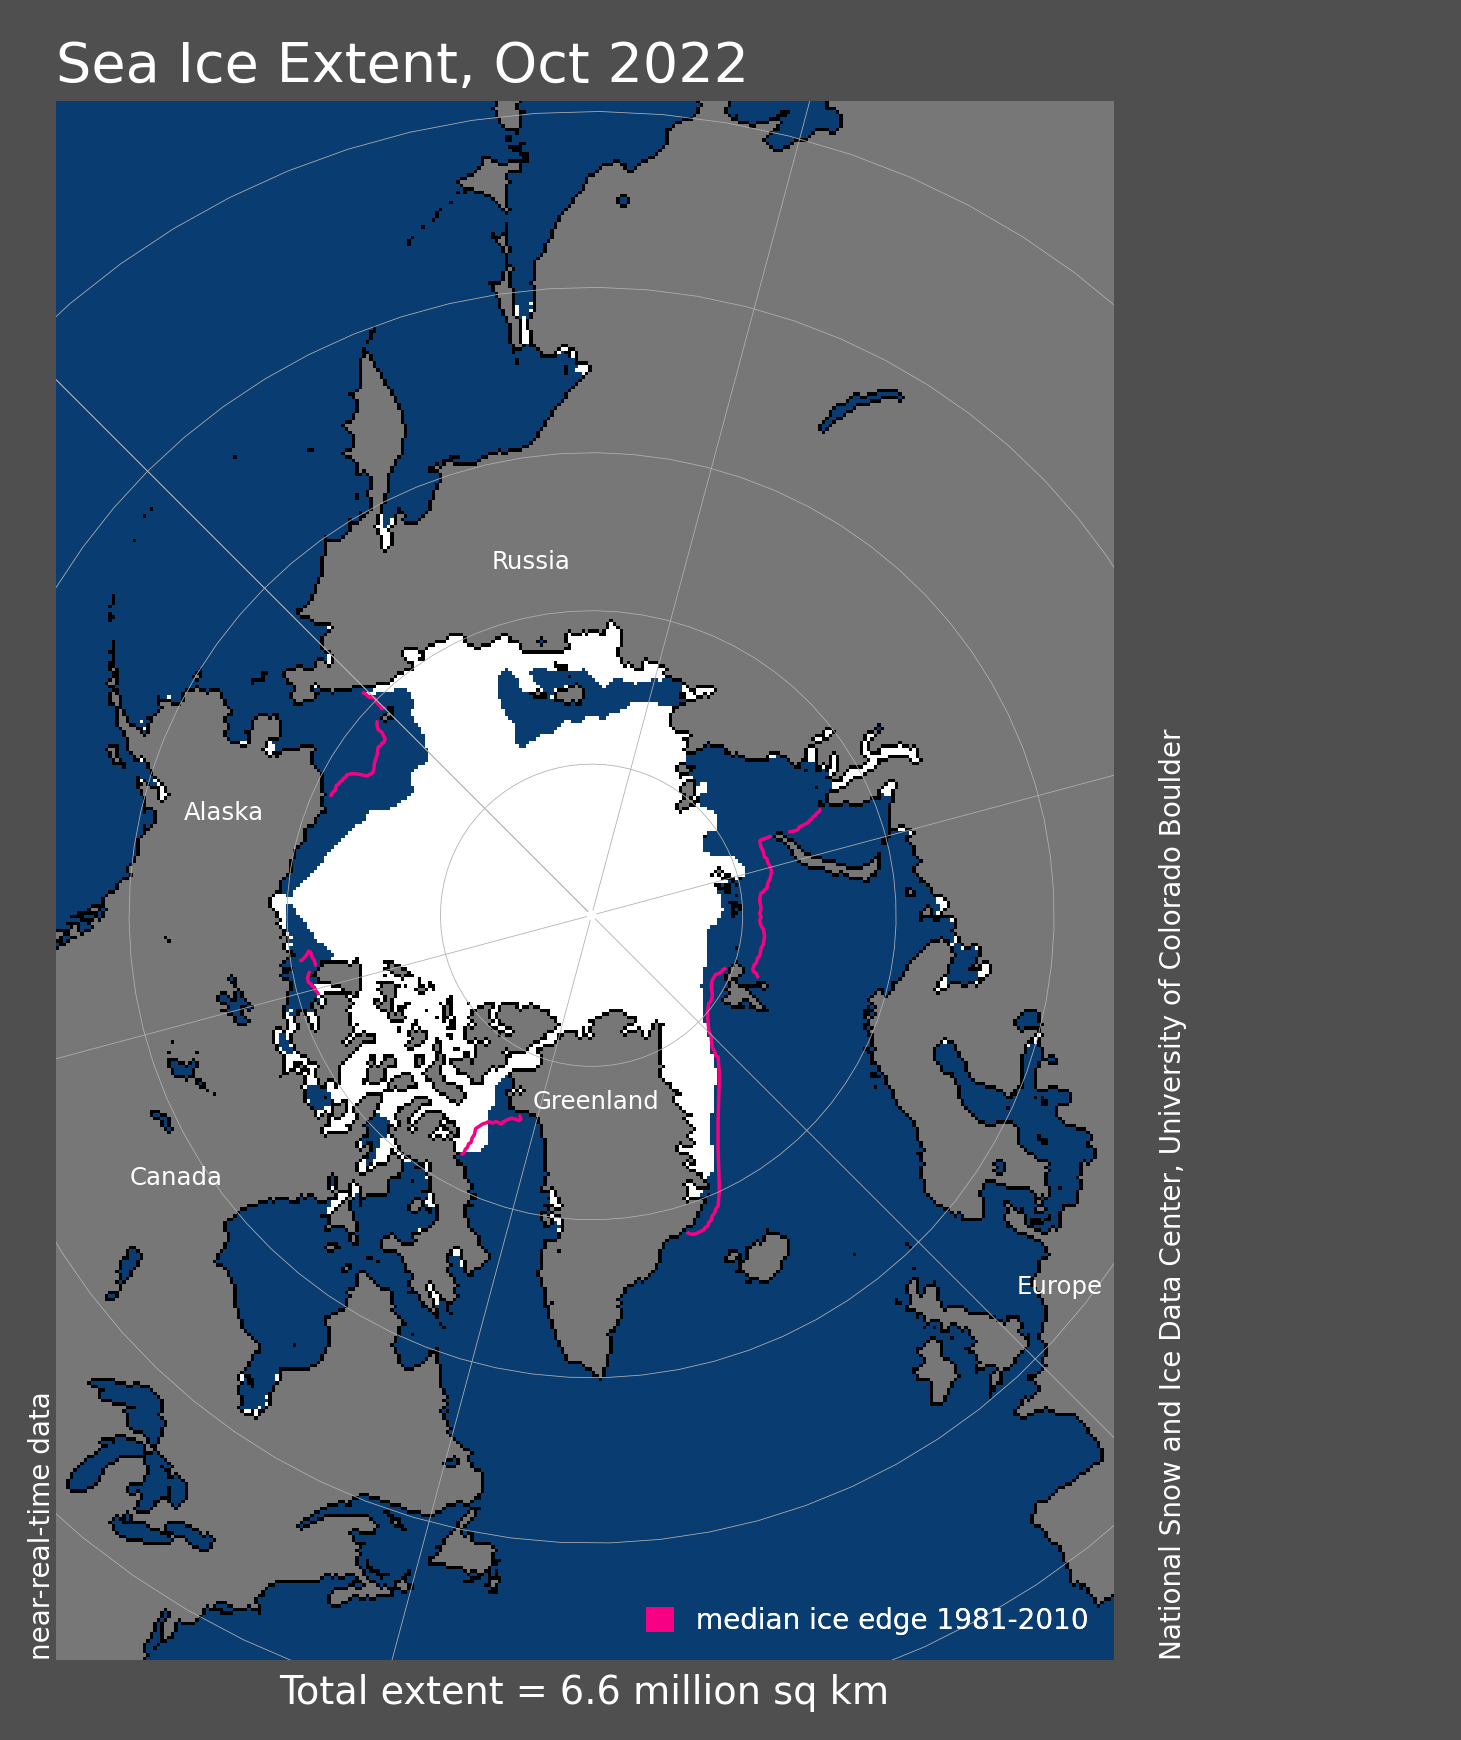
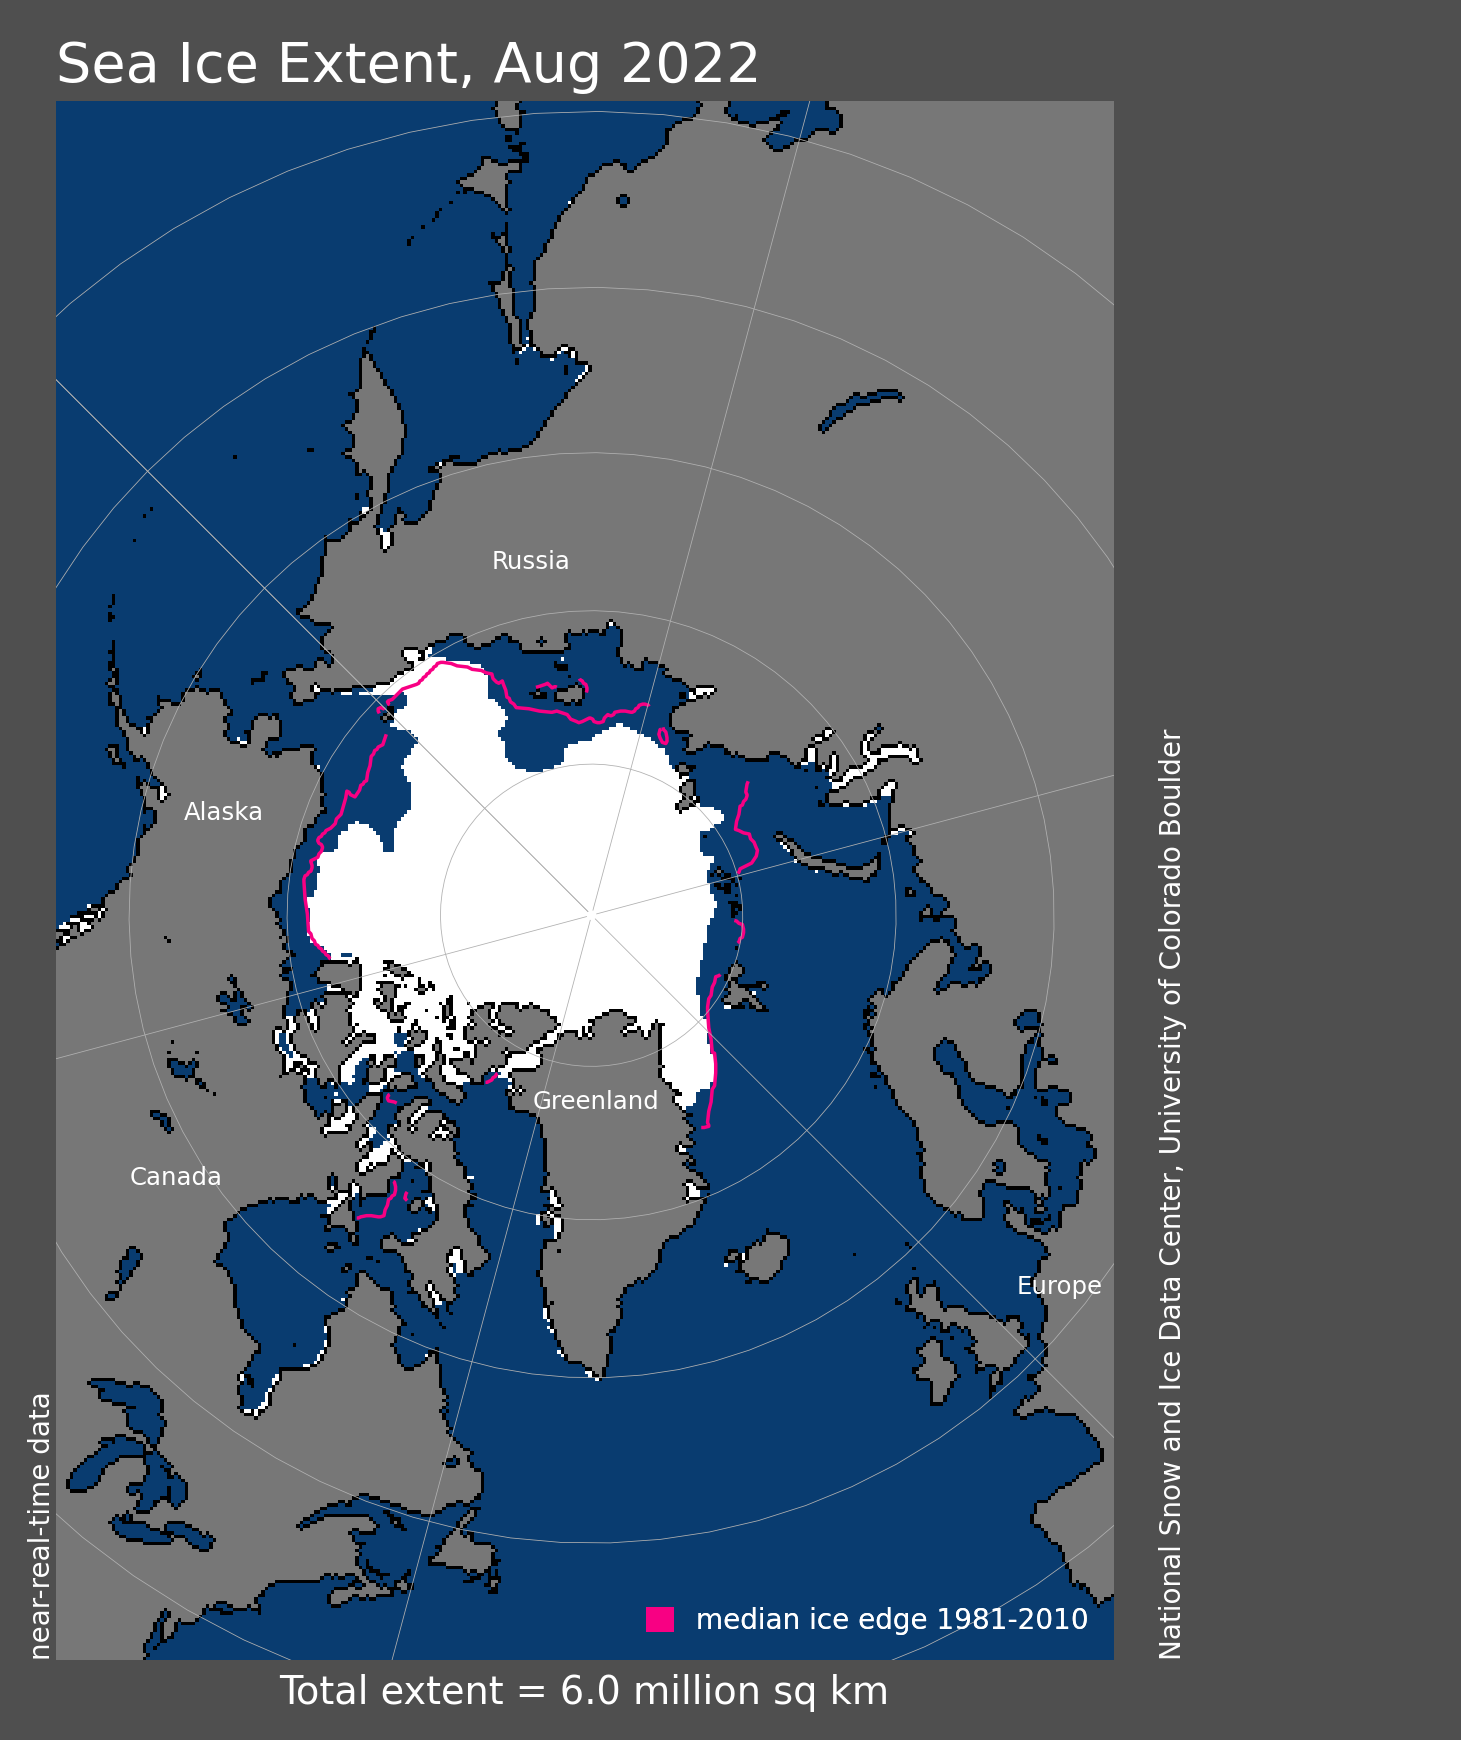
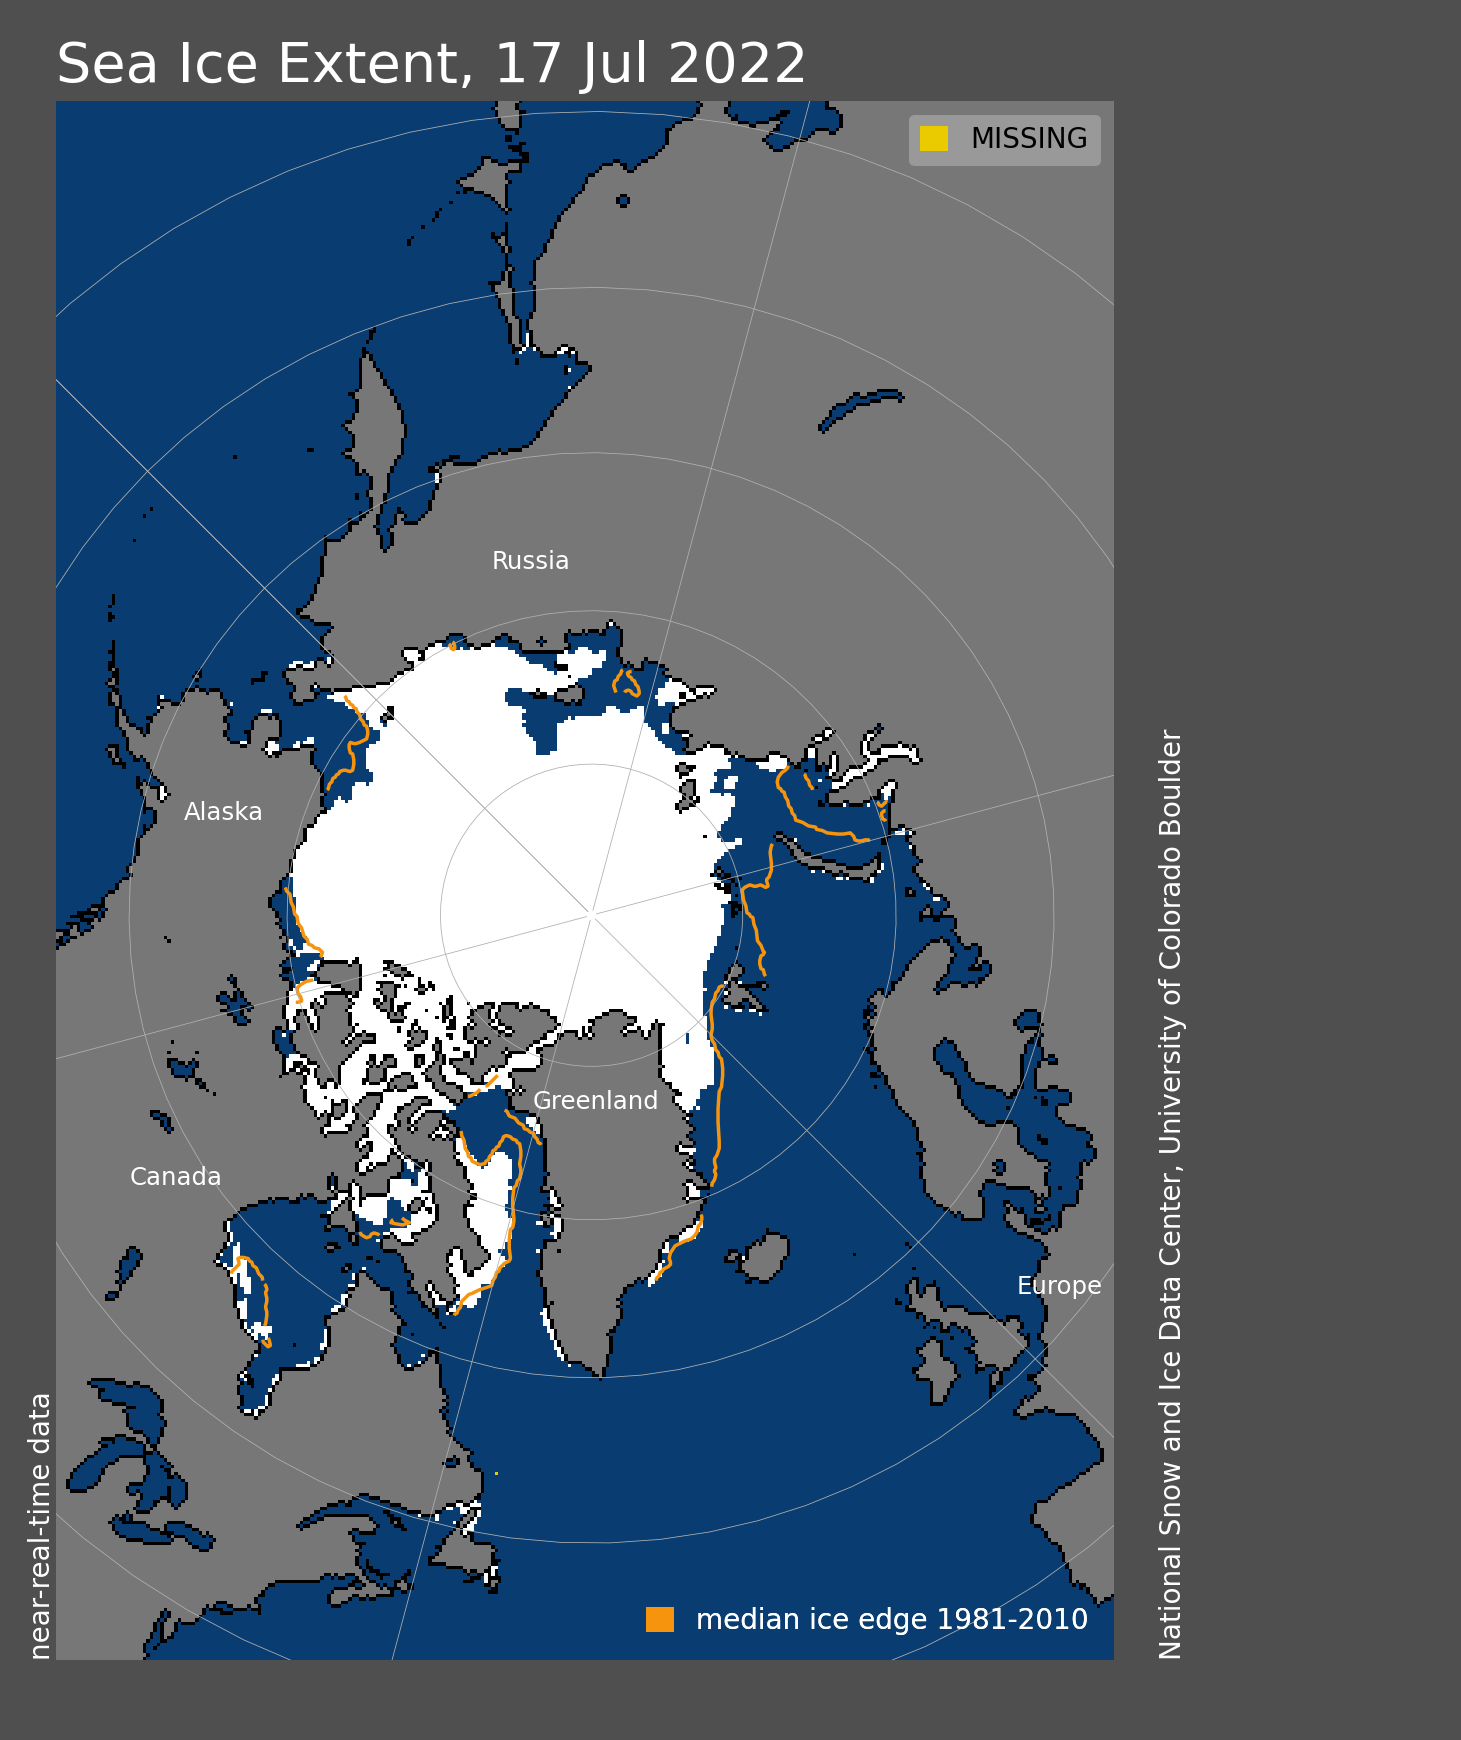
Figure 1. Arctic sea ice extent for November 2022 was 9.71 million square kilometers (3.75 million square miles). The magenta line shows the 1981 to 2010 average extent for that month. Sea Ice Index data. About the data
Credit: National Snow and Ice Data Center
High-resolution image
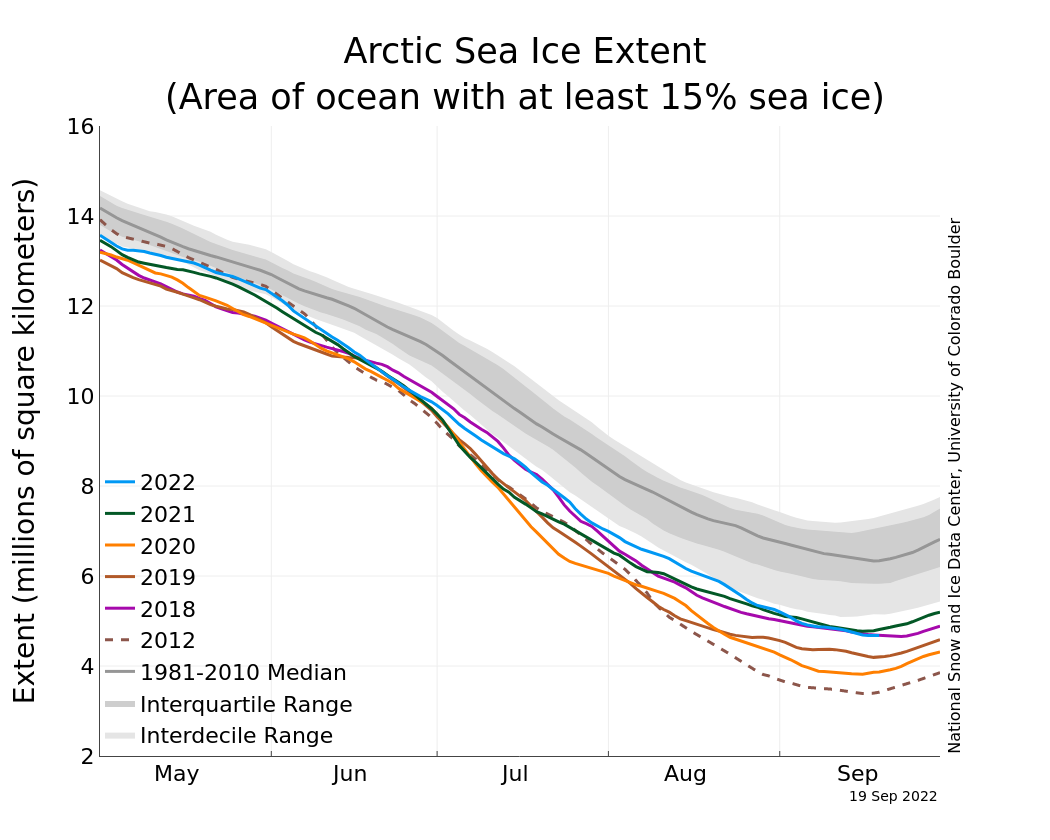
The November 2022 average Arctic sea ice extent was 9.71 million square kilometers (3.75 million square miles). This is the eighth lowest in the satellite record for the month (Figure 1a). Extent was 990,000 square kilometers (382,000 square miles) below the 1981 to 2010 average of 10.7 million square kilometers (4.13 million square miles) and 1.05 million square kilometers (405,000 square miles) above the record November low set in 2016 of 8.66 million square kilometers (3.34 square miles).
Overall for the month, ice extent increased at a near-average rate, but with much faster-than-average growth for the first week balanced by slow growth over the remainder of the month. Open water conditions persisted in part of the Chukchi Sea, approximately two weeks late in the season relative to the 1981 to 2010 average. Similarly, ice extent has remained below average in the Kara and Barents Seas, and in Hudson Bay. Ice in the Bering Sea is limited to Norton Sound and Kotzebue Sound. The coast of Svalbard in the far northern North Atlantic remains ice free at the end of the month.
Conditions in context
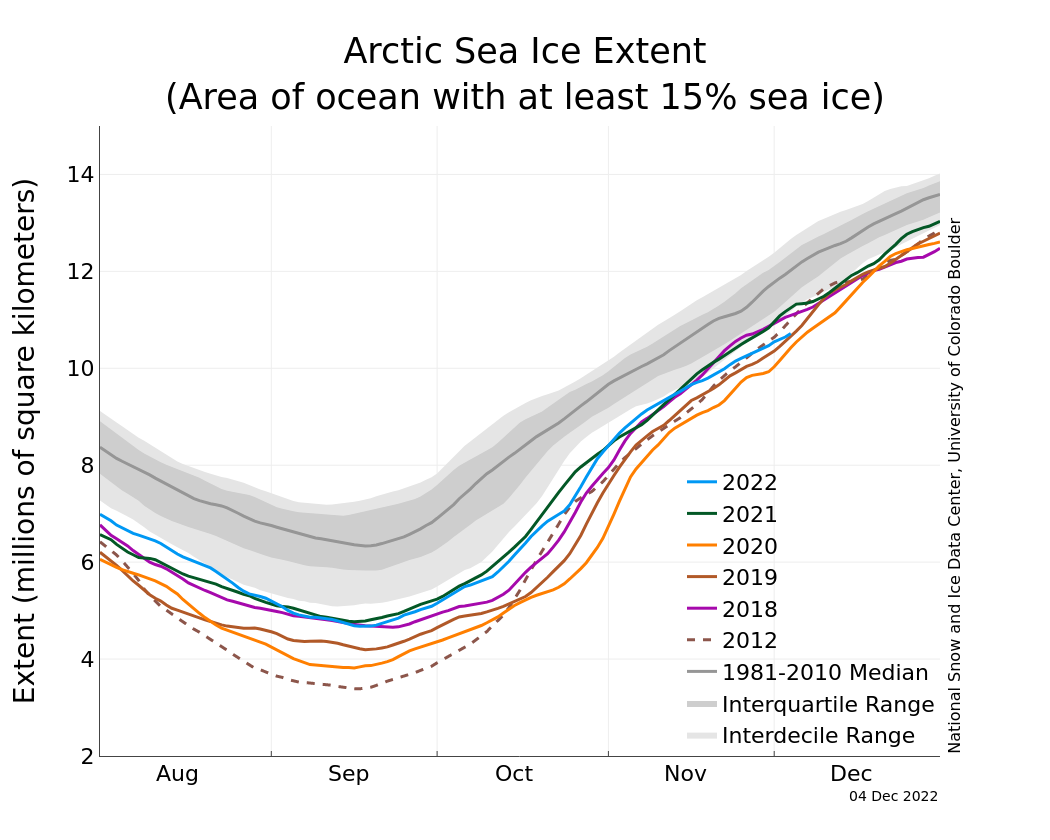
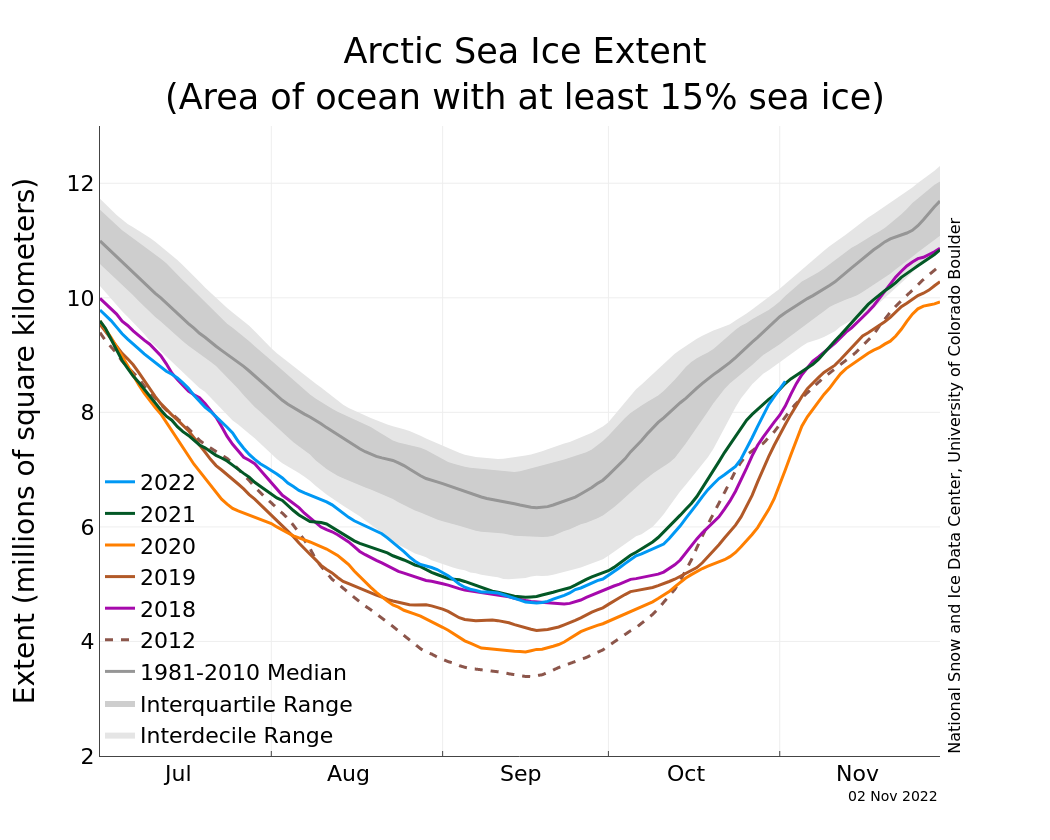
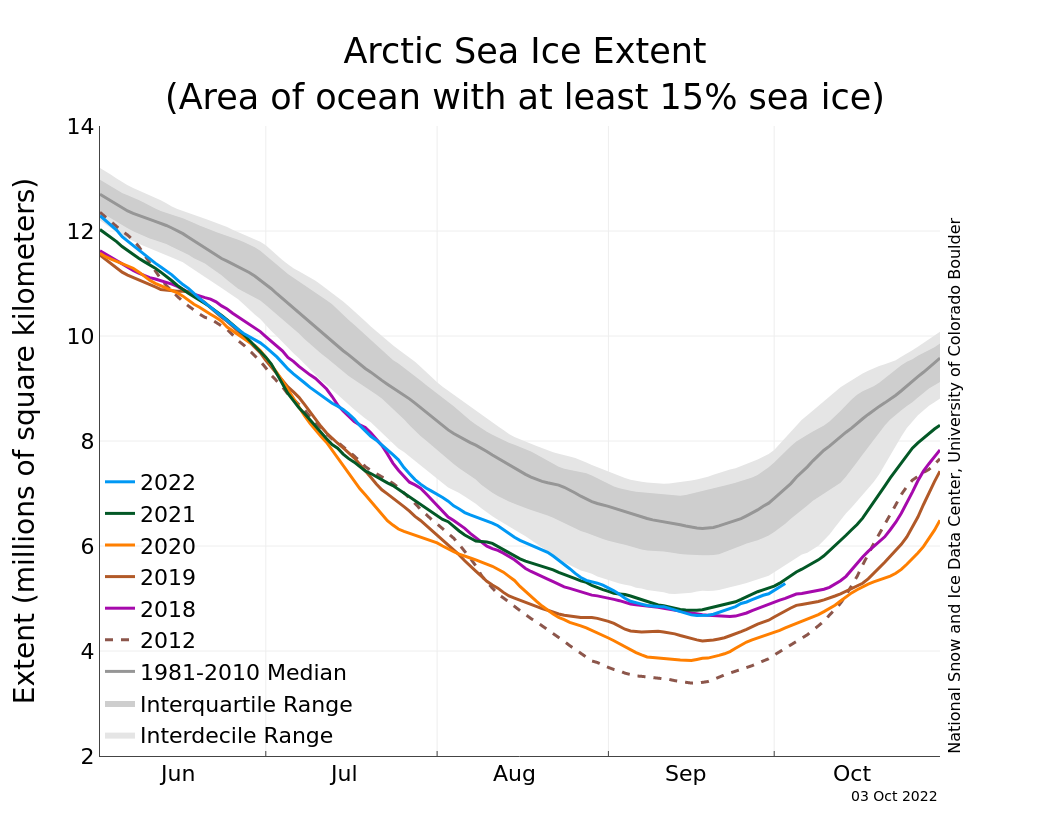
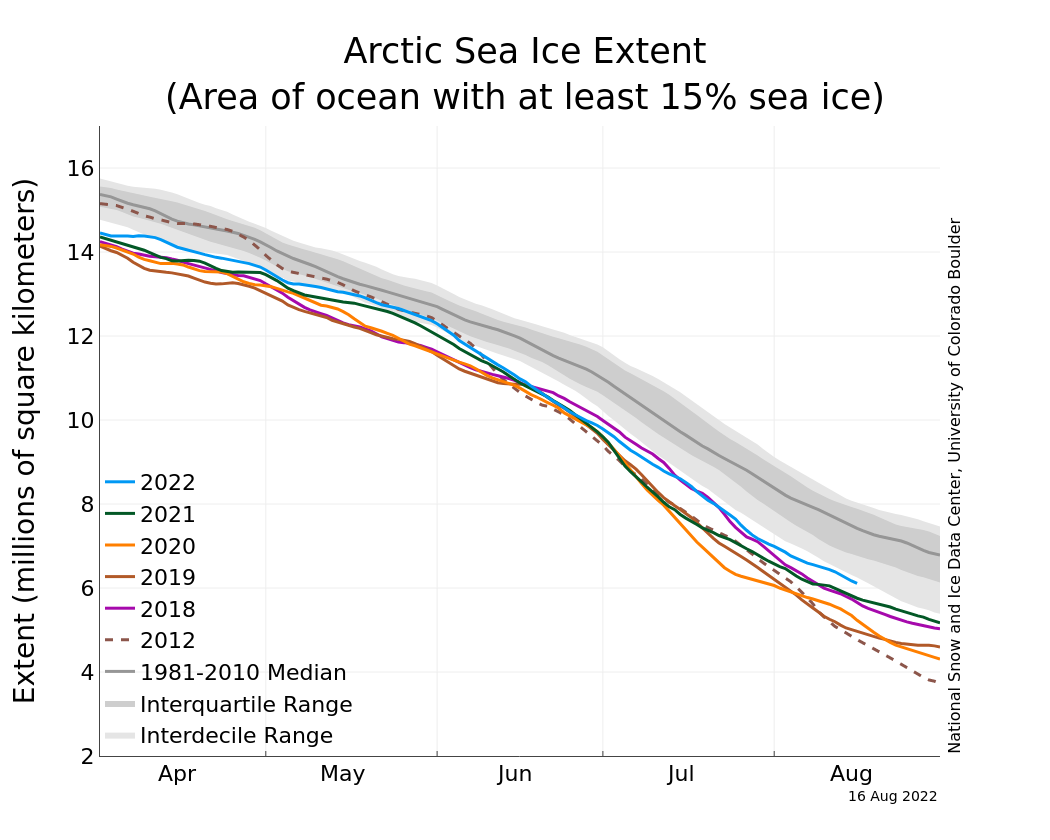
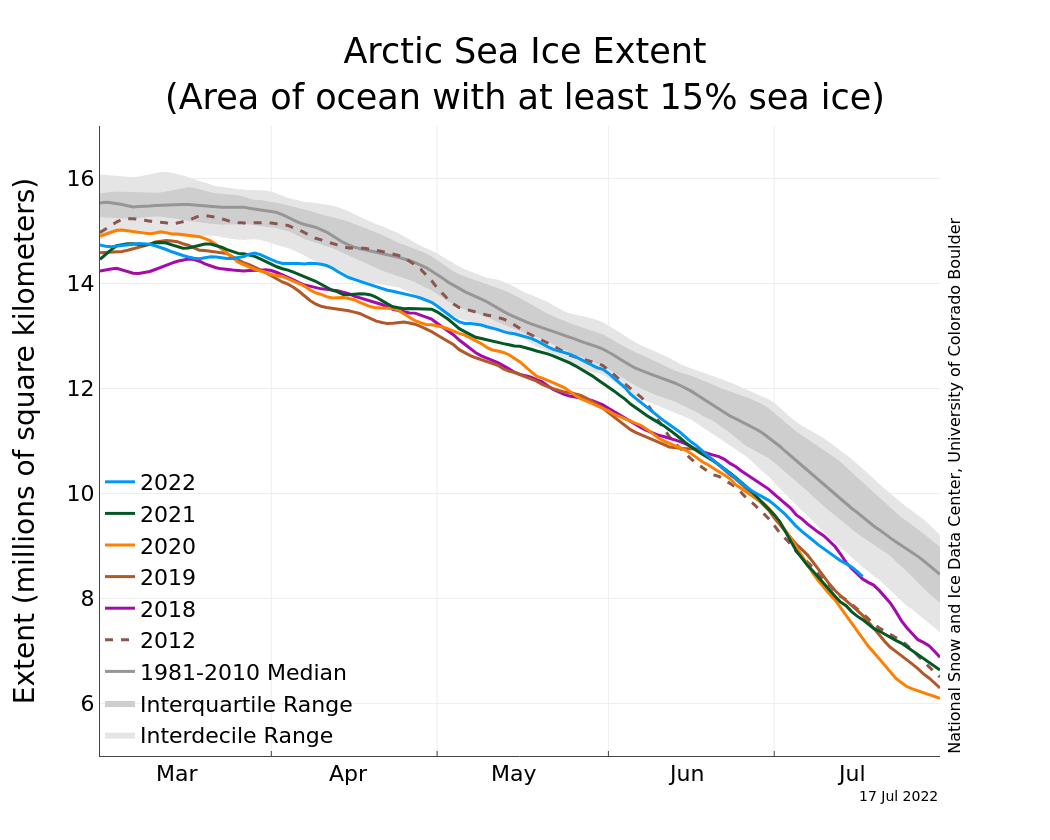
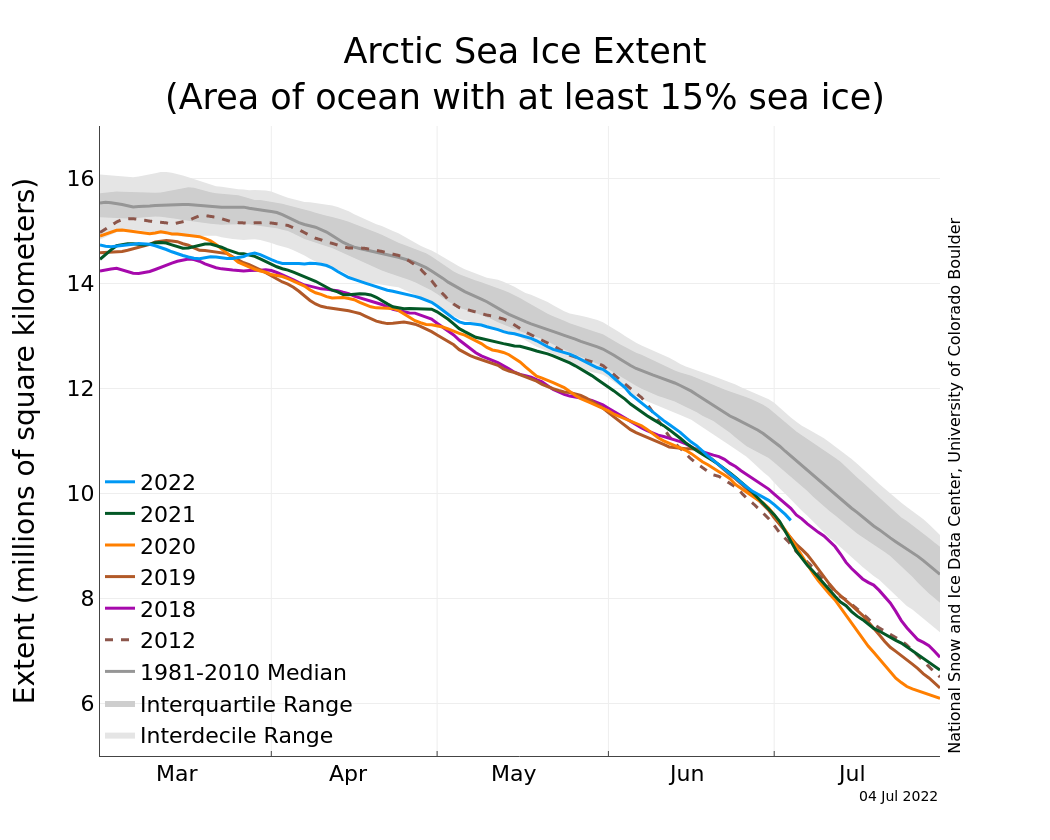
Figure 2a. The graph above shows Arctic sea ice extent as of December 4, 2022, along with daily ice extent data for four previous years and the record low year. 2022 is shown in blue, 2021 in green, 2020 in orange, 2019 in brown, 2018 in magenta, and 2012 in dashed brown. The 1981 to 2010 median is in dark gray. The gray areas around the median line show the interquartile and interdecile ranges of the data. Sea Ice Index data.
Credit: National Snow and Ice Data Center
High-resolution image
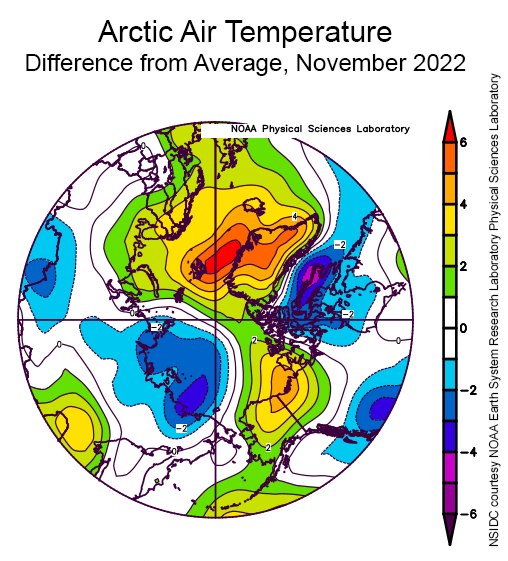
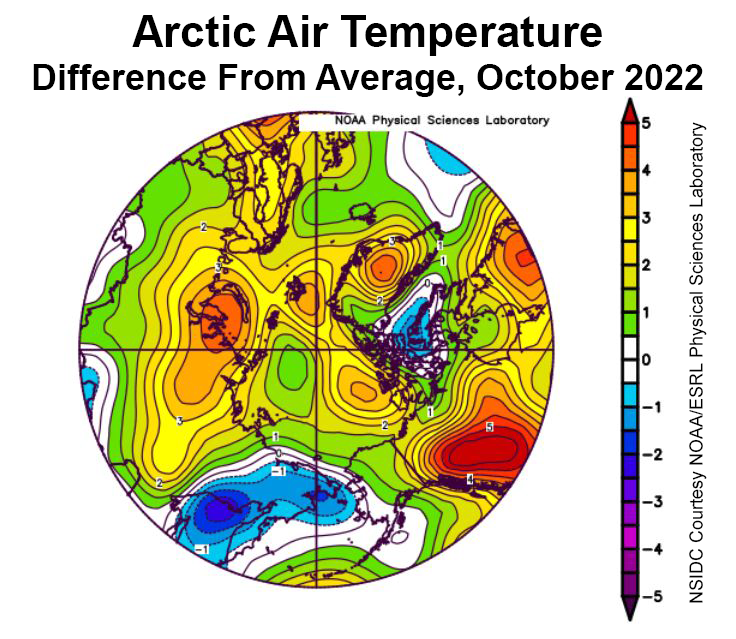
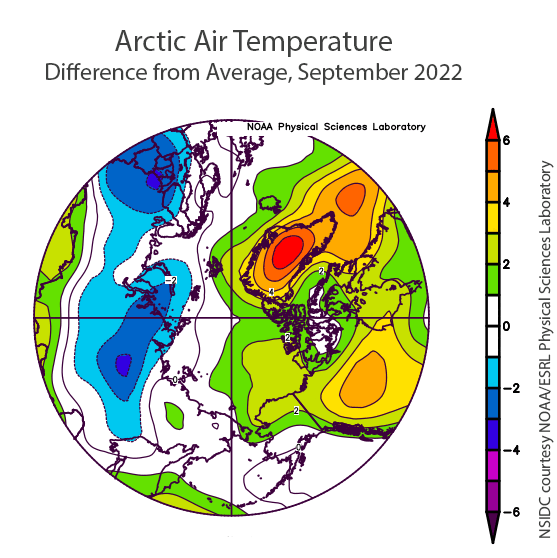
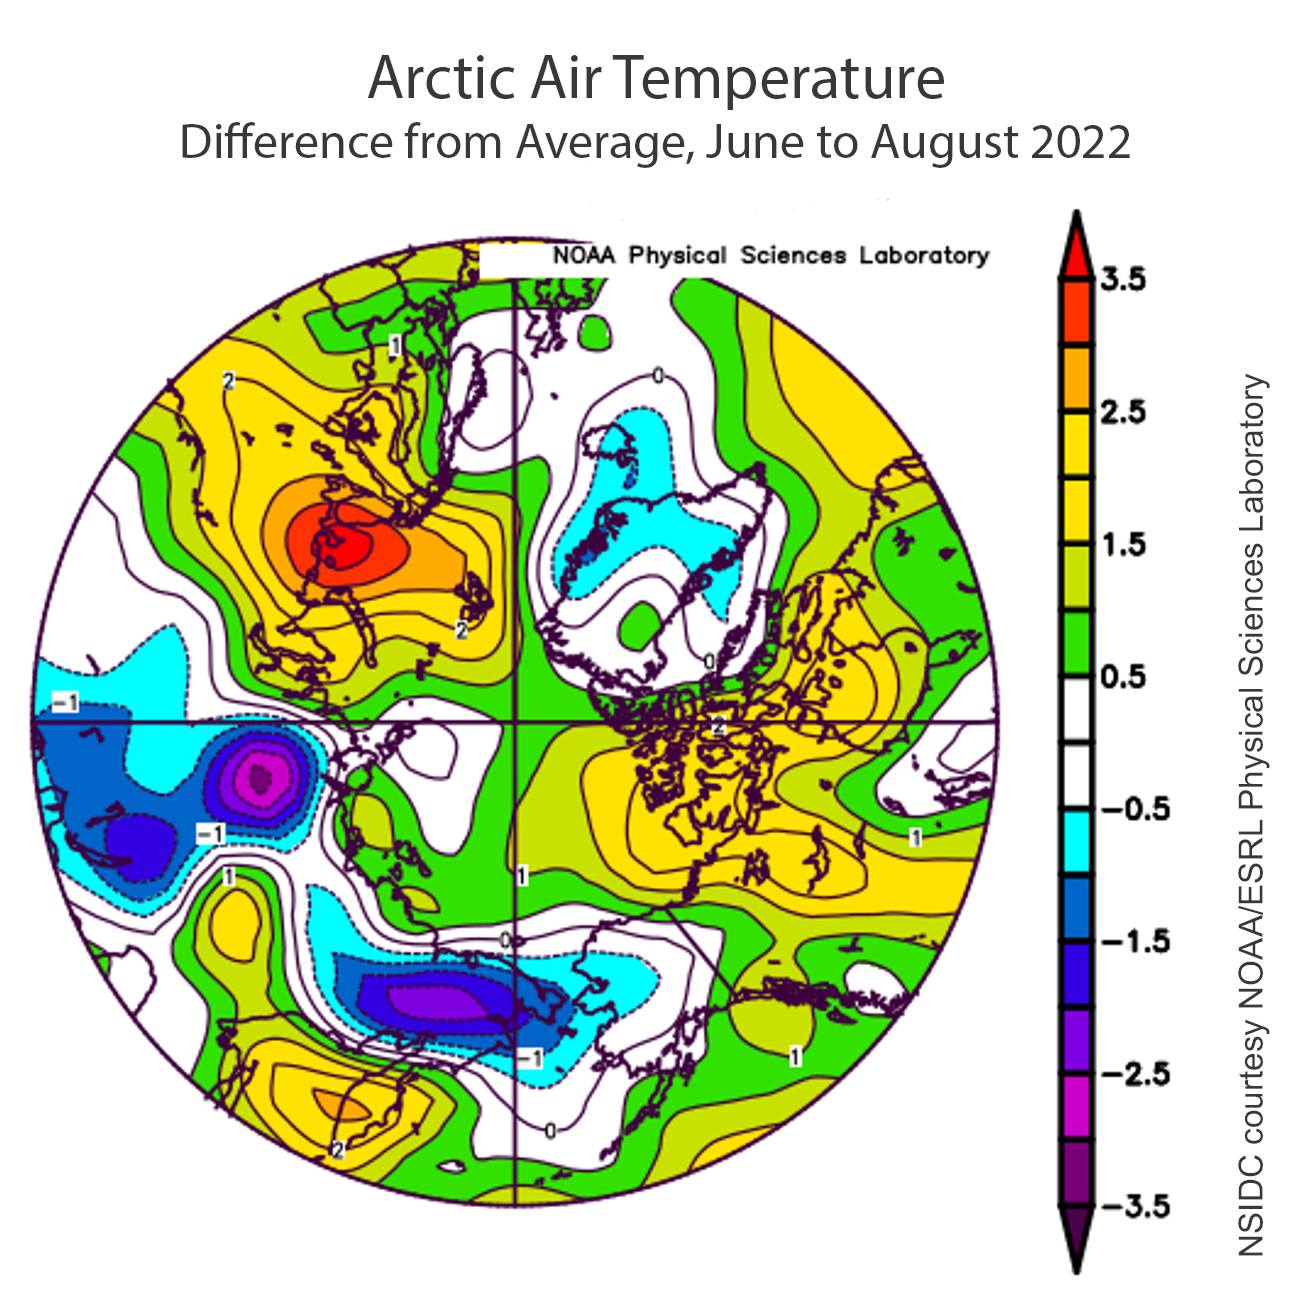
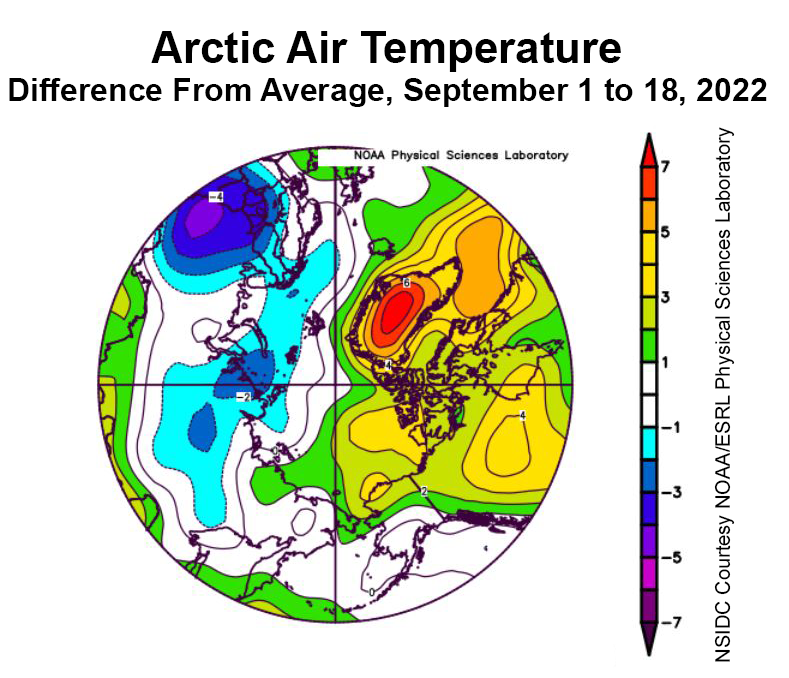
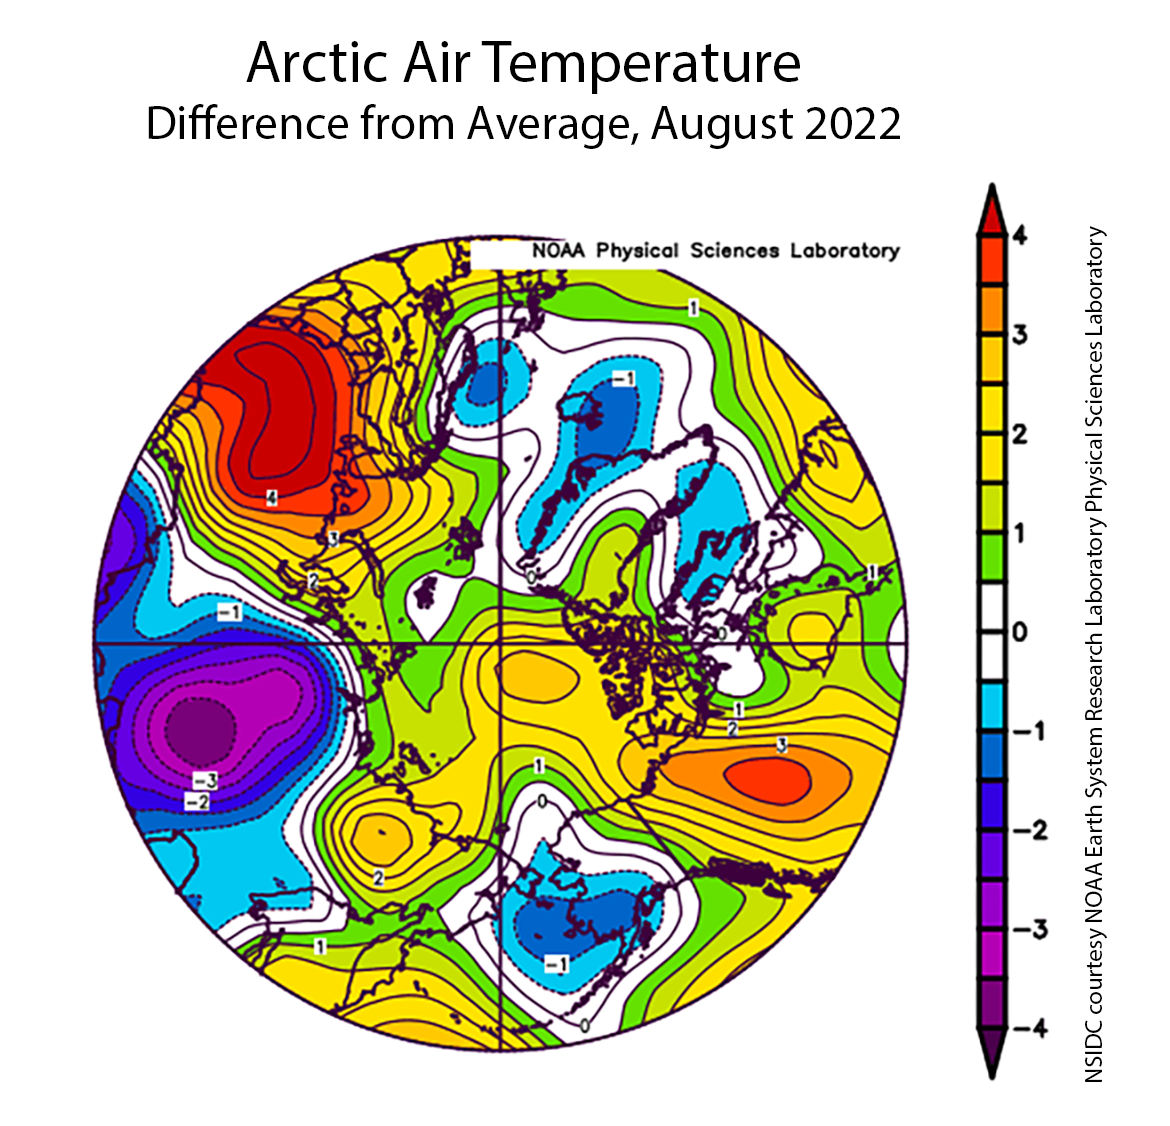
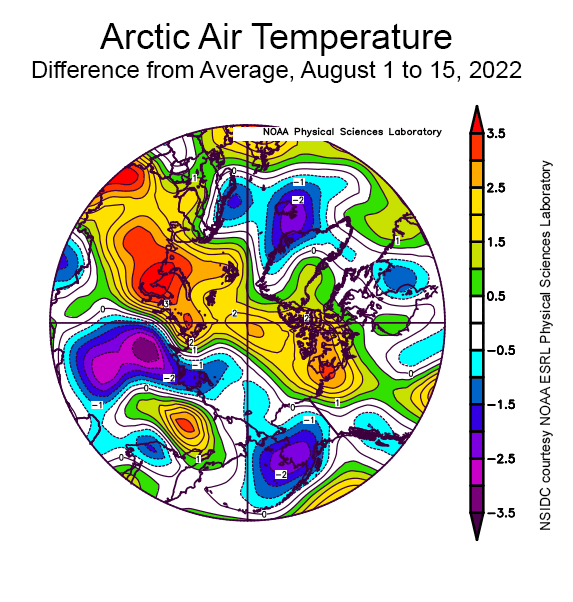
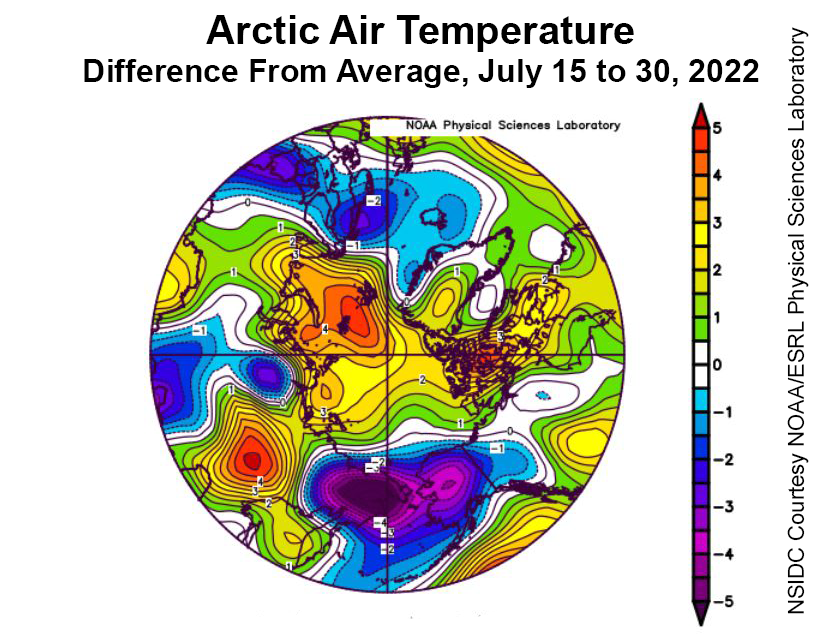
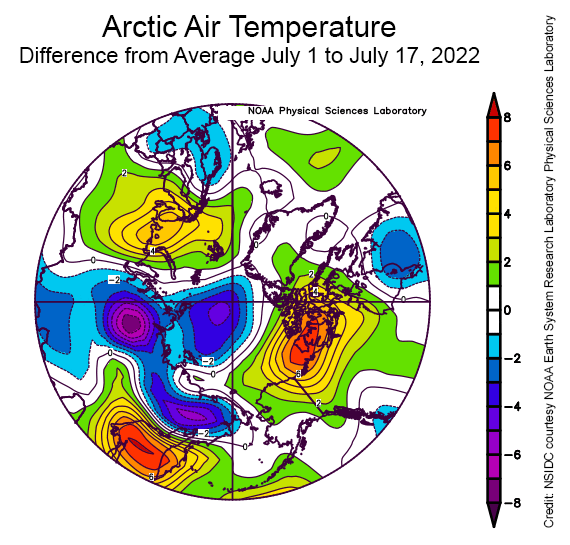
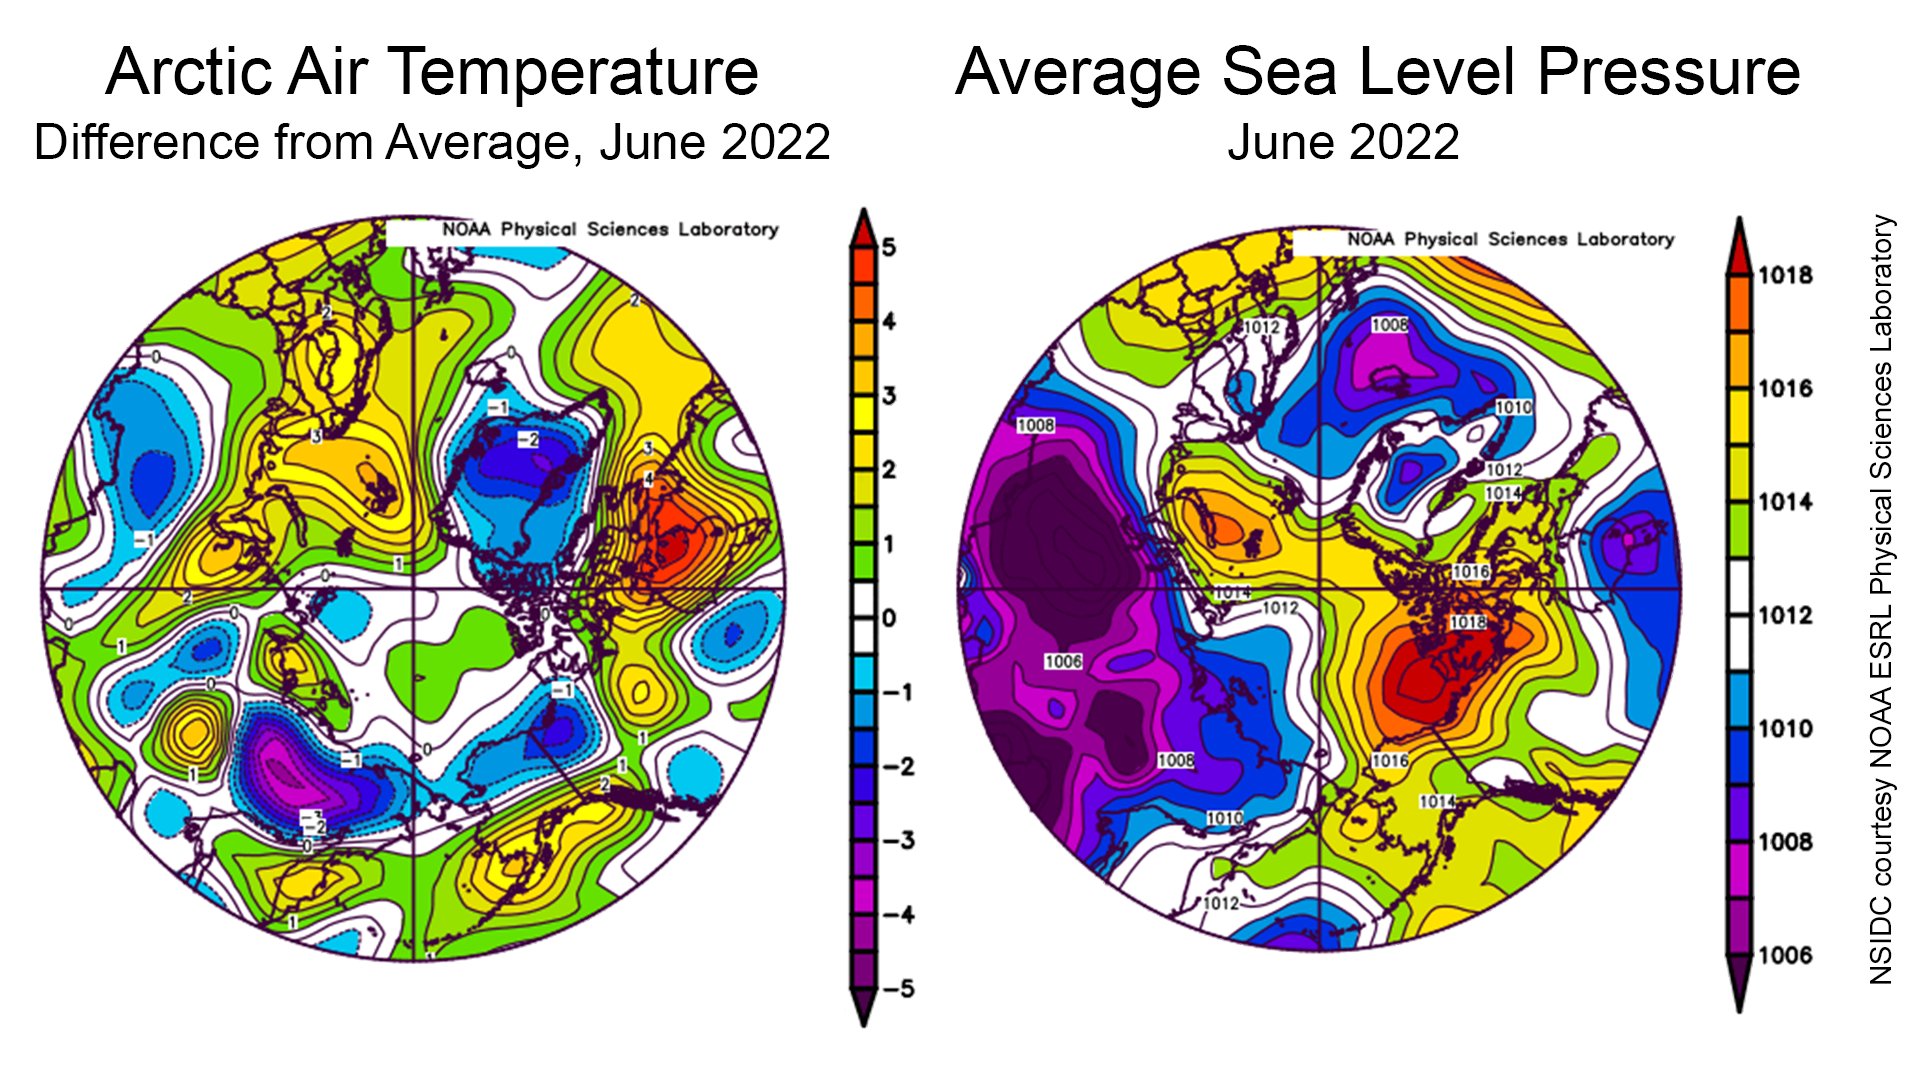
Figure 2b. This plot shows the departure from average air temperature in the Arctic at the 925 hPa level, in degrees Celsius, for November 2022. Yellows and reds indicate higher than average temperatures; blues and purples indicate lower than average temperatures.
Credit: NSIDC courtesy NOAA Earth System Research Laboratory Physical Sciences Laboratory
High-resolution image
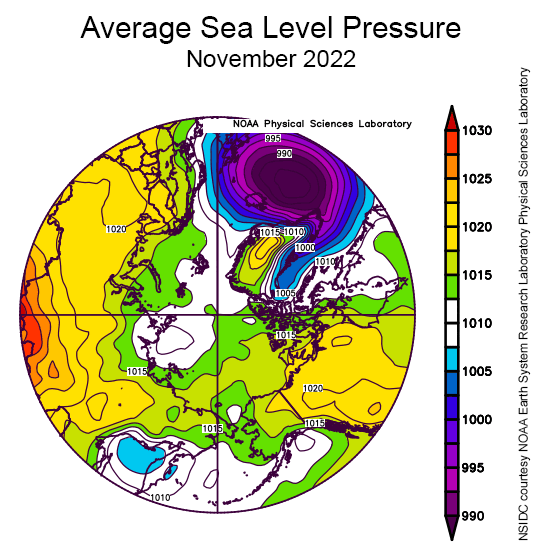
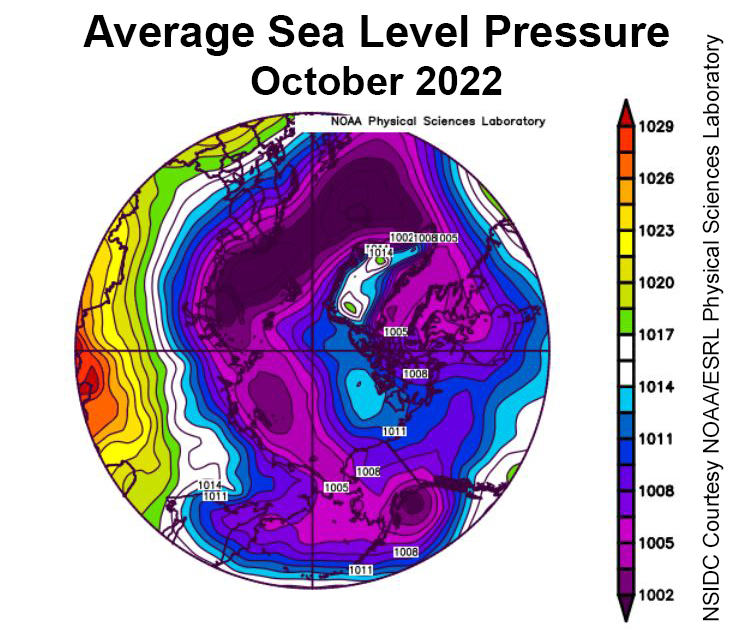
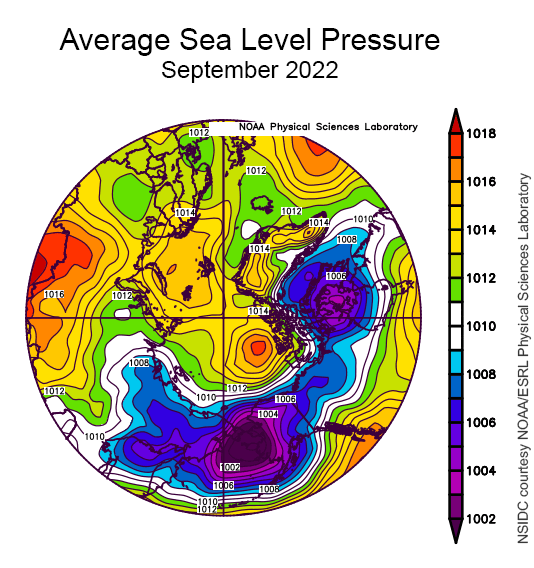
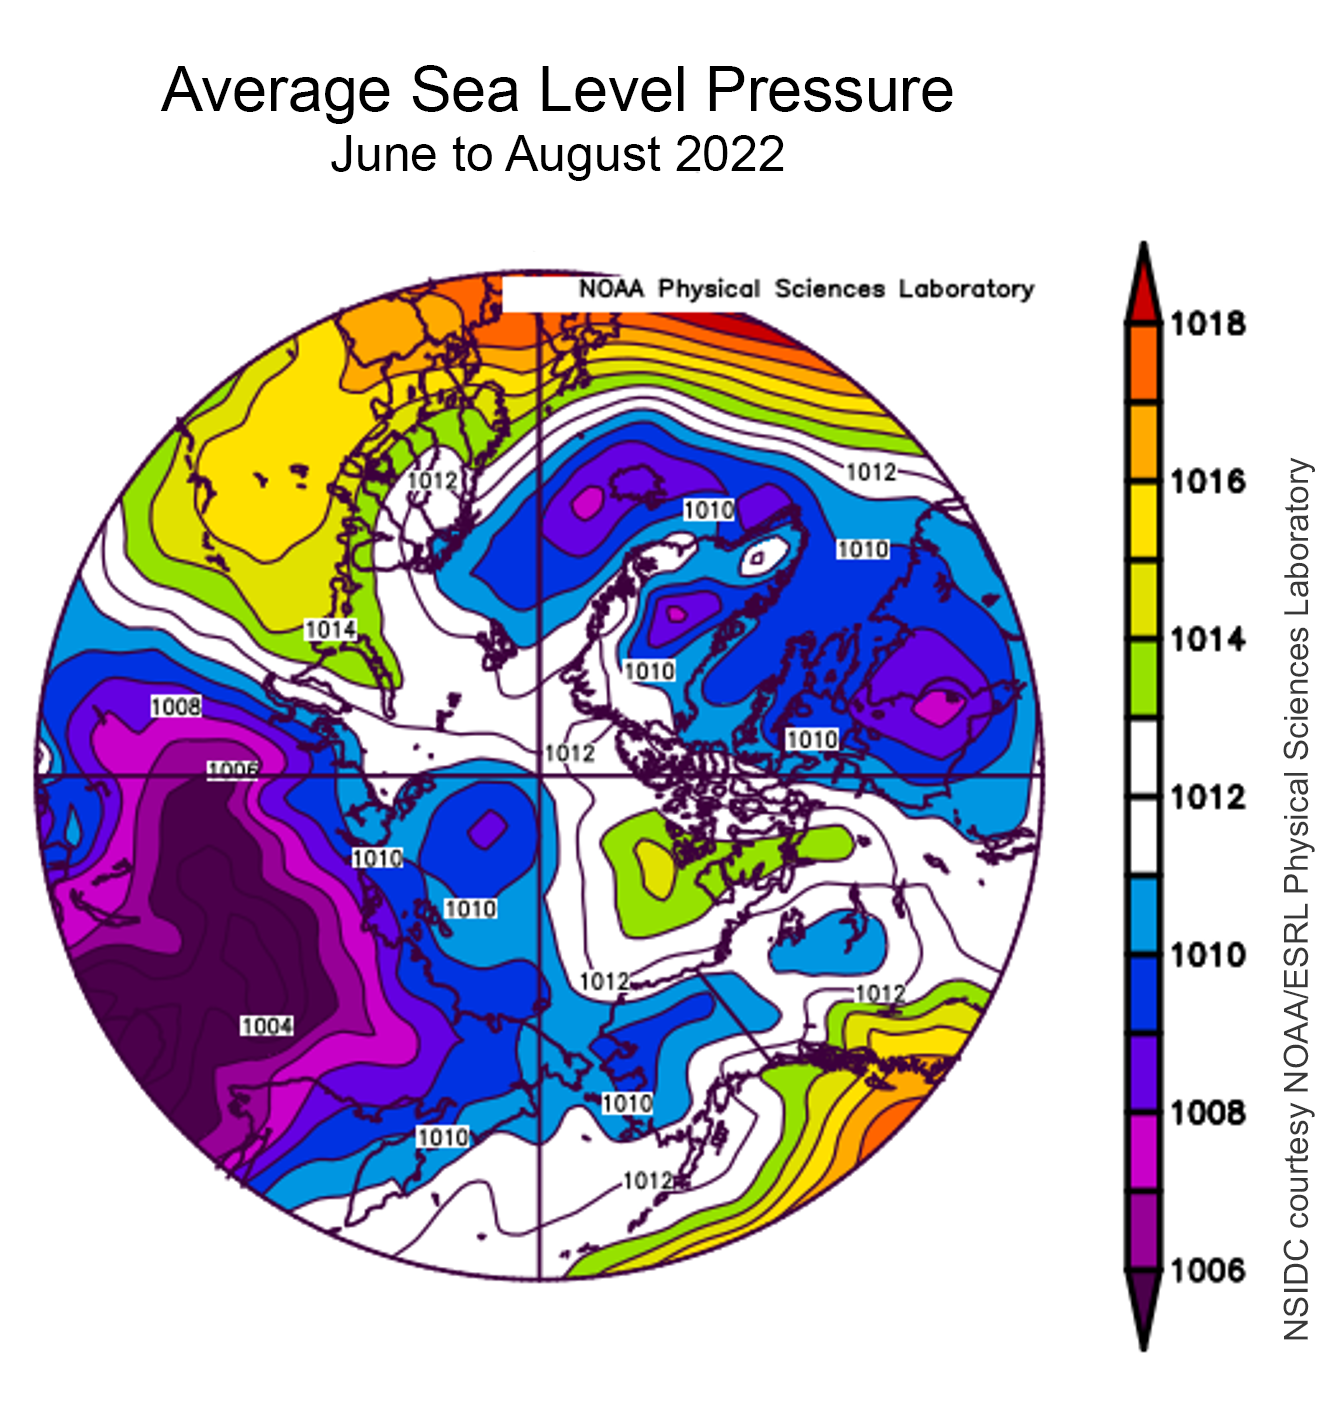
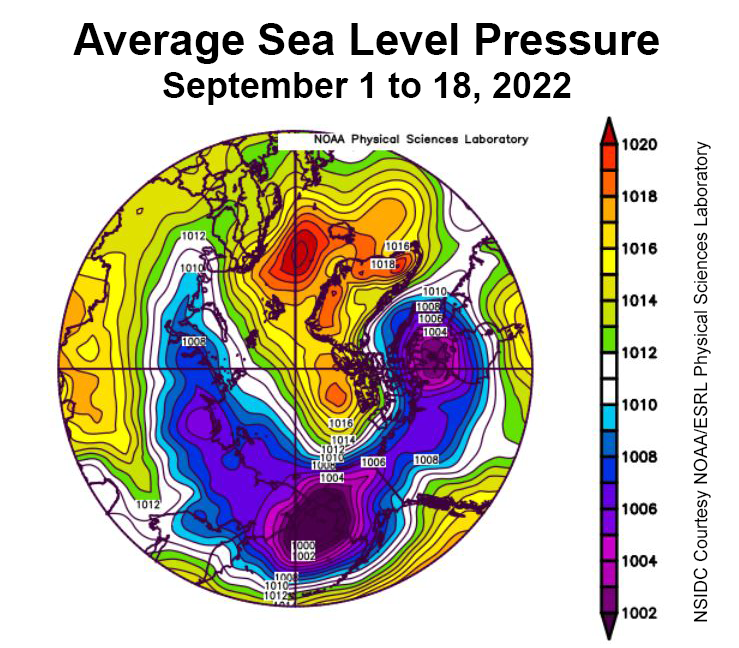
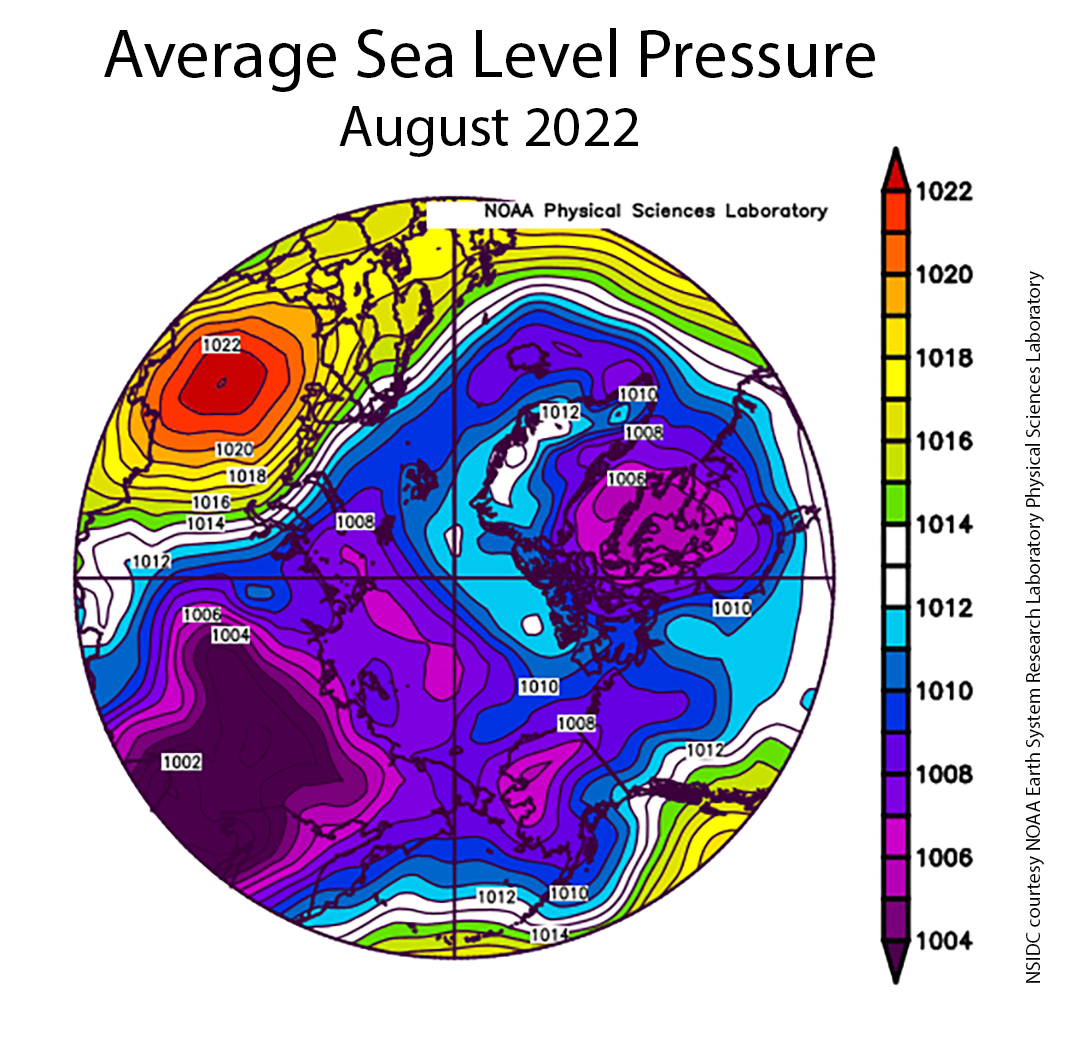
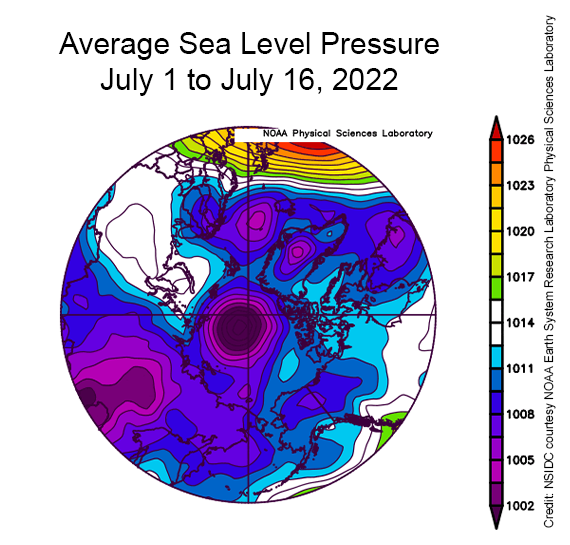
Figure 2c. This plot shows average sea level pressure in the Arctic in millibars for November 2022. Yellows and reds indicate high air pressure; blues and purples indicate low pressure.
Credit: NSIDC courtesy NOAA Earth System Research Laboratory Physical Sciences Laboratory
High-resolution image
Warm conditions prevailed in the northern North Atlantic and over northwestern Europe (Figure 2b). Air temperatures at the 925 mb level (approximately 2,500 feet above the surface) over much of the Greenland Sea (between Norway and Greenland) were 3 to 6 degrees Celsius (5 to 11 degrees Fahrenheit) above average. Temperatures in the northern Yukon and northeastern Alaska regions were about 4 degrees Celsius (7 degrees Fahrenheit) above average. However, the Siberian side of the Arctic experienced temperatures 1 to 3 degrees Celsius (2 to 5 degrees Fahrenheit) below average. The Baffin Bay region had temperatures 3 to 5 degrees Celsius (5 to 9 degrees Fahrenheit) below average.
Atmospheric circulation for the month was characterized by a strong low sea level pressure centered south of Iceland (Figure 2c). The counterclockwise circulation around this low is largely responsible for the widespread warm conditions in the northern North Atlantic and the cooler conditions in Baffin Bay. By contrast, the pressure field over the Arctic Ocean was fairly flat, indicating weak winds overall.
November 2022 compared to previous years
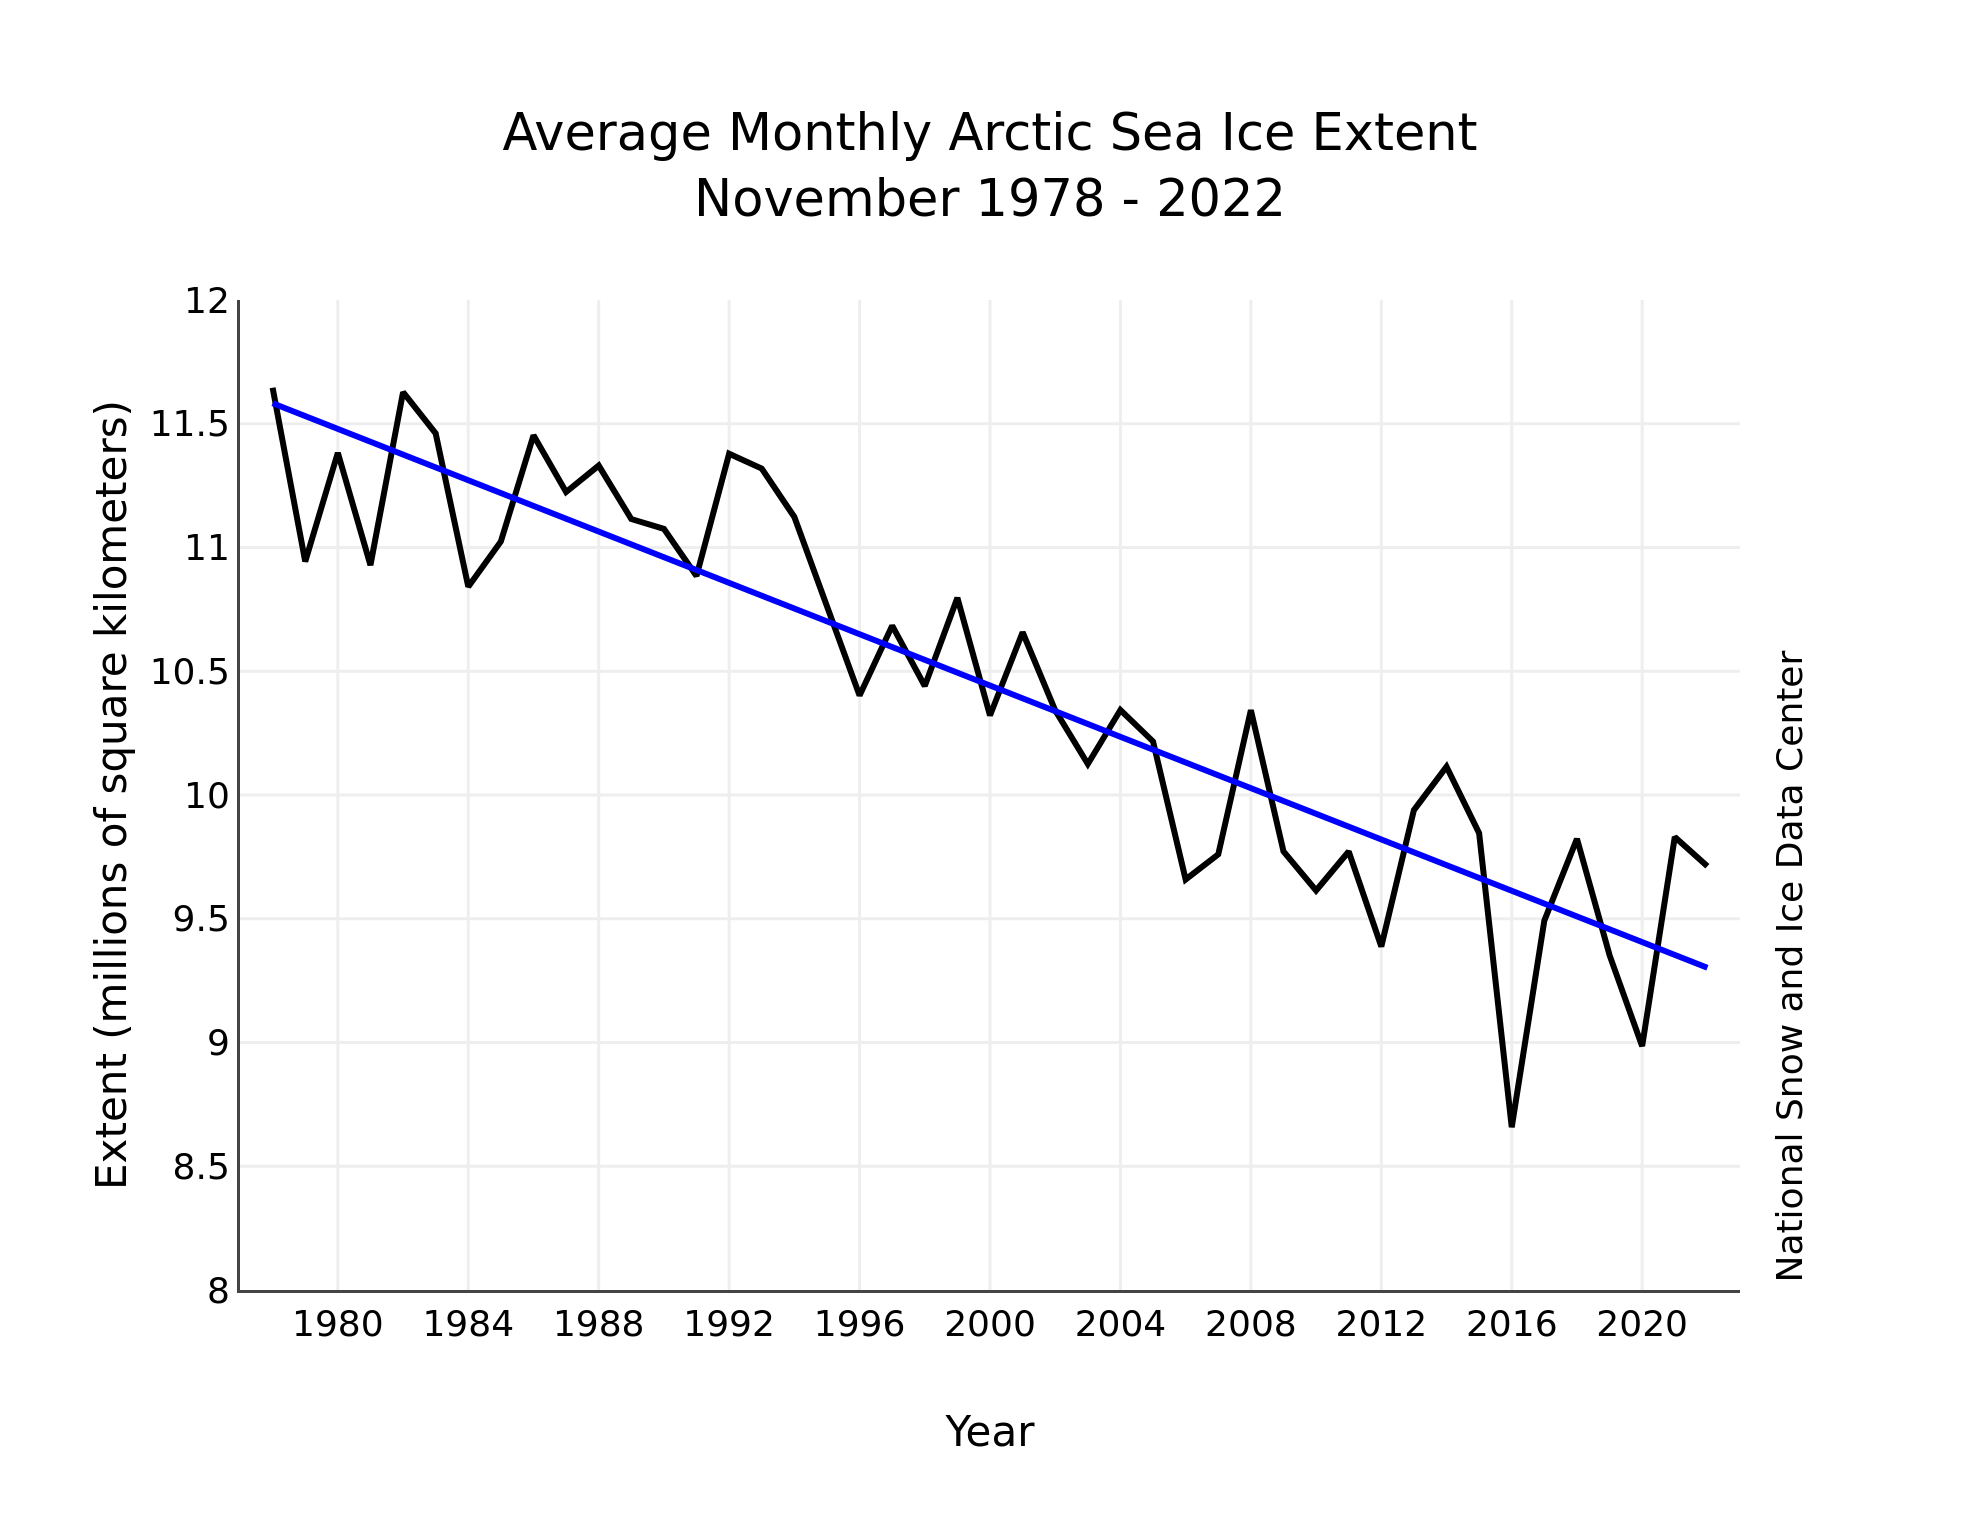
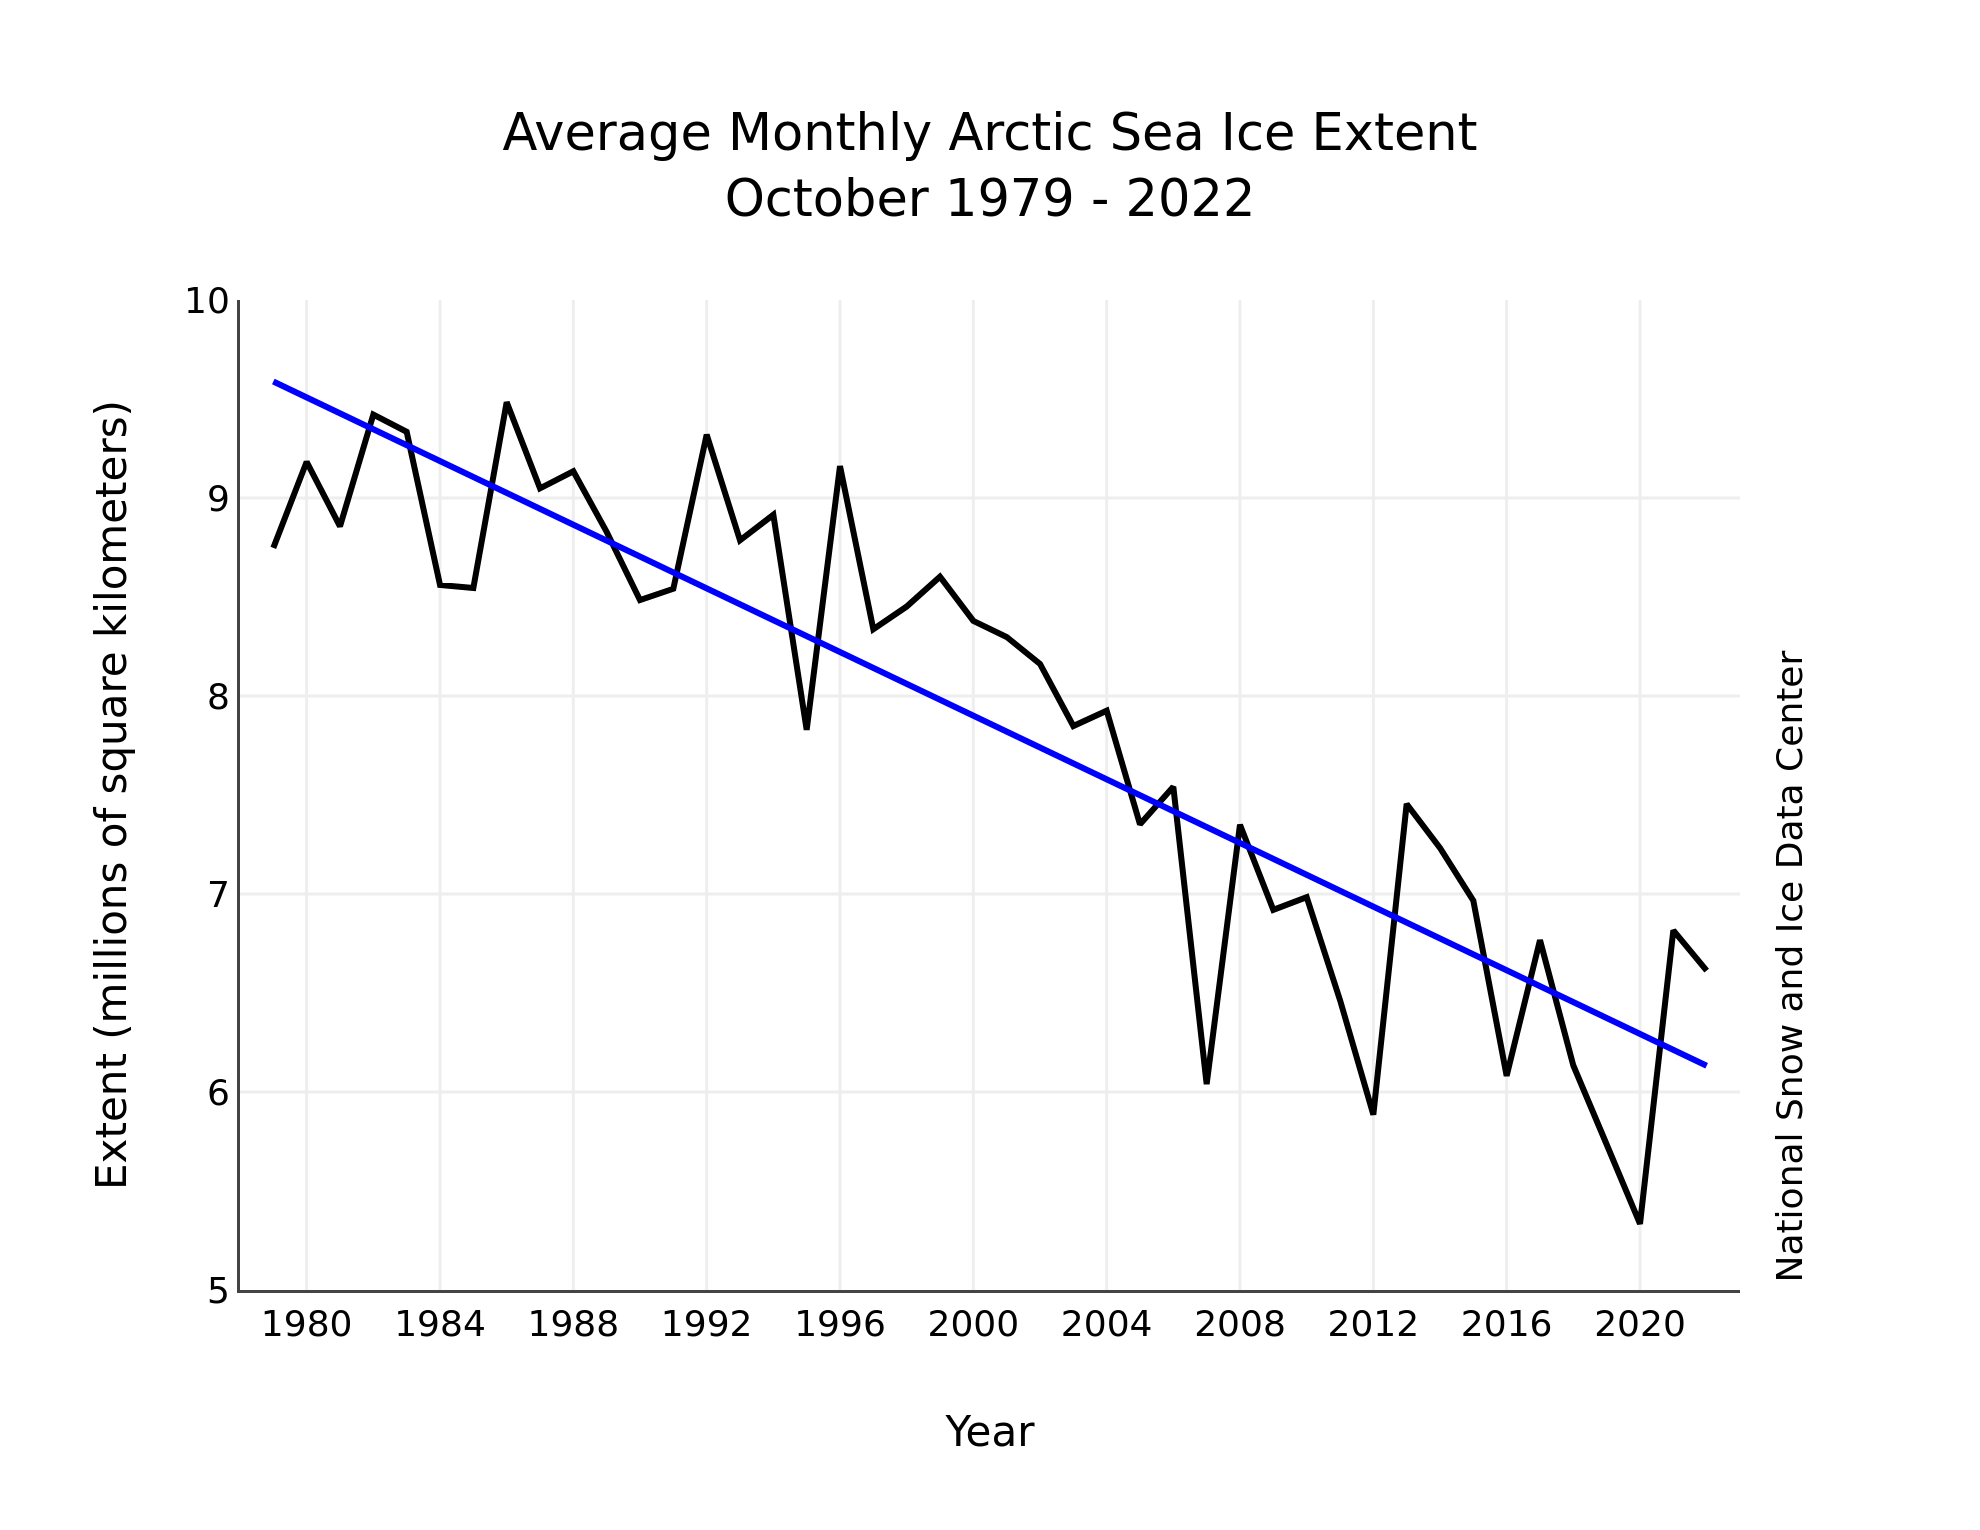
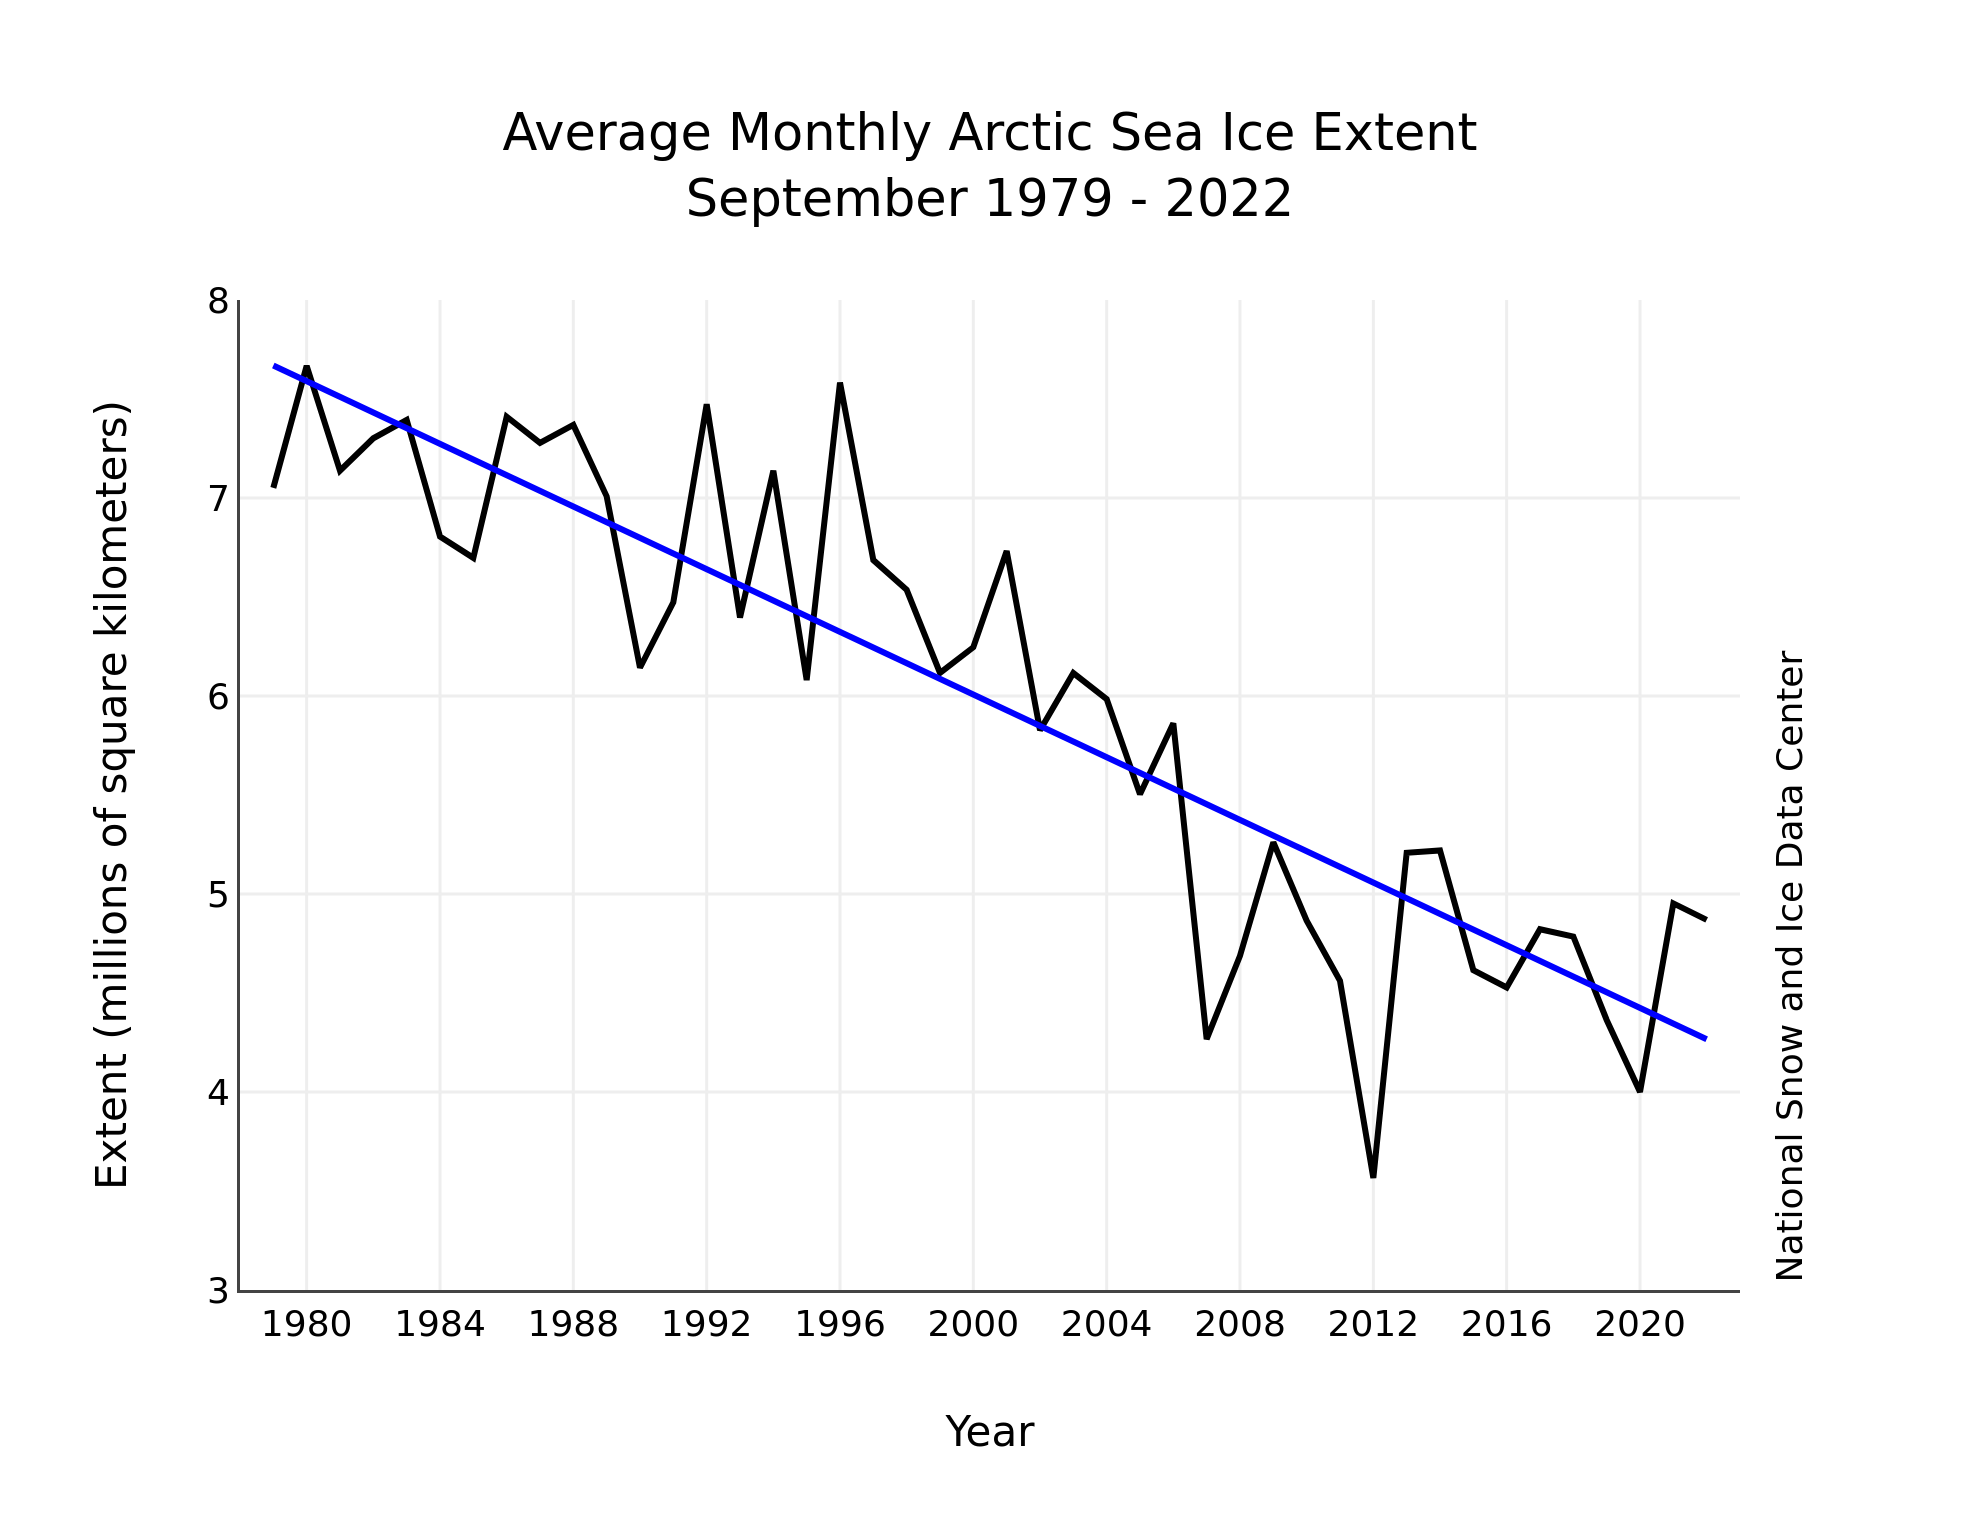
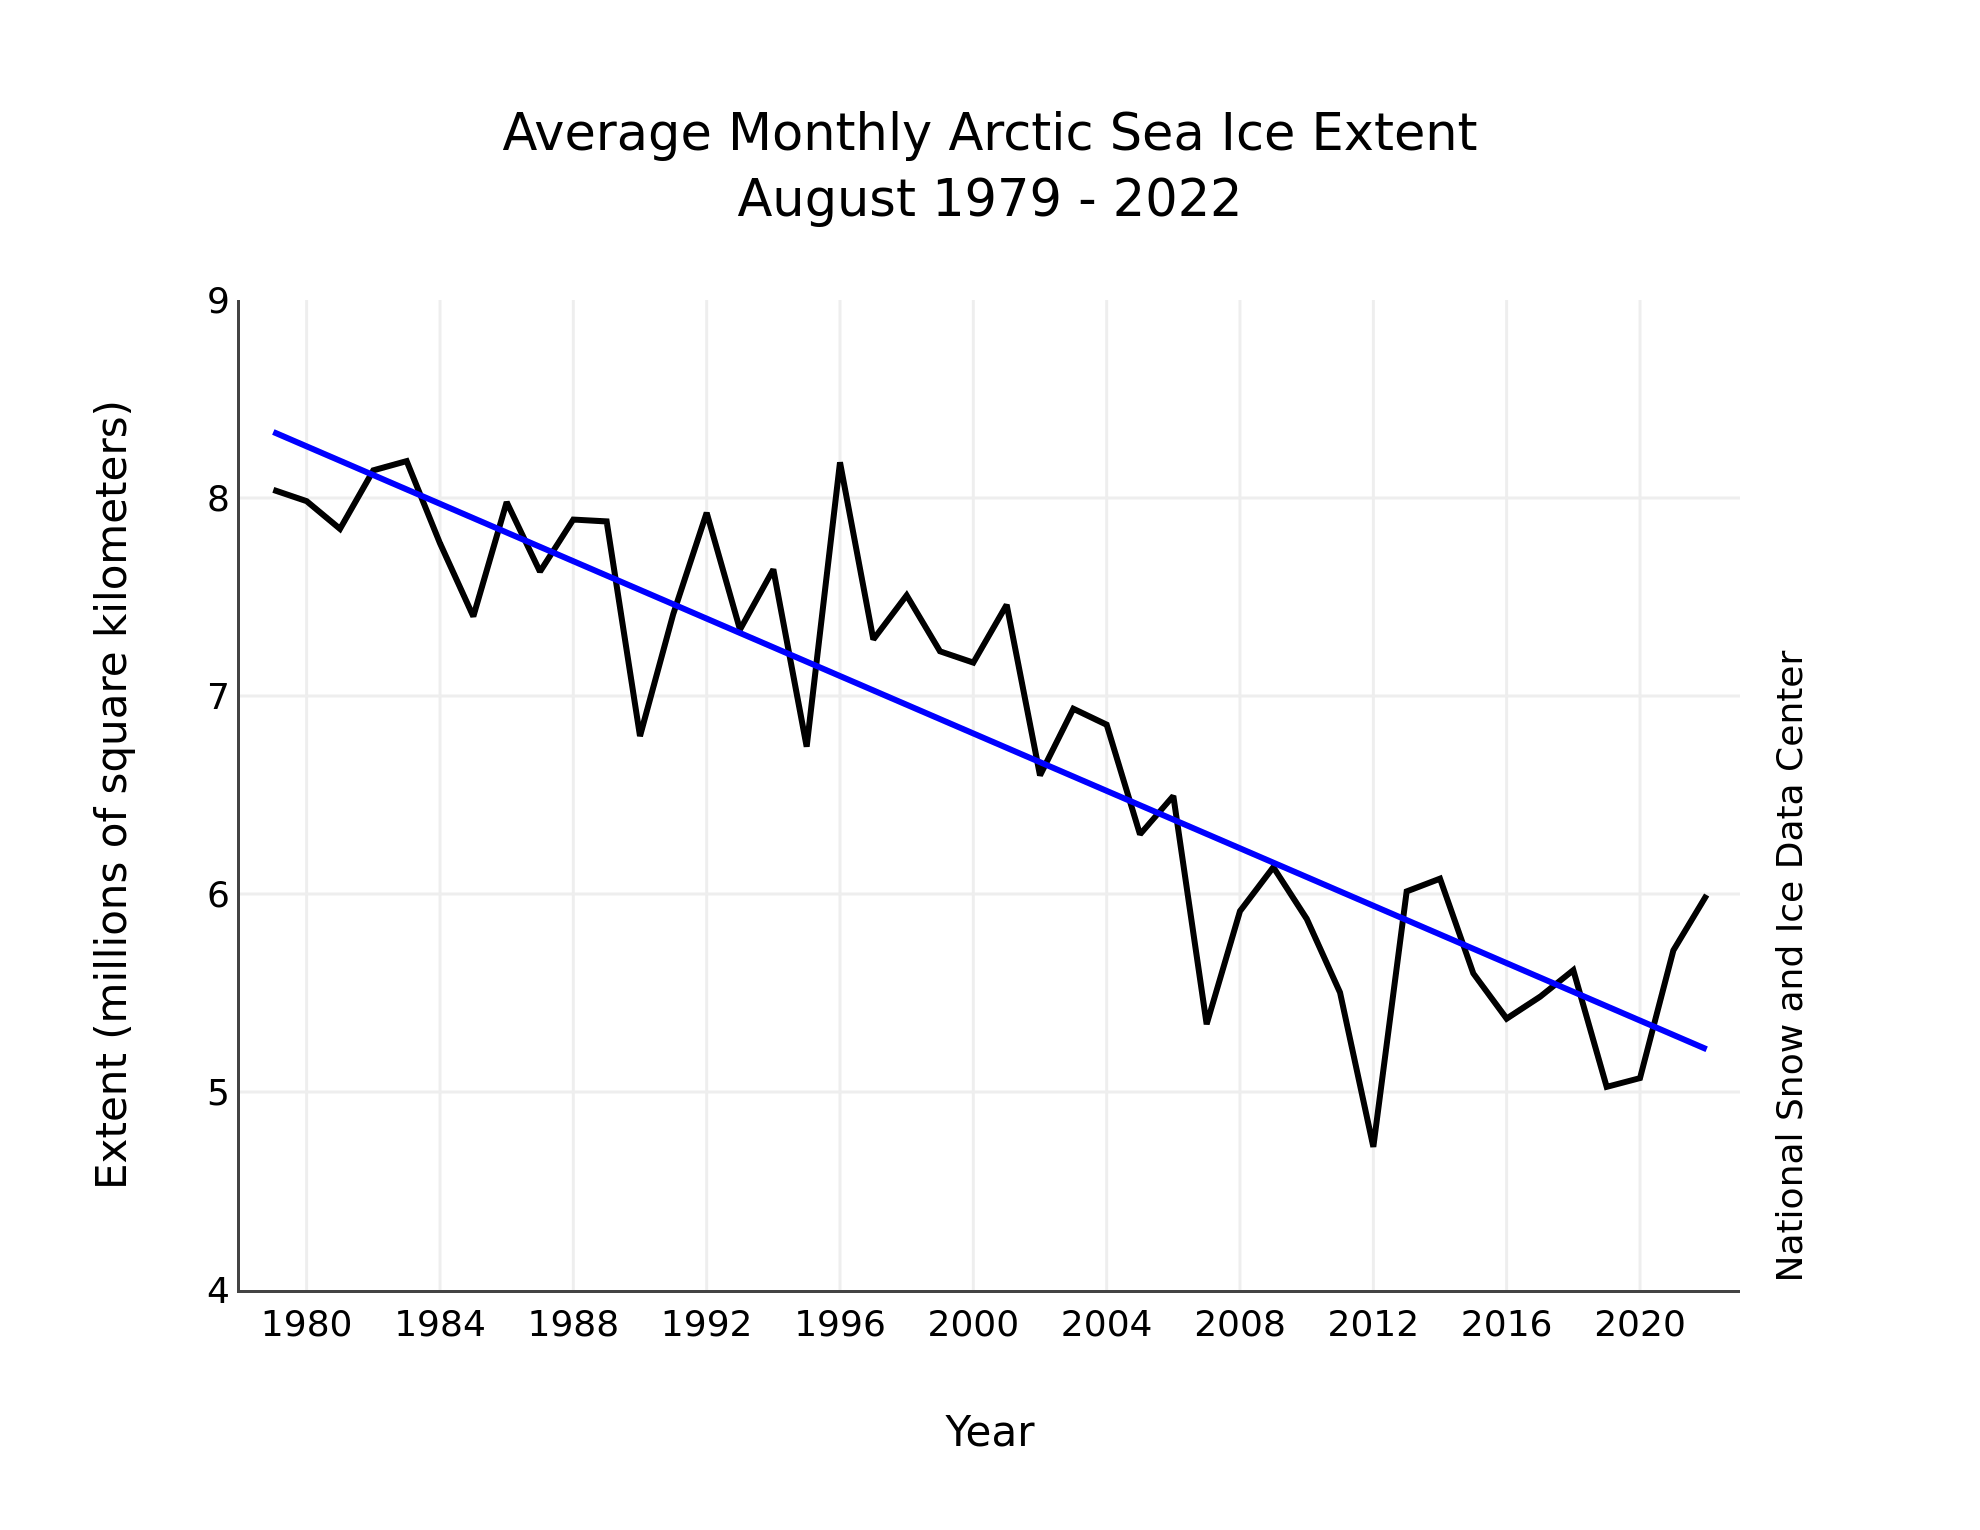
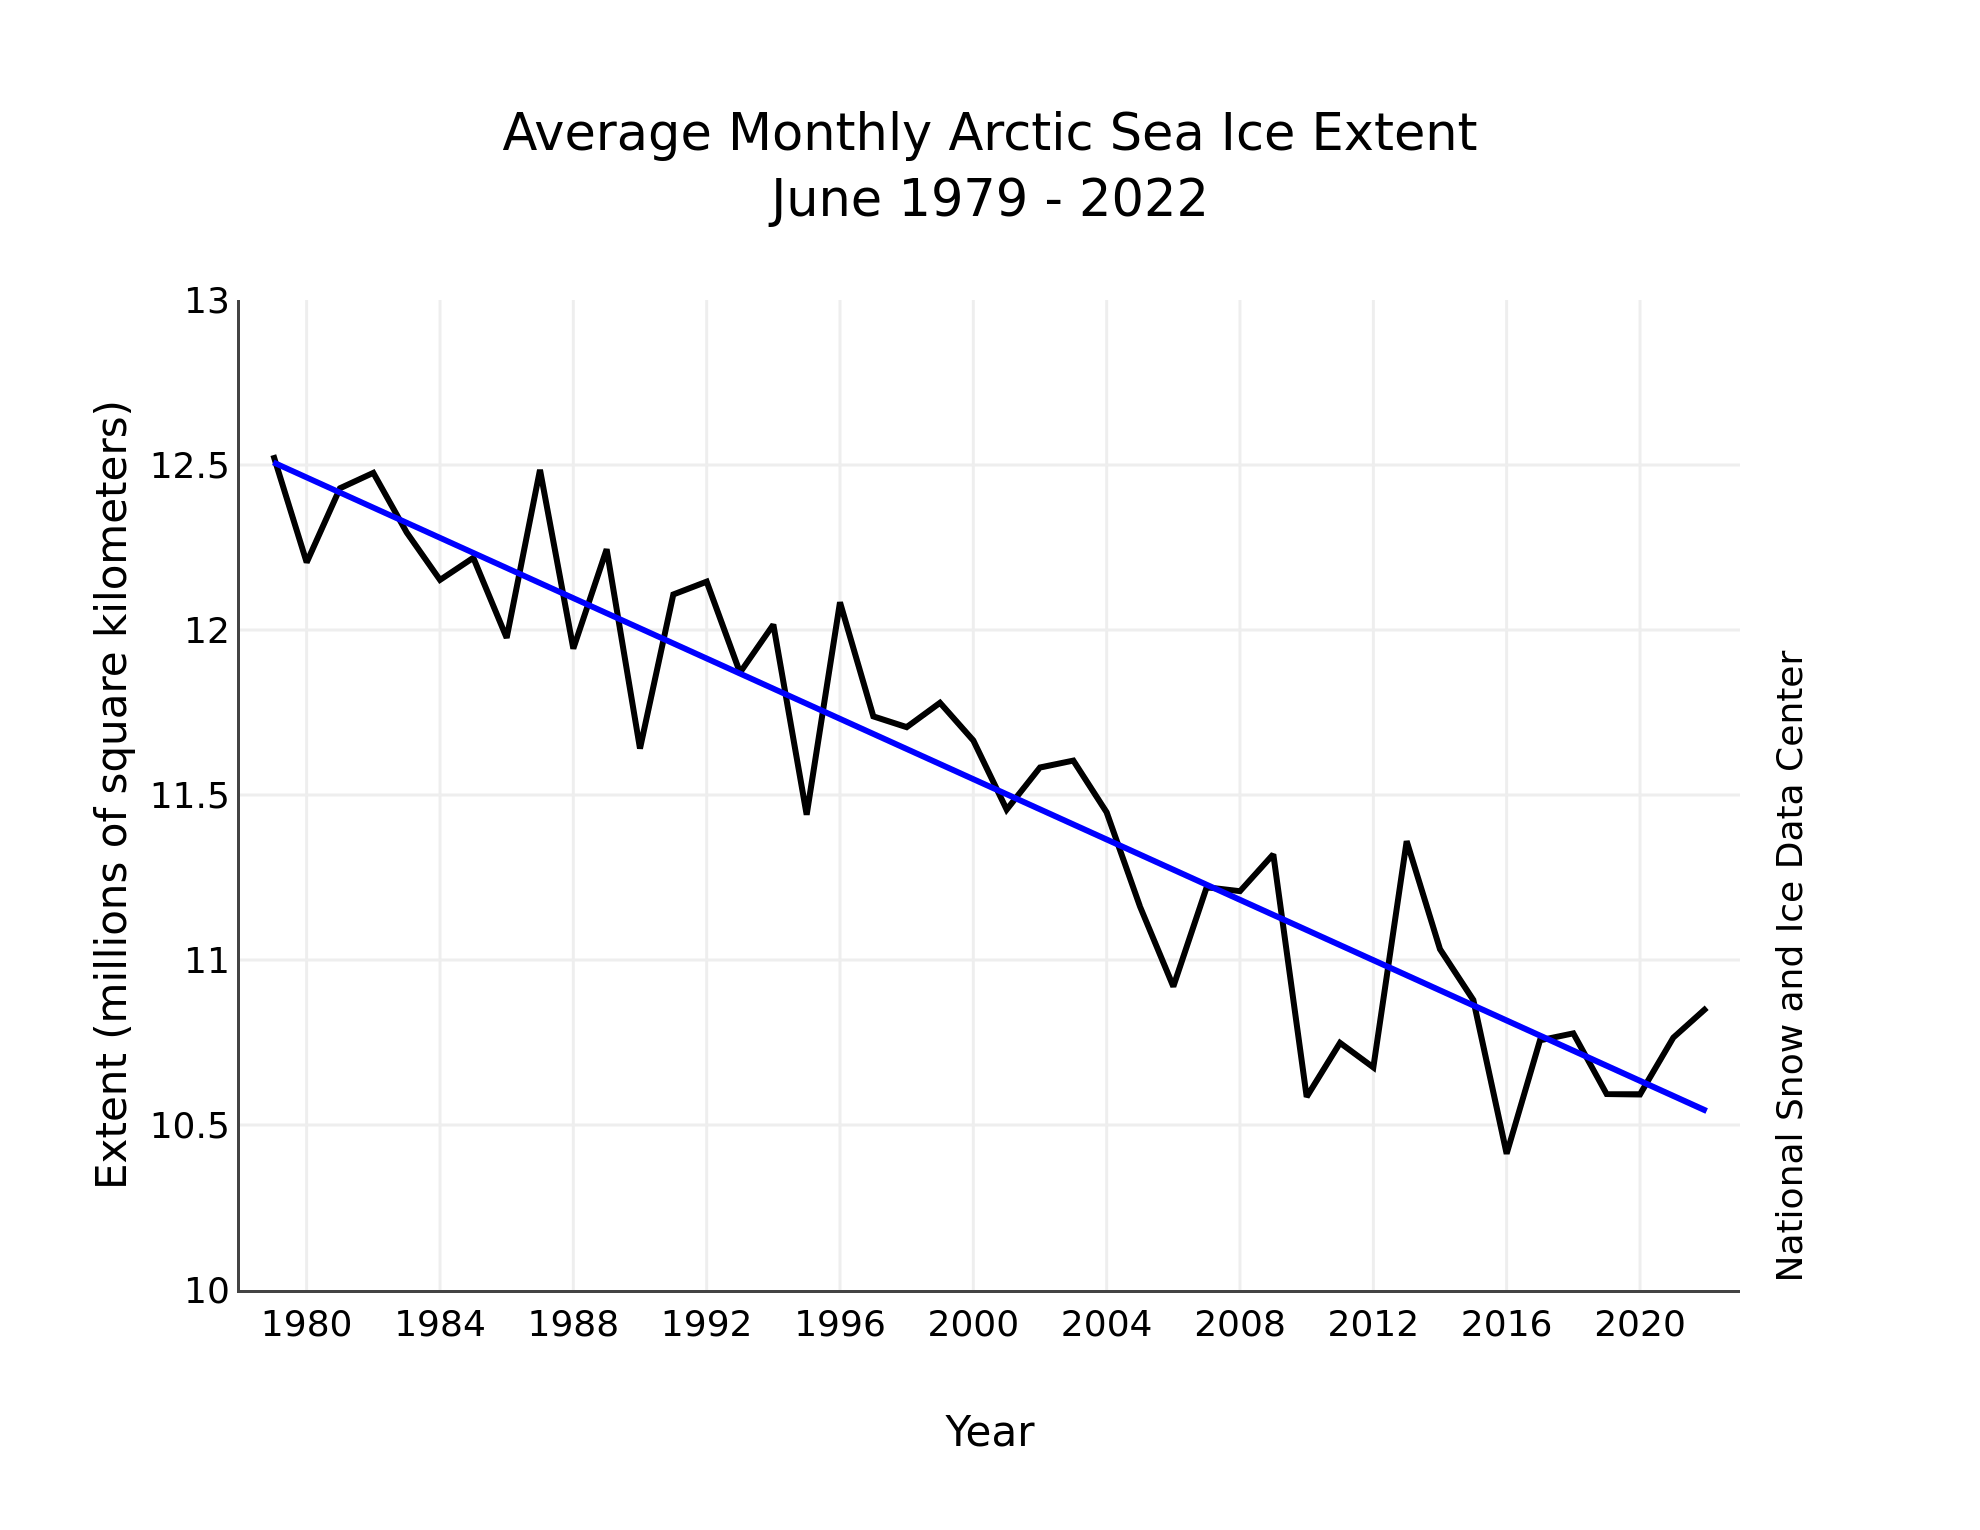
Figure 3. Monthly November ice extent for 1979 to 2022 shows a decline of 4.8 percent per decade.
Credit: National Snow and Ice Data Center
High-resolution image
The downward linear trend in November sea ice extent over the 45-year satellite record is 51,800 square kilometers (20,000 square miles) per year, or 4.8 percent per decade relative to the 1981 to 2010 average. Based on the linear trend, since 1978, November has lost 2.28 million square kilometers (880,000 square miles). This is equivalent to 1.5 times the size of Alaska.
Bloomin’ down under
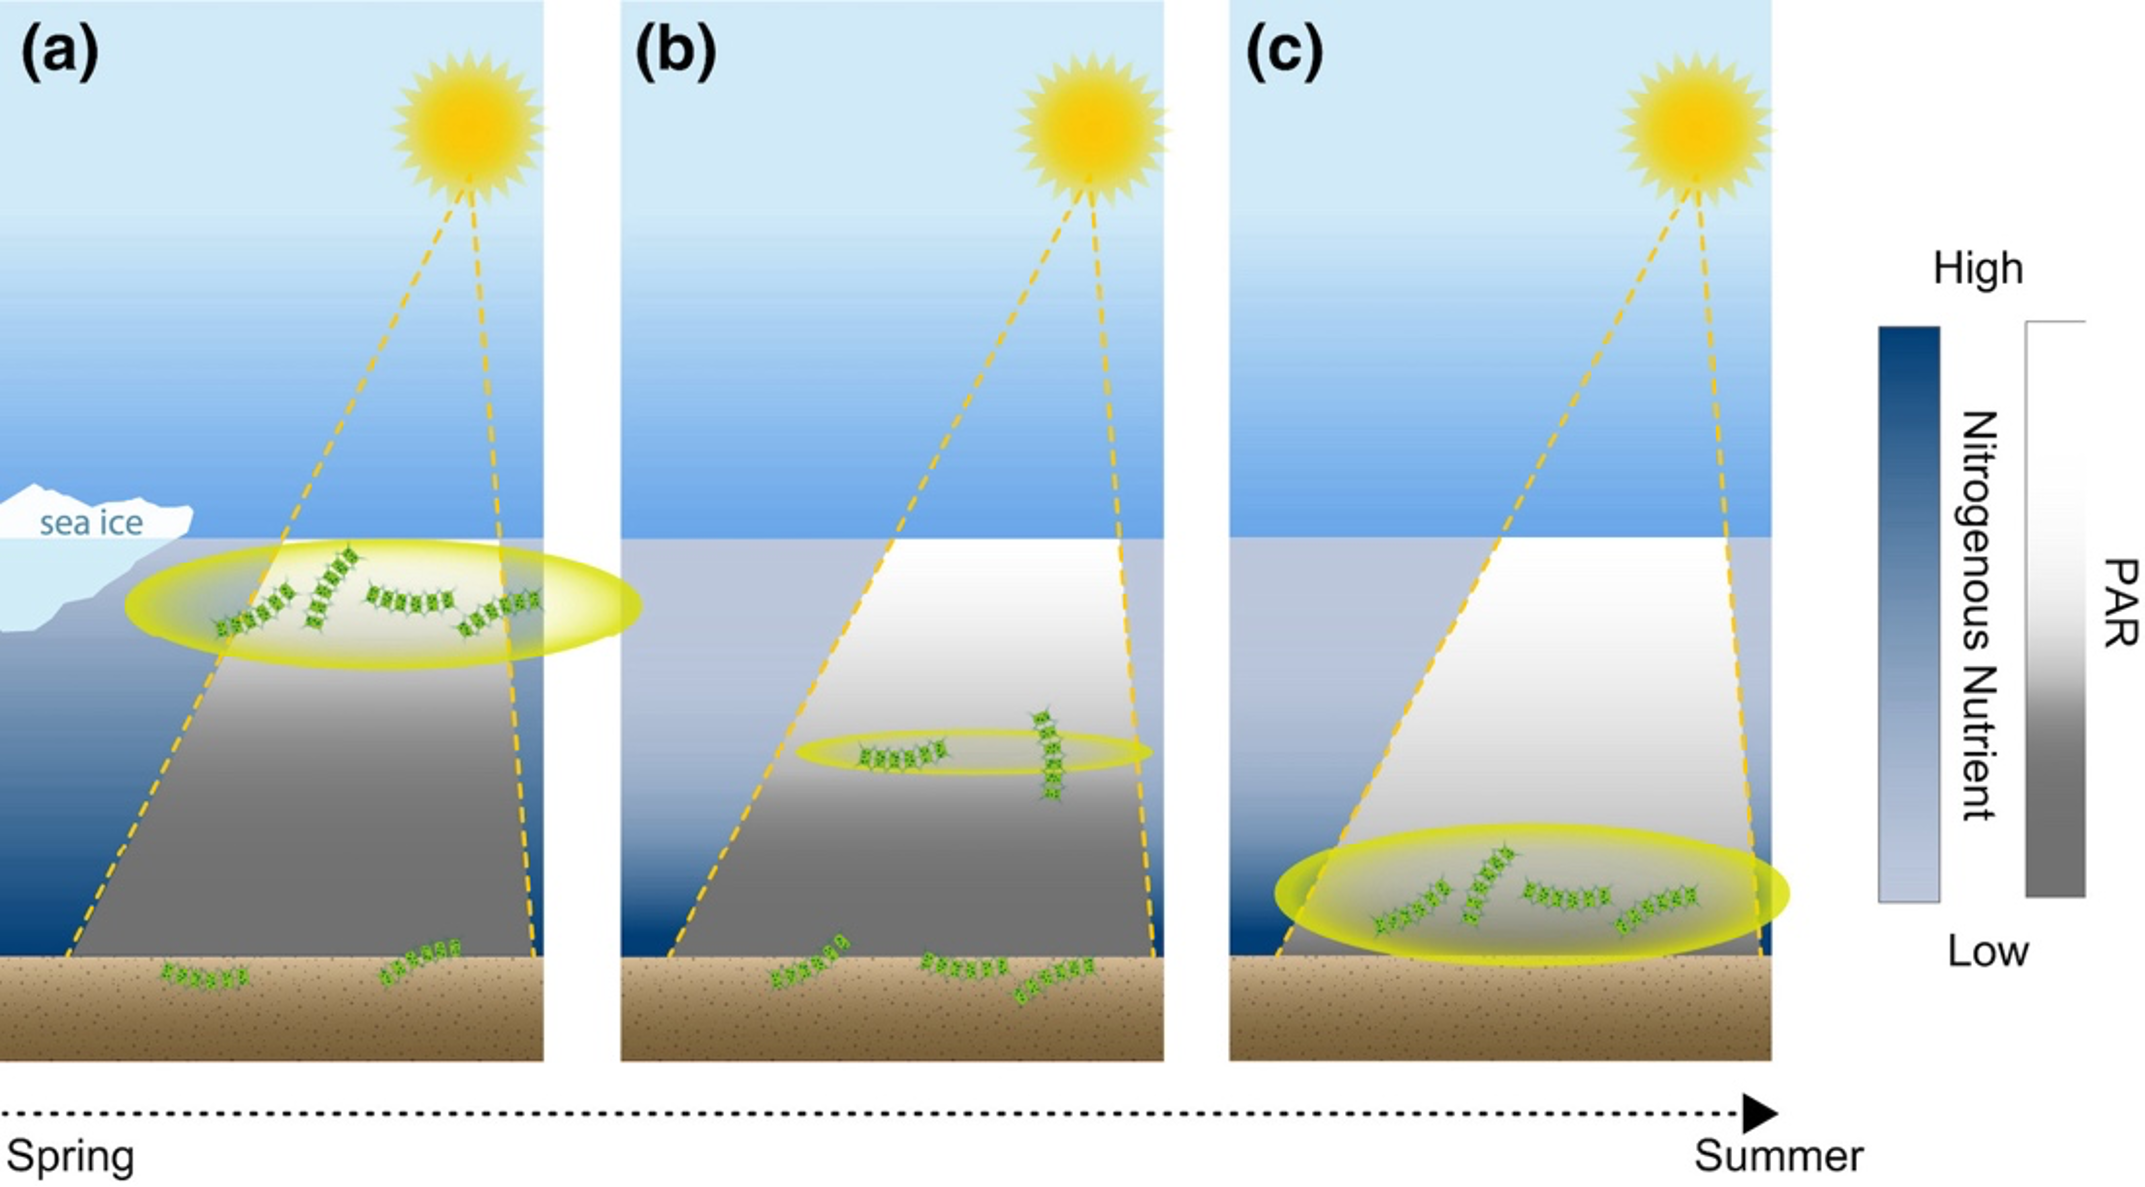
Figure 4. These conceptual models show how the sun stimulates plankton grown at, near the surface, and on the sea floor. When coastal areas are ice free in early to mid-summer, more light penetrates through the water column to feed a plankton bloom at deeper depths.
Credit: Shiozaki et al. 2022
High-resolution image
A new study by Shiozaki et al. (2022) reveals that plankton on the seabed in the Arctic Ocean is increasingly in bloom, as longer ice-free periods near the coast allow more light to reach the shallow coastal ocean bottom and stimulate growth (Figure 4). Since this represents an expansion of the area and volume that plankton can thrive, it has implications for bio-productivity in the Arctic food chain and sequestration of carbon by the ocean.
As sunshine returns to the Arctic in spring, it stimulates plankton growth at or near the surface—a typical plankton bloom. However, plankton growth is often limited by the nutrient level in the water column, and in many areas the surface bloom consumes all the nutrients in the top ocean layer. If the shallow coastal areas of the Arctic become ice free in early to mid-summer, more light can penetrate through the water column. This provides energy to plankton that have descended in the water column to depths where there are still abundant nutrients, resulting in a bloom on the sea floor.
The regions where this appears to be occurring are in the Chukchi Sea, but it could potentially occur over wide regions of the Siberian and Alaskan shallow continental shelf.
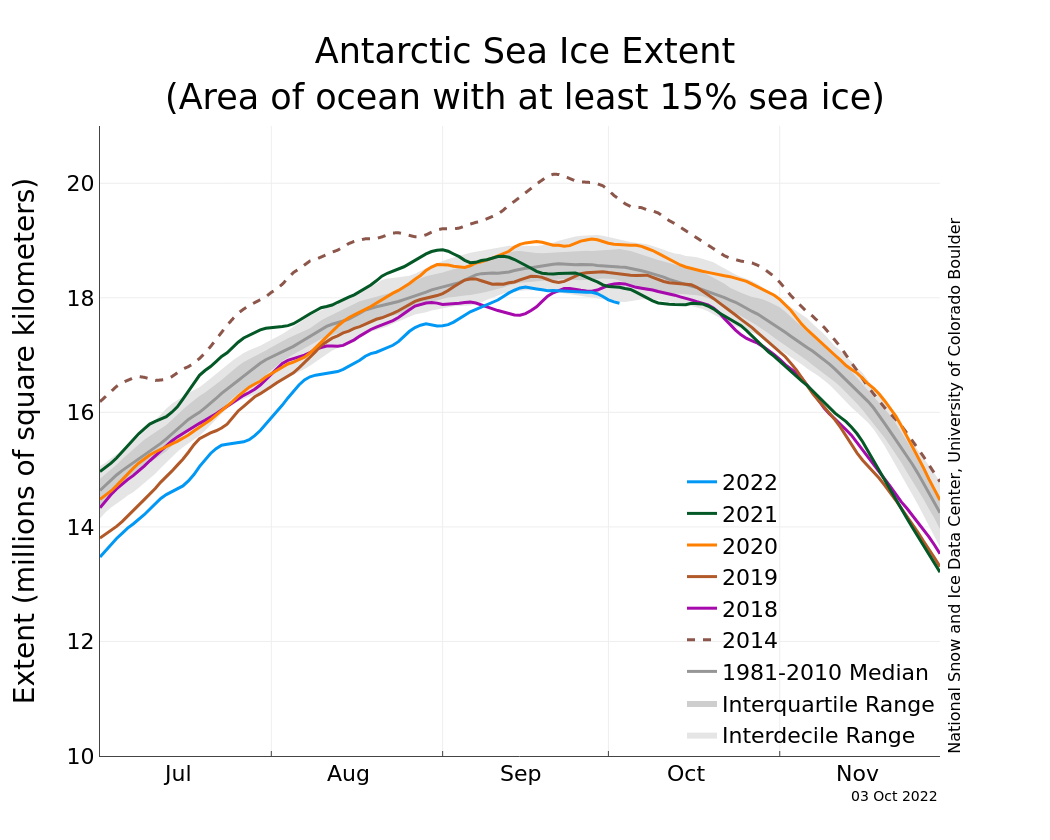
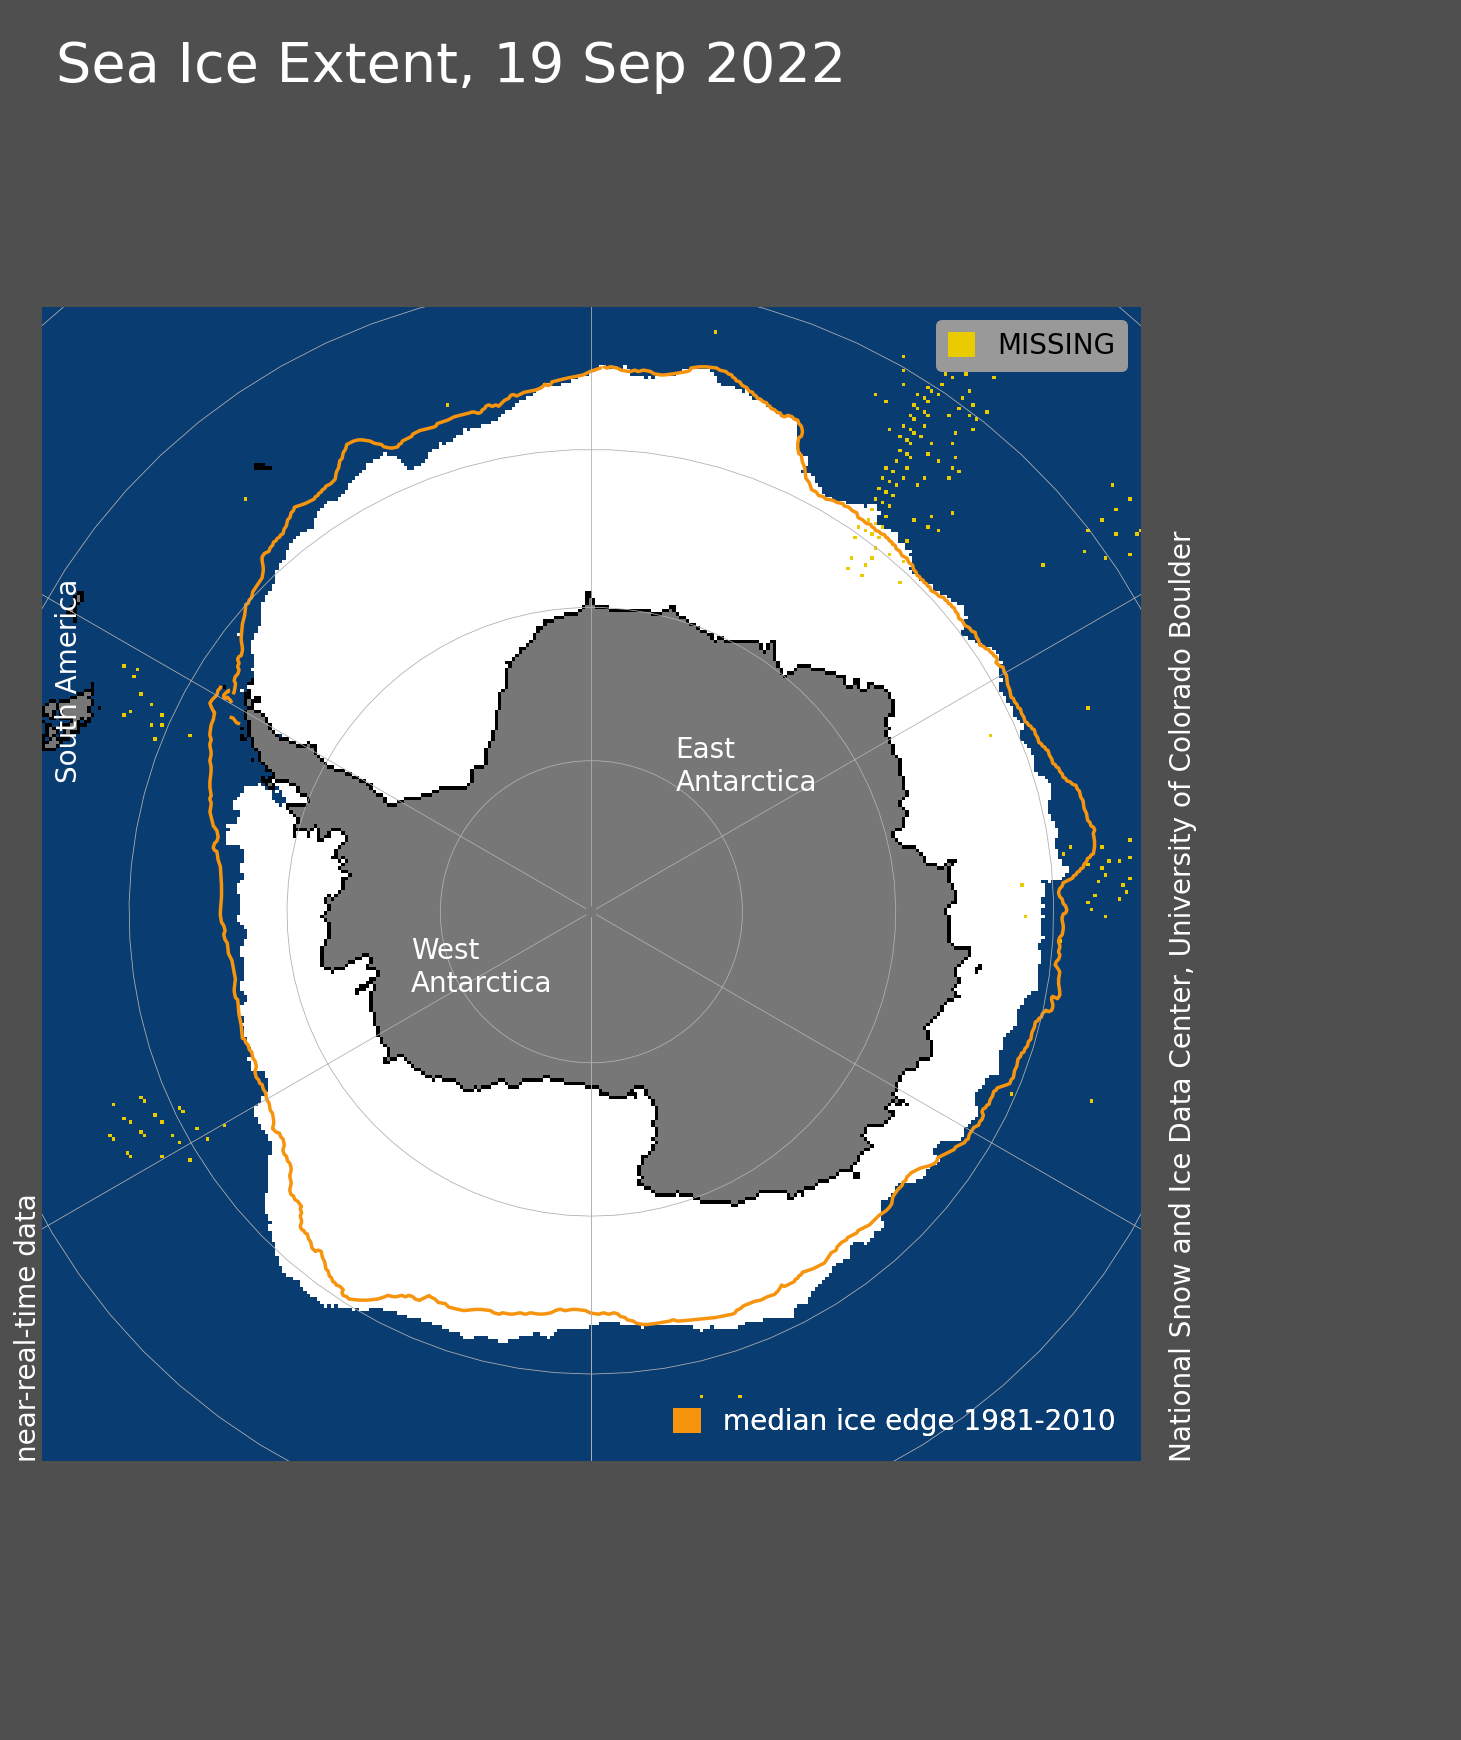
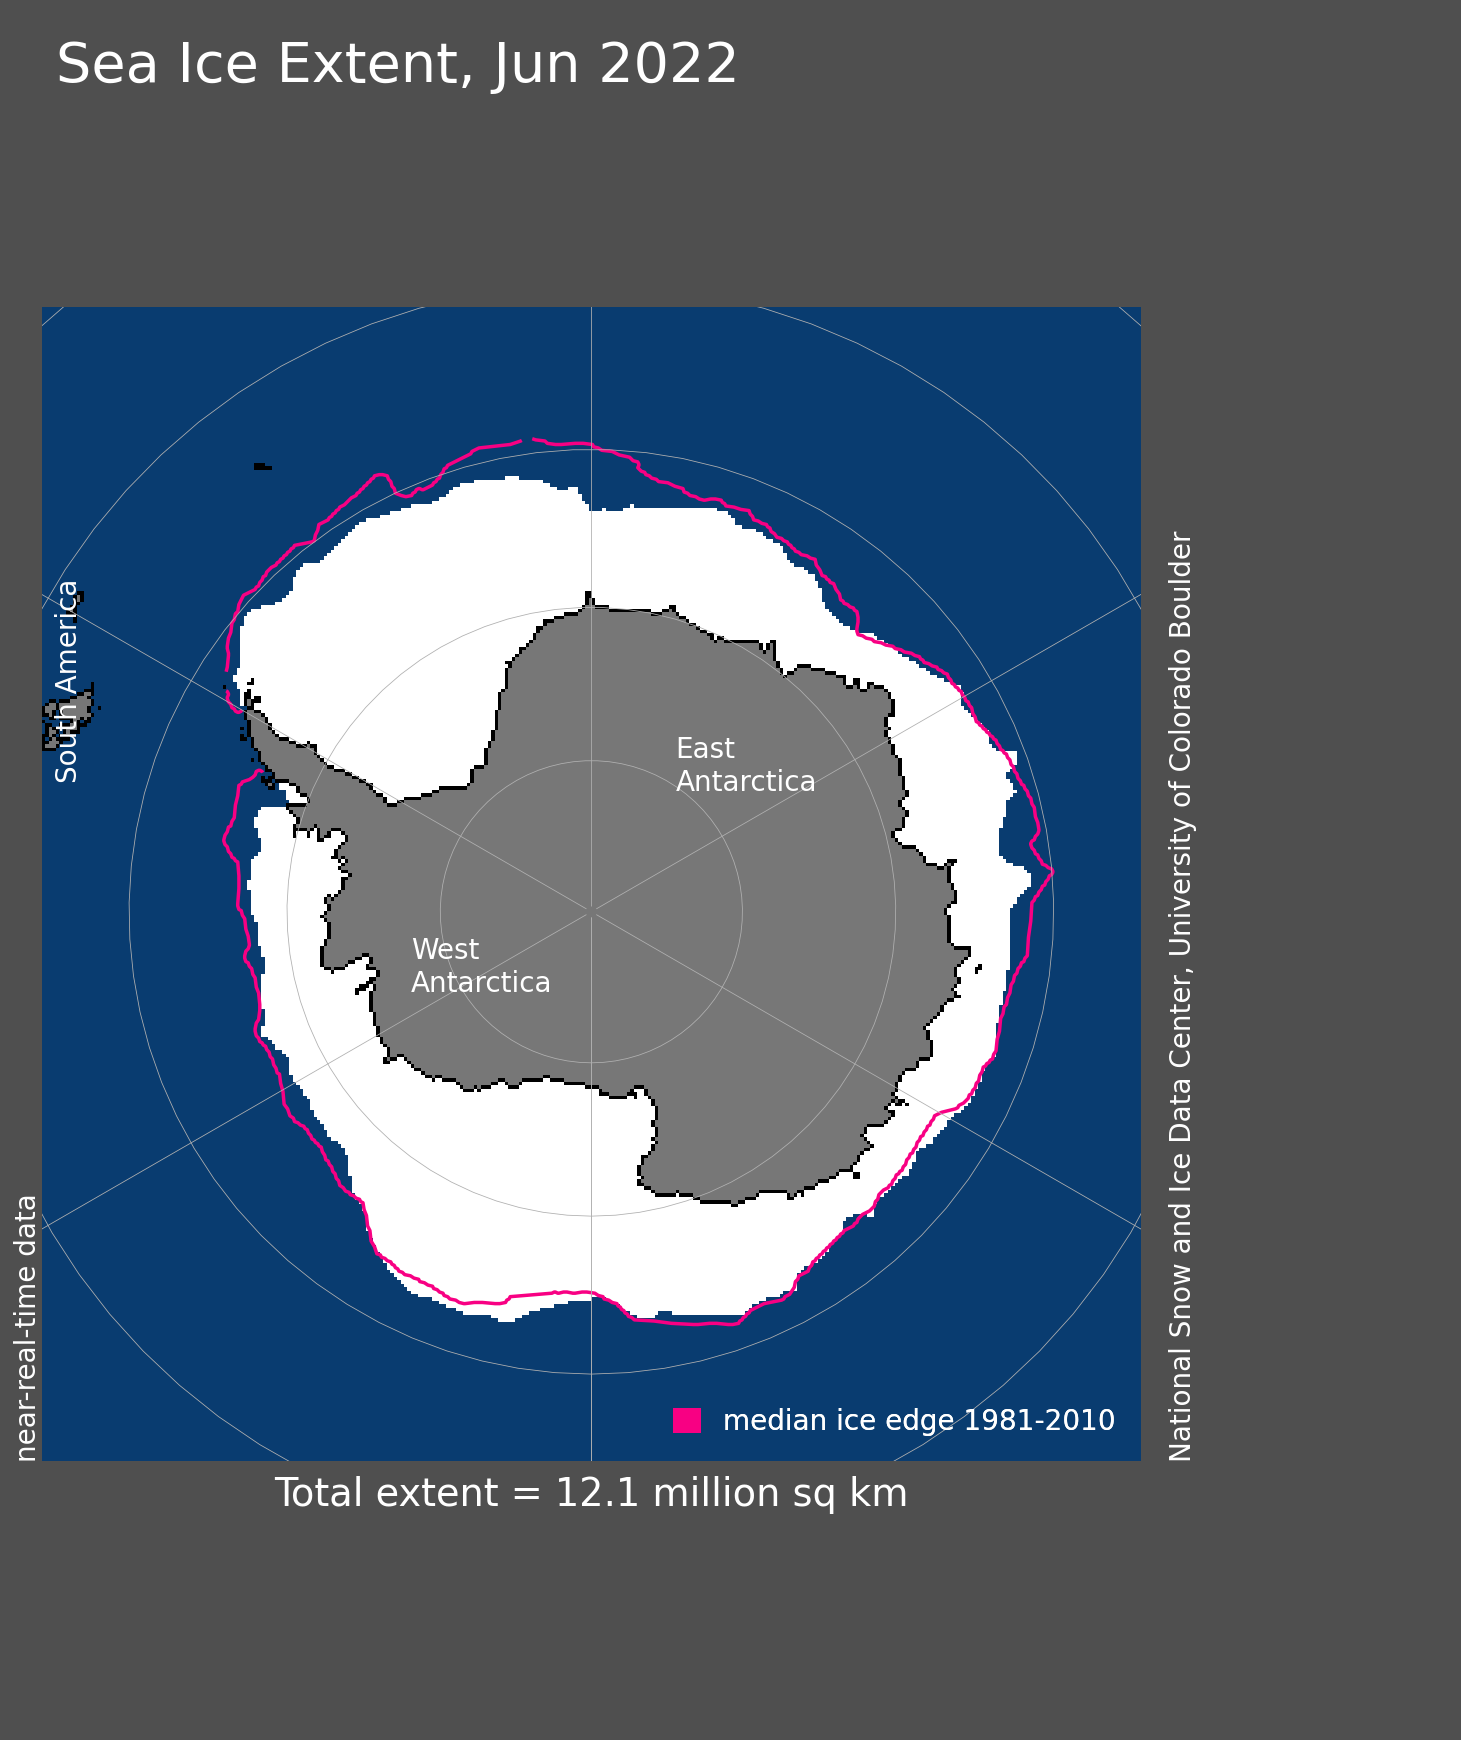
Antarctica’s spring
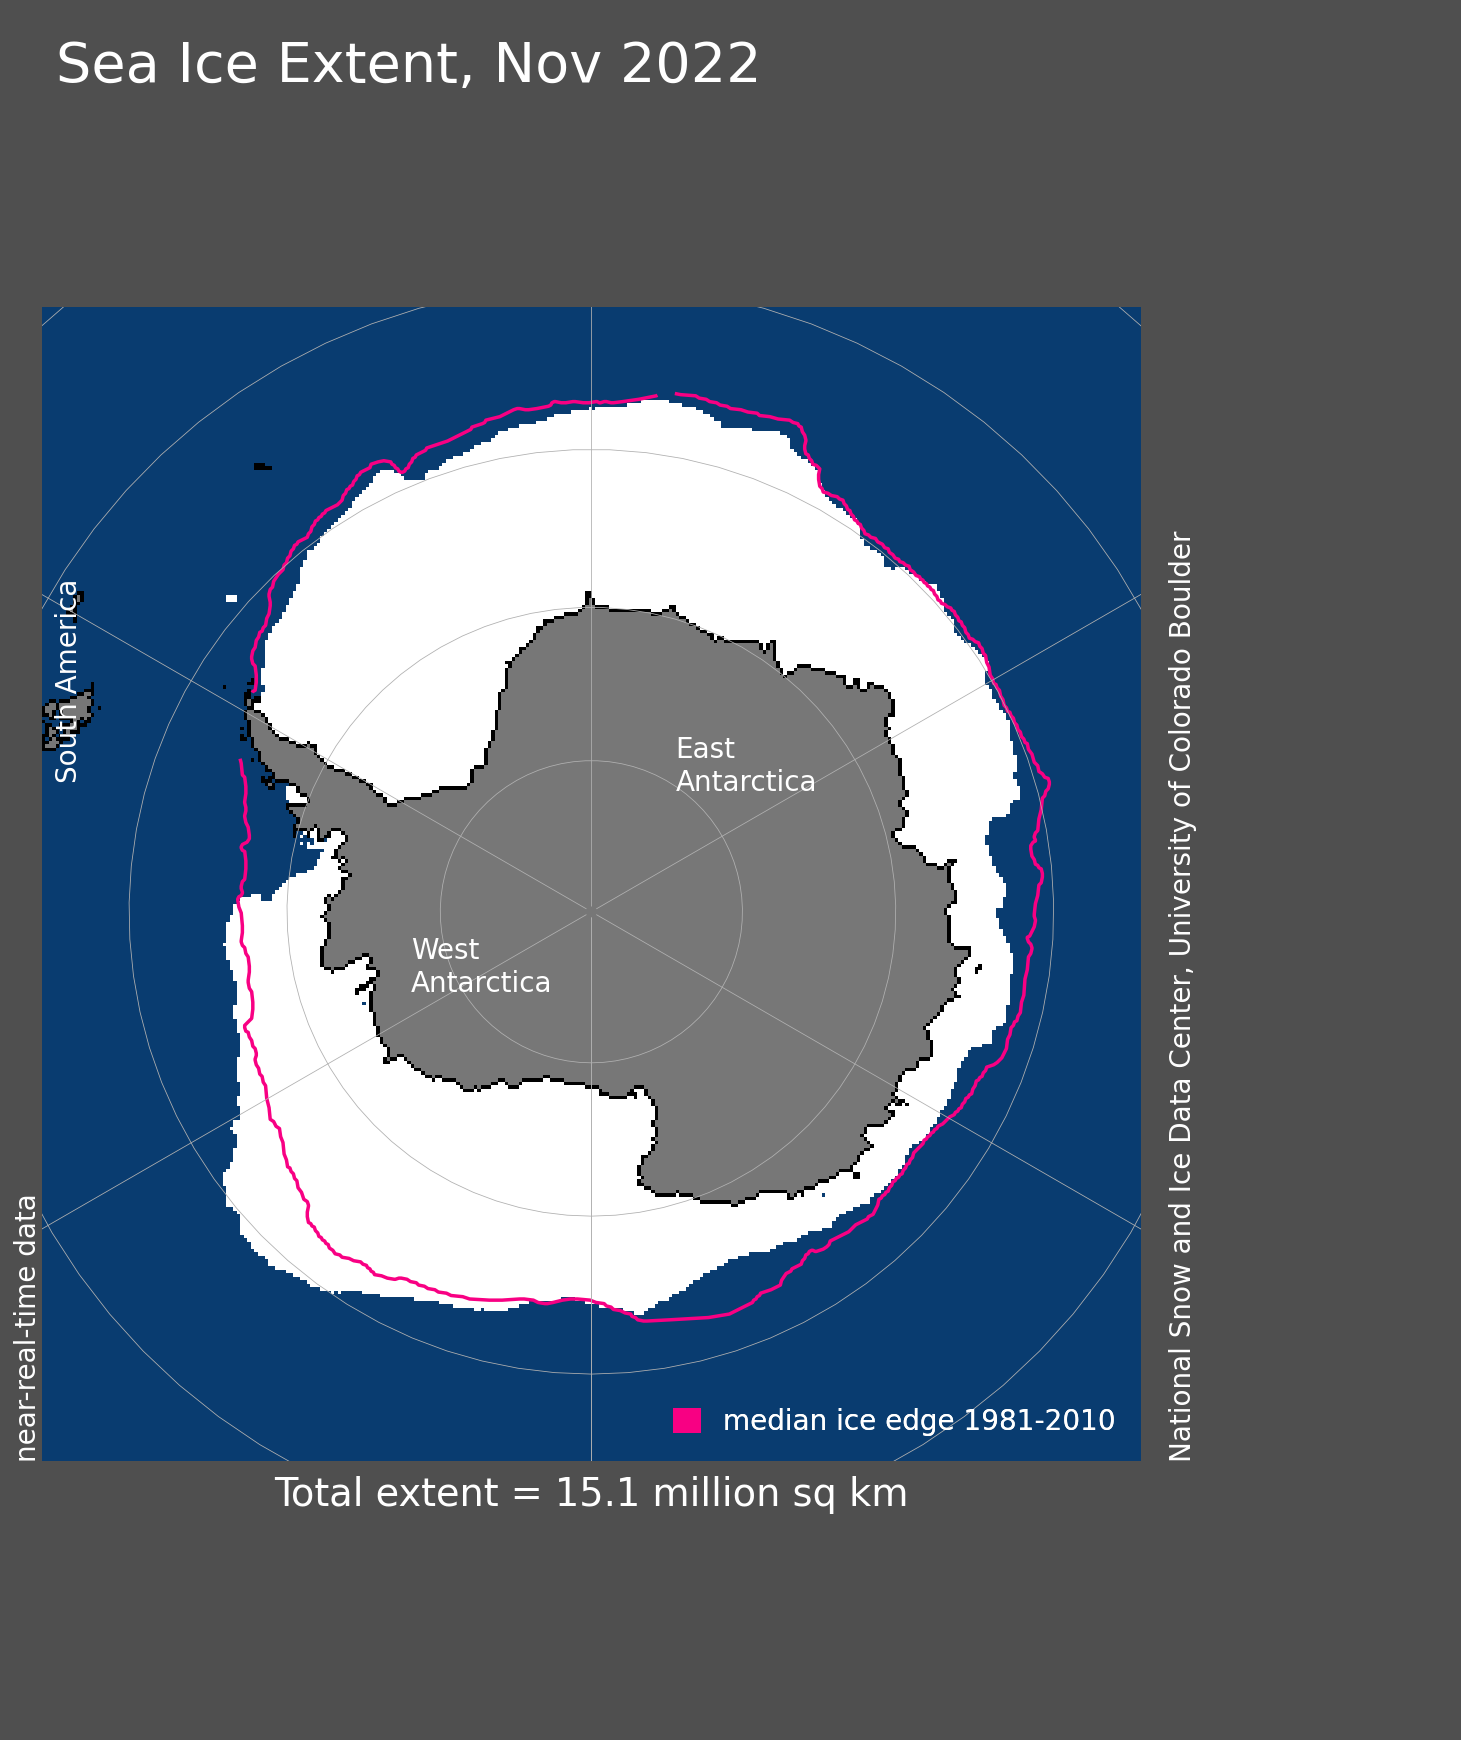
Figure 5. Antarctic sea ice extent for November 2022 was 15.06 million square kilometers (5.81 million square miles). The magenta line shows the 1981 to 2010 average extent for that month. Sea Ice Index data. About the data
Credit: National Snow and Ice Data Center
High-resolution image
Antarctic sea ice is declining rapidly now in response to seasonal warming. Sea ice extent is particularly low in the Bellingshausen Sea, where much of the eastern portion adjacent to the Antarctic Peninsula has been ice free for much of November. By sharp contrast, ice extent in the Amundsen Sea just west of the Bellingshausen, has extended much farther to the north than is typical and is the one area of the Antarctic sea ice that has above-average ice extent.
This is explained by the sea level pressure pattern. A strong low over much of the Amundsen Sea and eastern Ross Sea has driven a clockwise air circulation that has brought warm air from the north onto the western Peninsula region, and cold air from the continental ice sheet northward in the Amundsen Sea.
This low-pressure region is a well-known feature of Antarctica’s climate, and its strength is often measured by a climate index called the Antarctic Oscillation (AAO). The AAO index has been strongly positive for the entire month of November, indicating especially strong low pressure in the Amundsen Sea. In fact, the index has been generally positive for the entire year, and has become more positive over the past several decades.
Further reading
Shiozaki, T., A. Fujiwara, K. Sugie, K., S. Nishino, A. Makabe, and N. Harada. 2022. Bottom‐associated phytoplankton bloom and its expansion in the Arctic Ocean. Global Change Biology, 28(24), 7286-7295, doi:10.1111/gcb.16421.