Daily extent of Arctic sea ice for December 2022 remained well below average for the entire month; at the end of the month, extent stood at fourth lowest in the satellite record. The average extent for the month ended up as seventh lowest in the satellite record. Antarctic extent is declining much faster than average as austral summer takes hold and is setting record low daily ice extents for the satellite era as of December 22. As such, global sea ice extent is well below average.
Overview of conditions
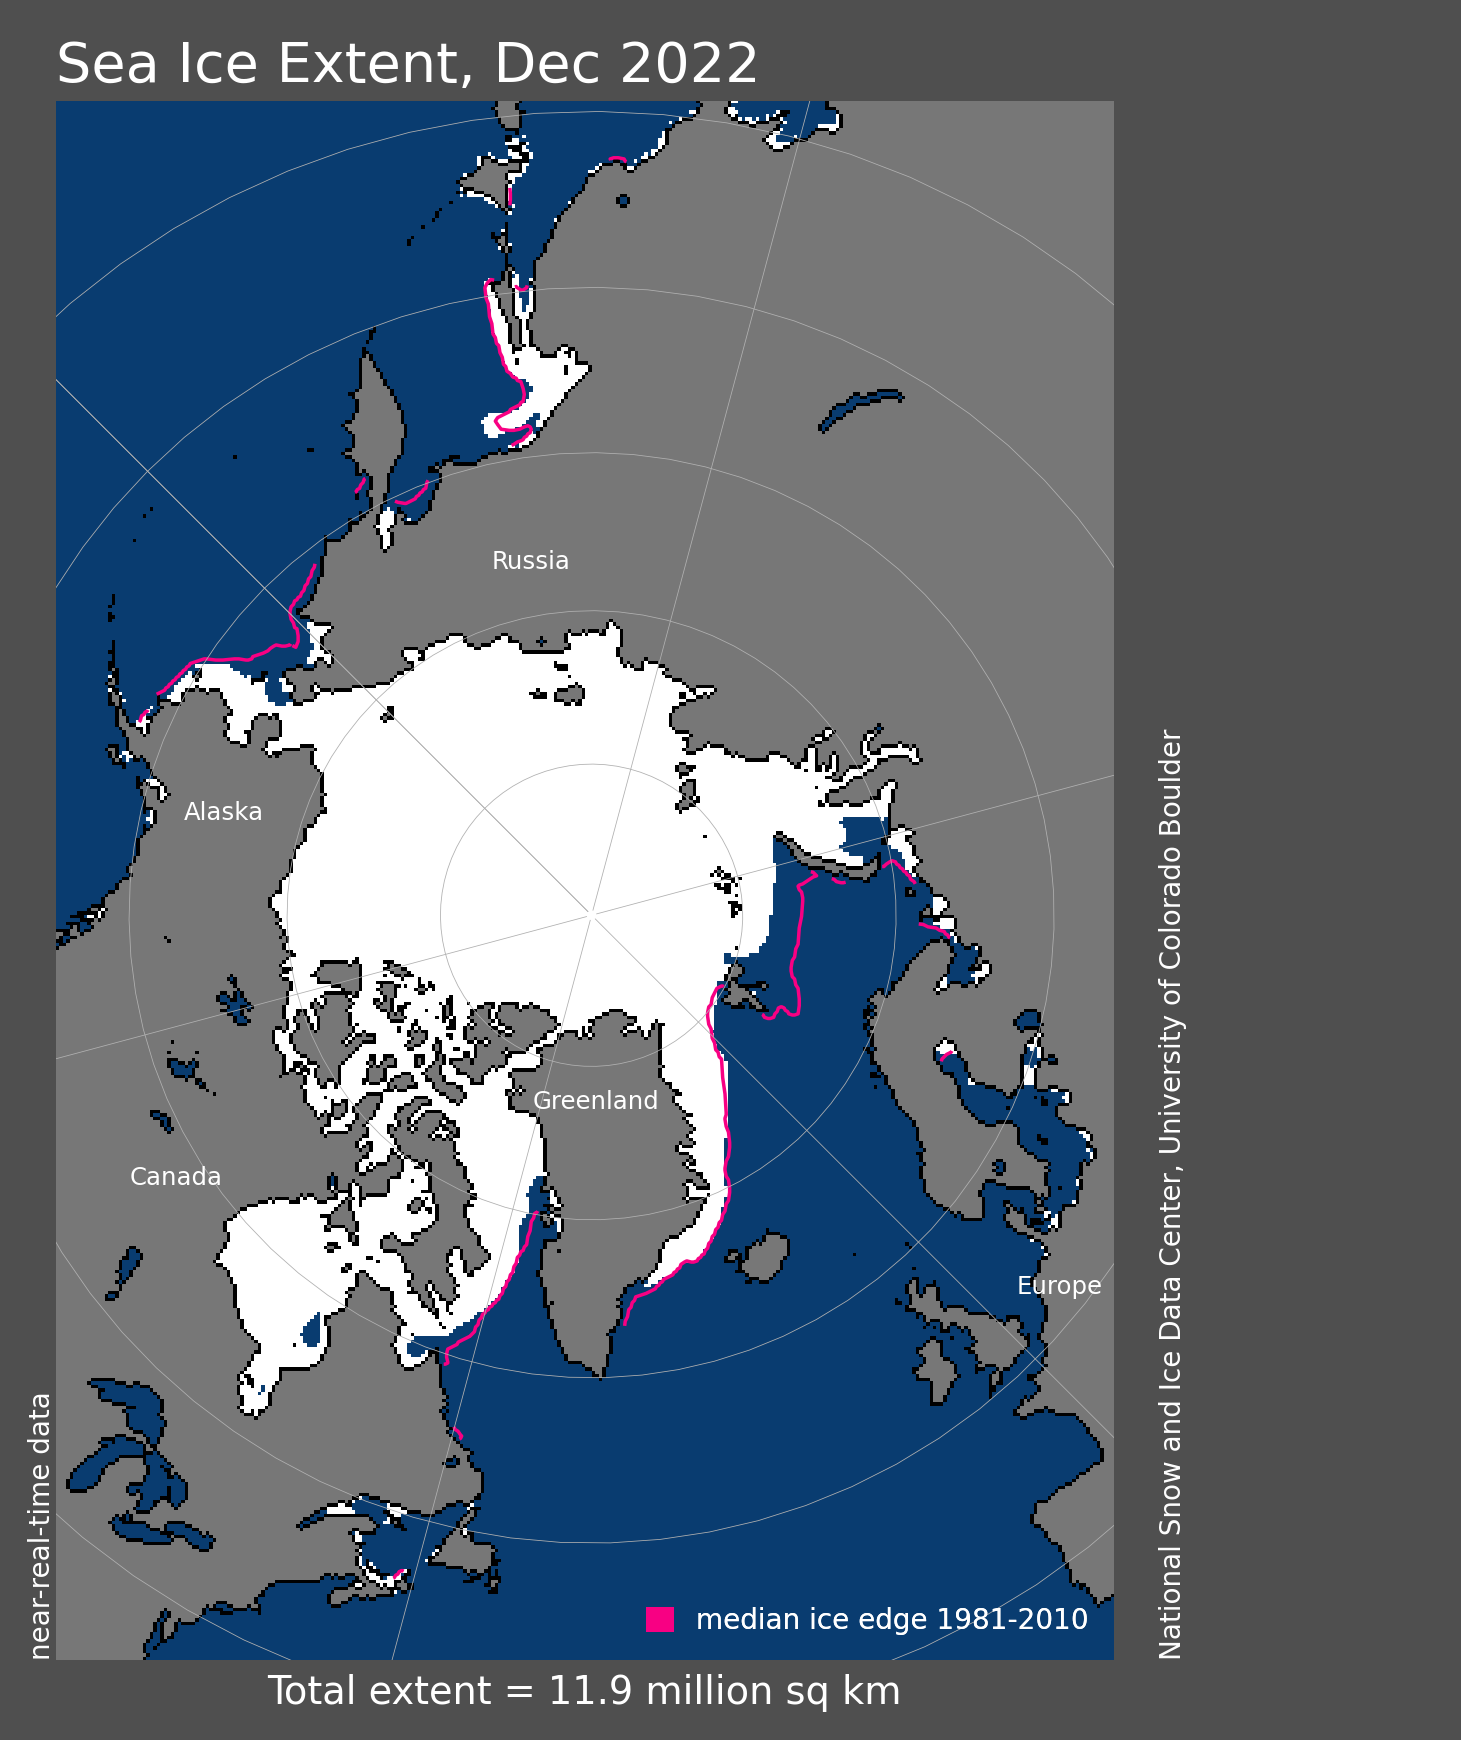
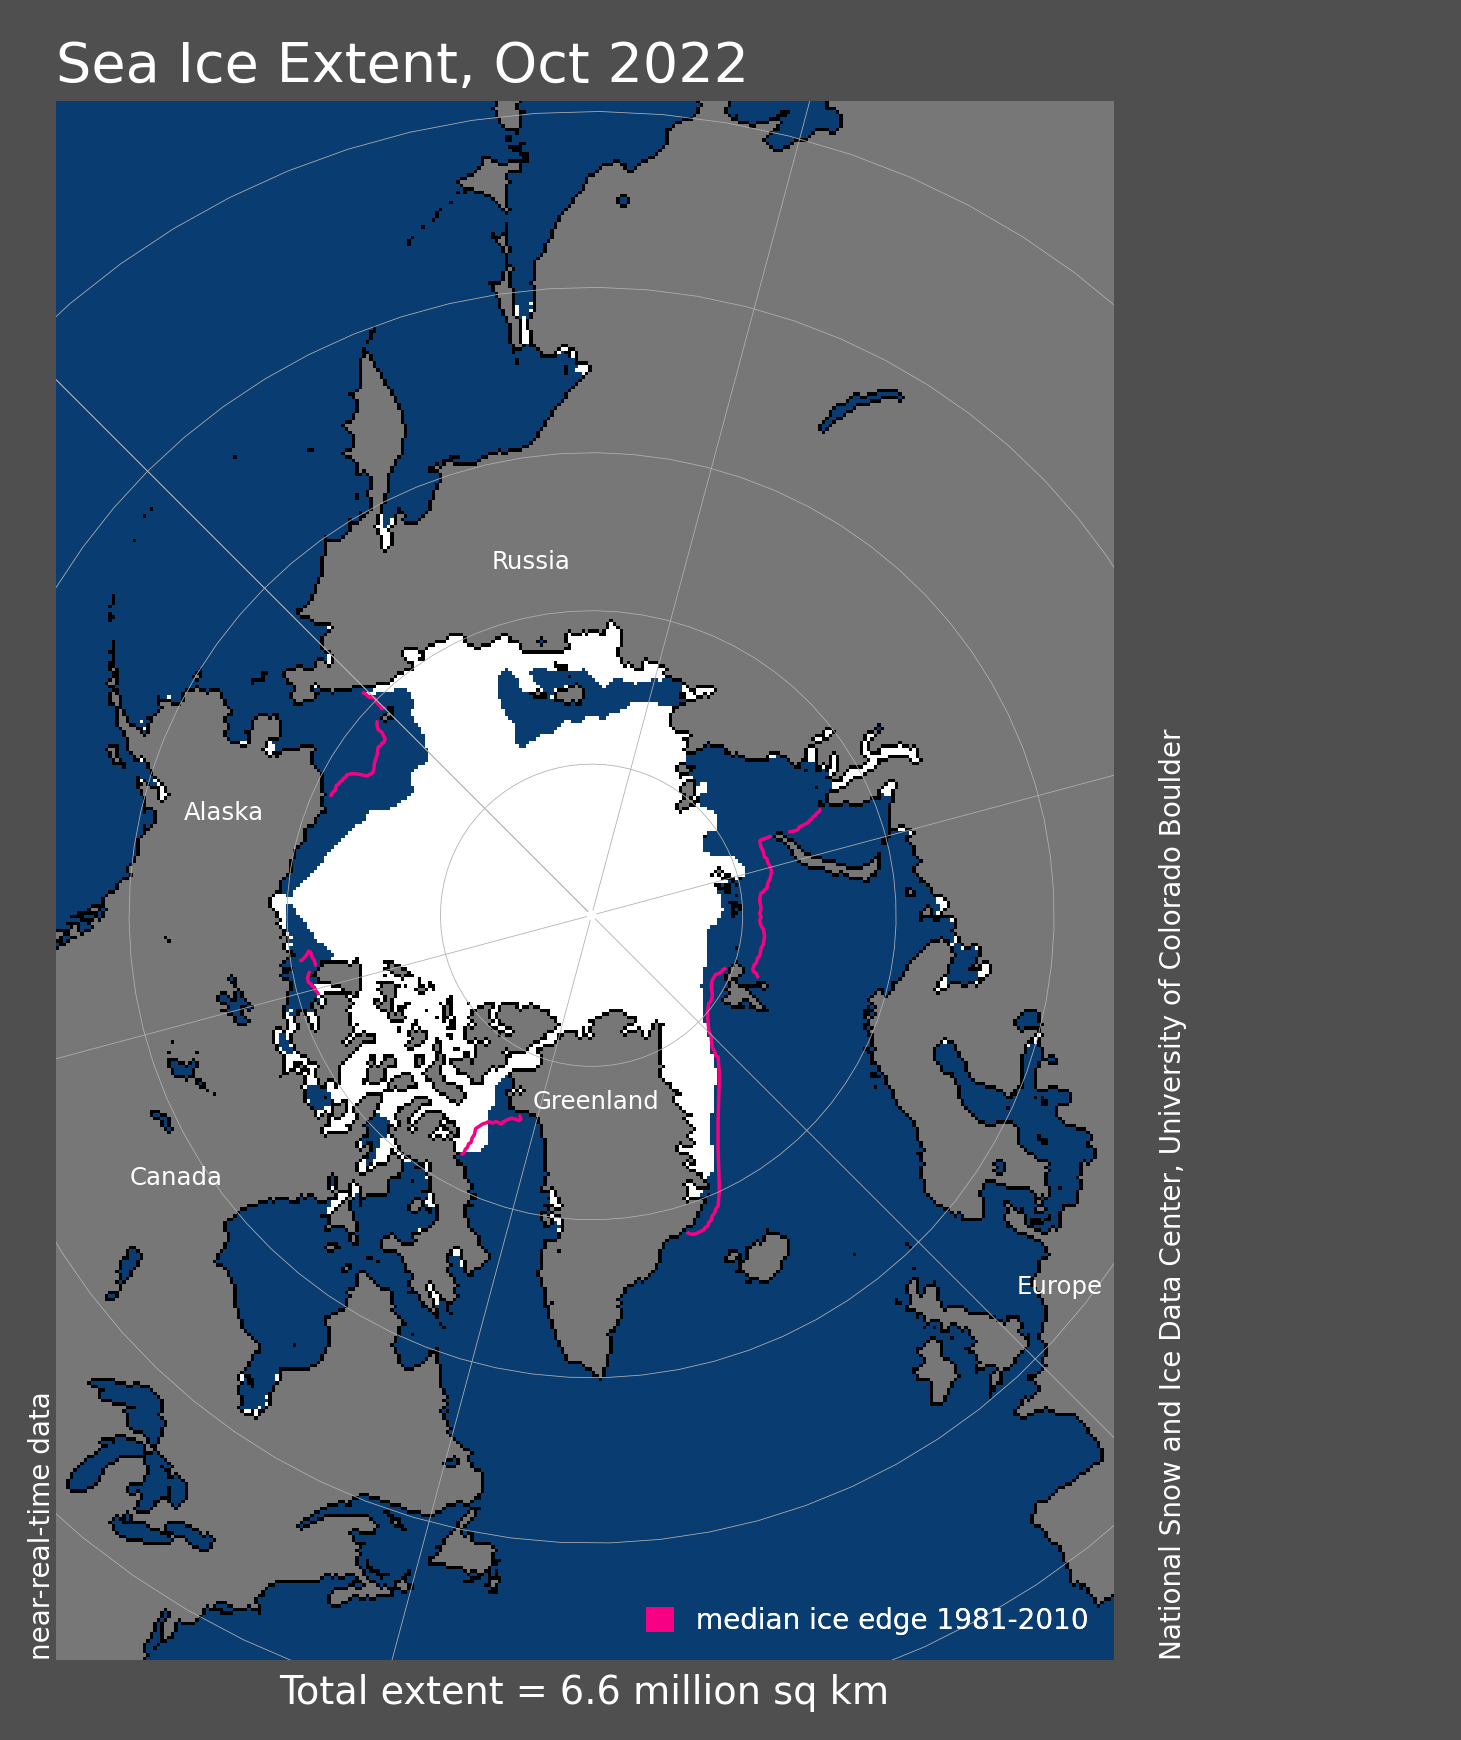
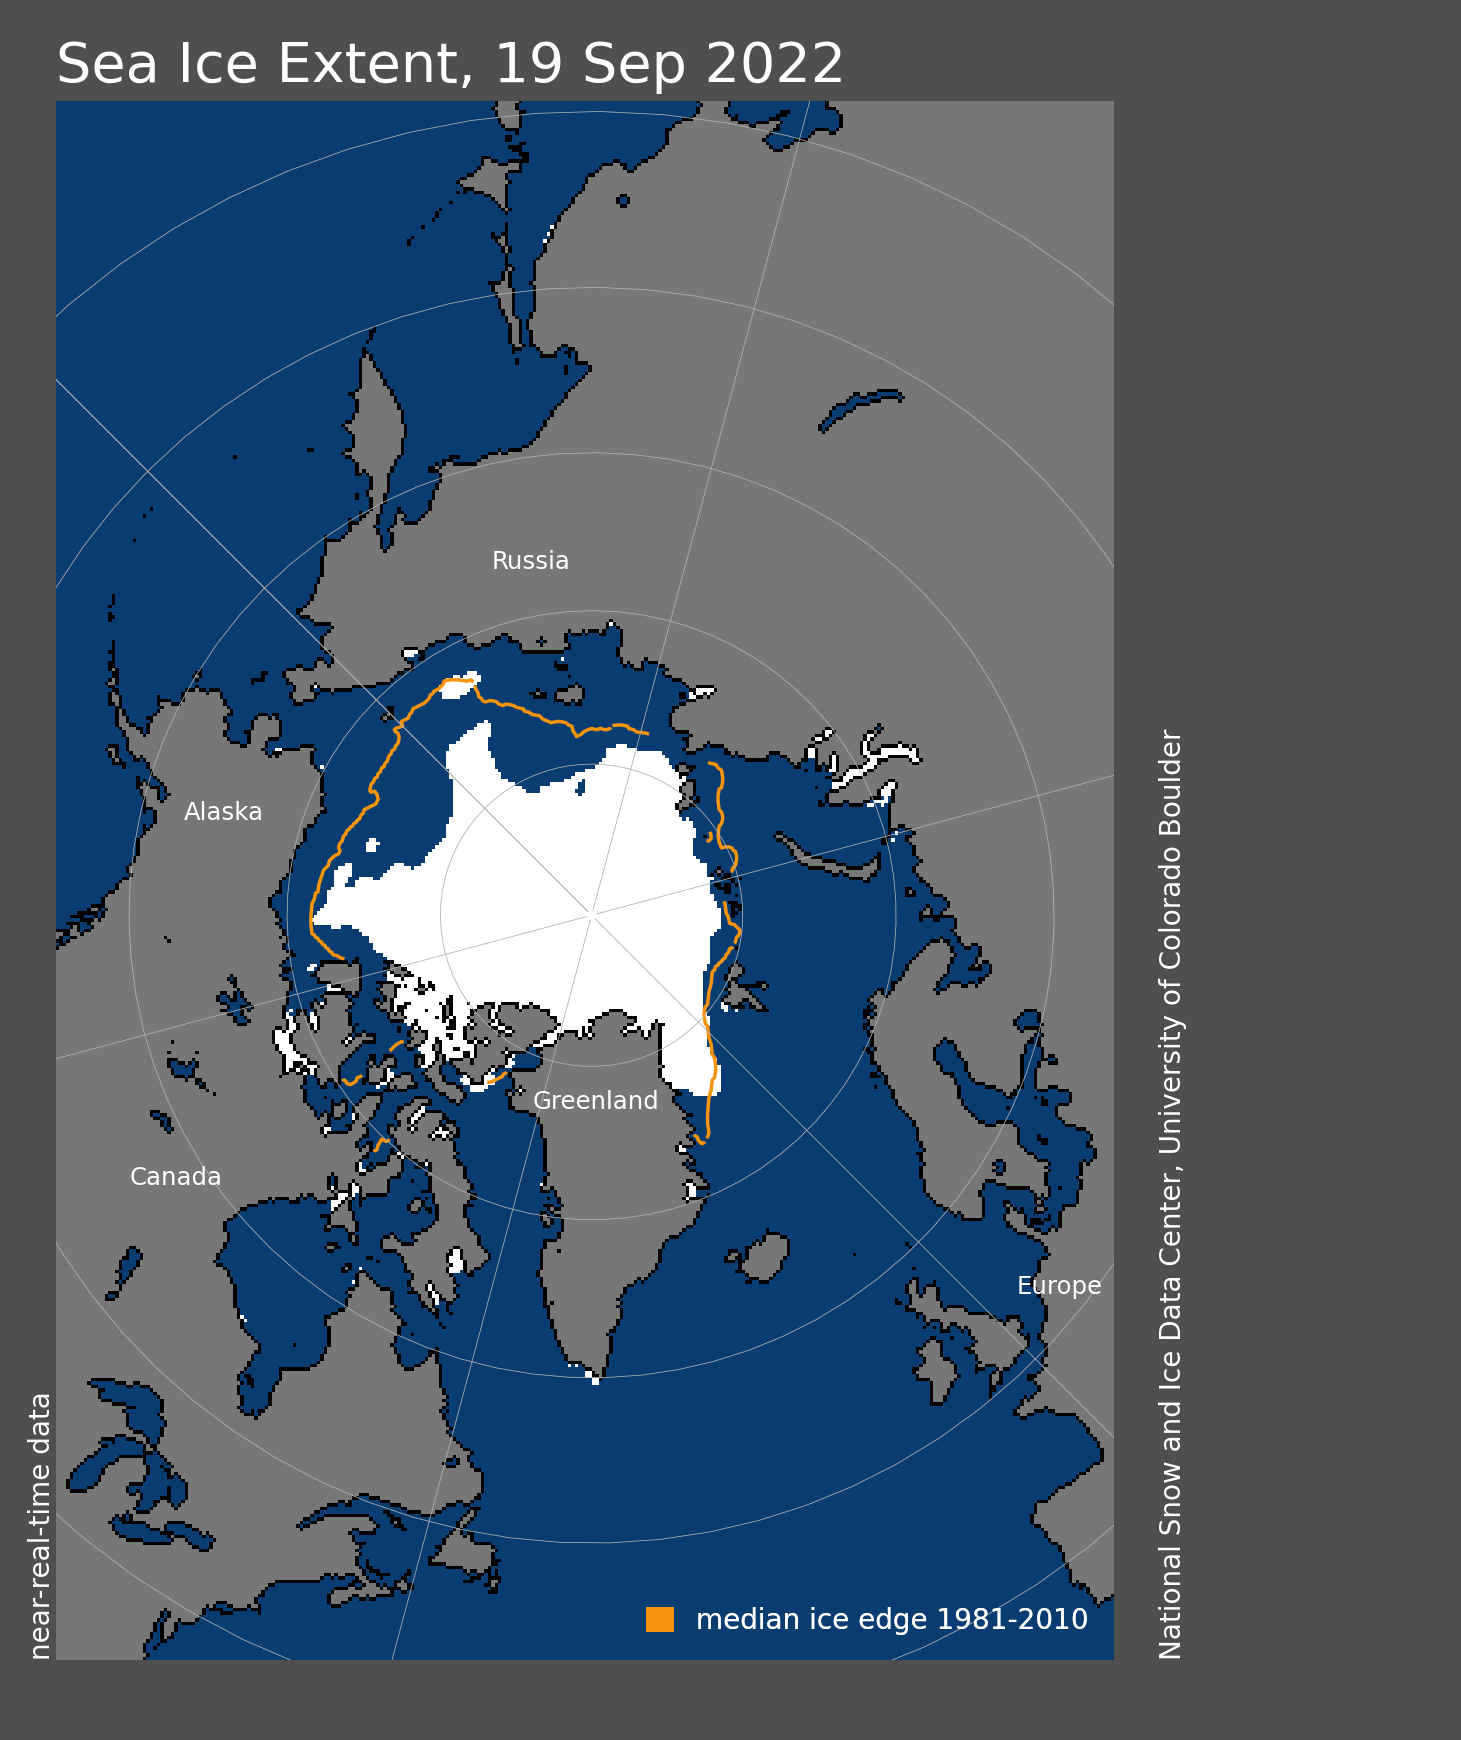
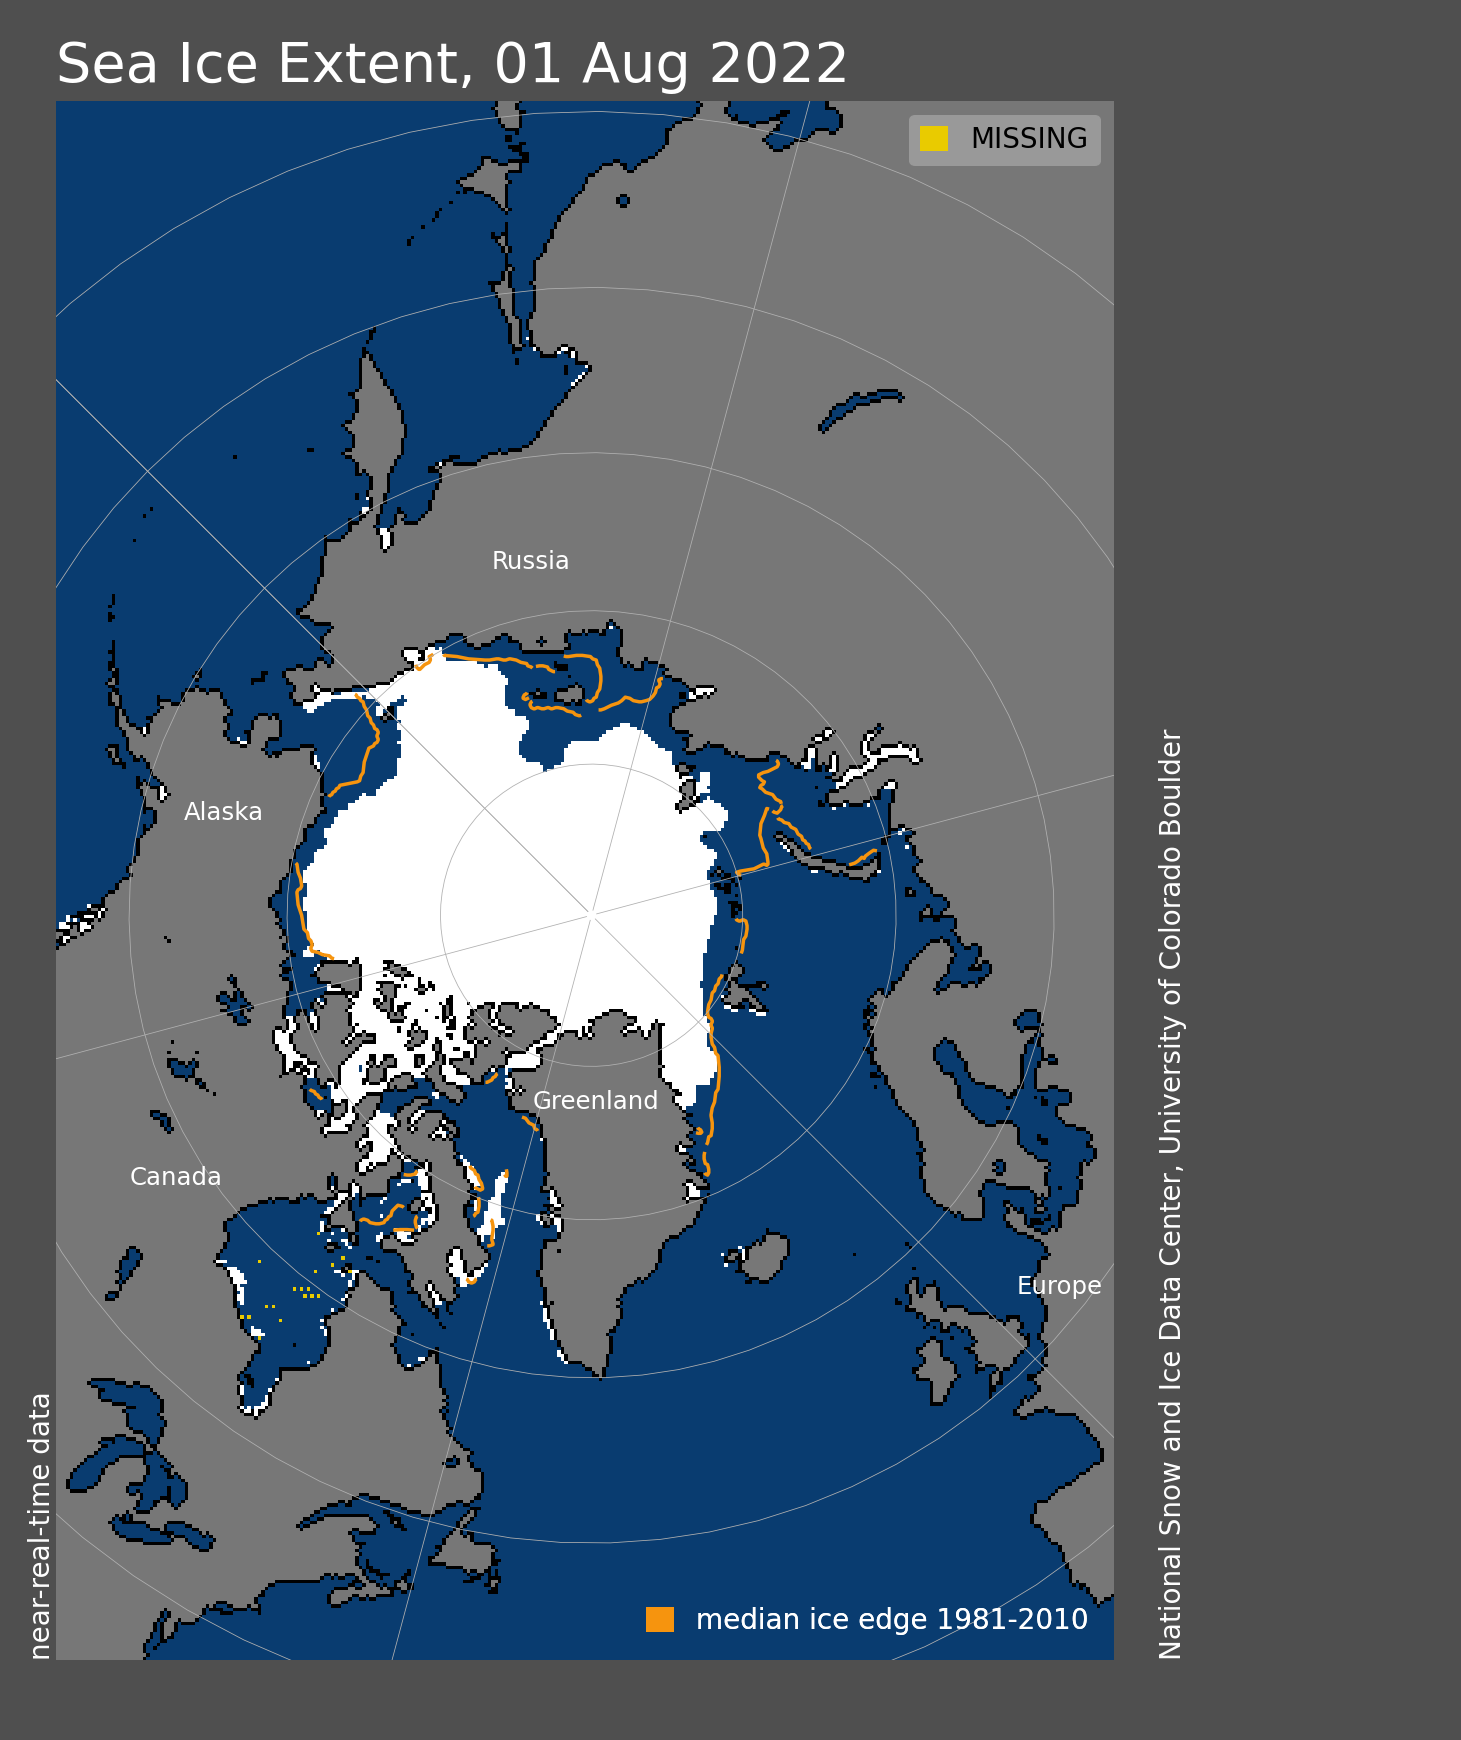
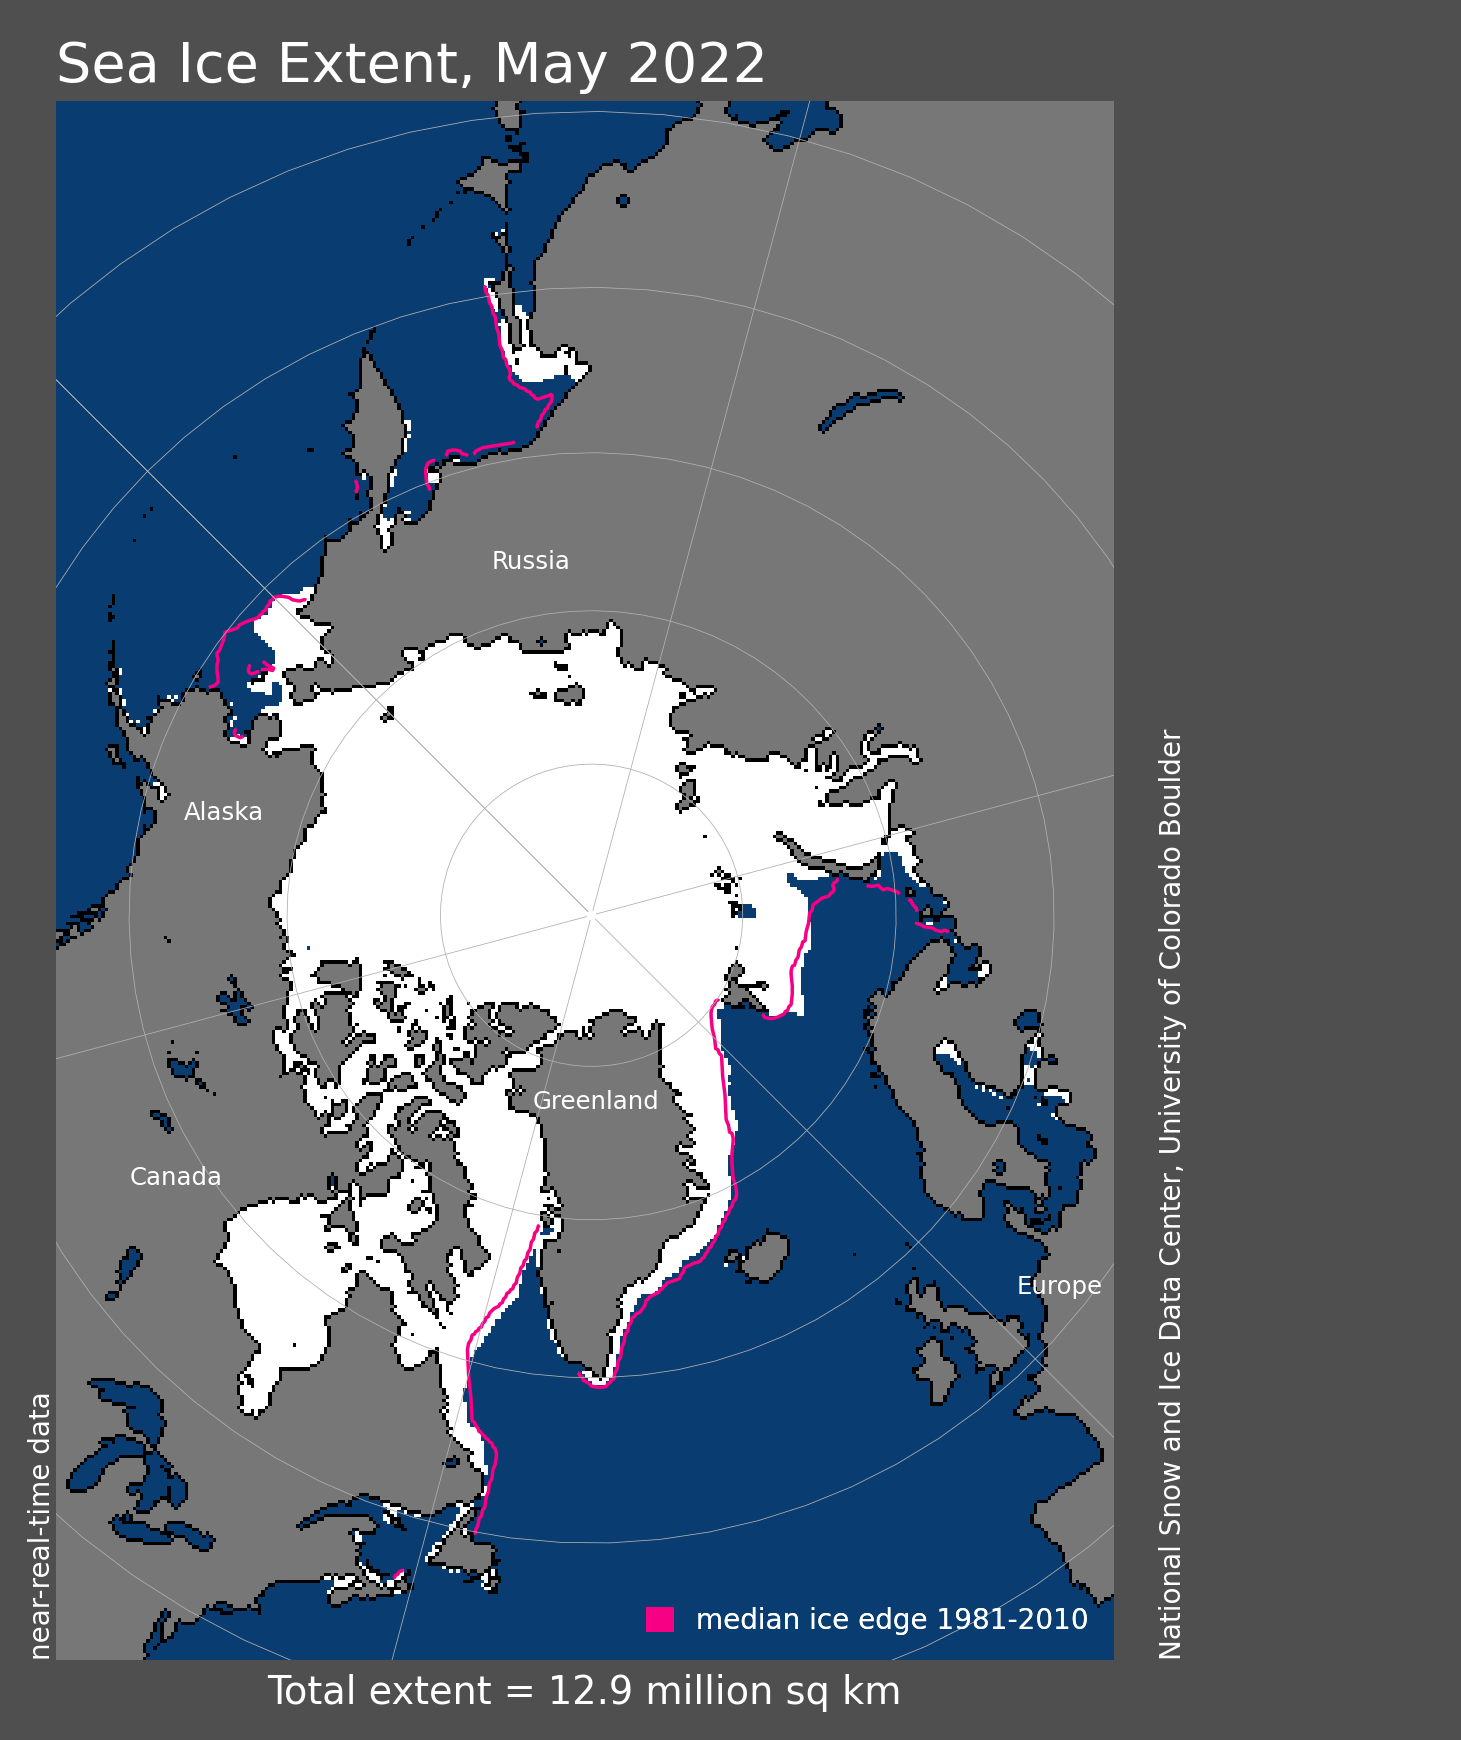
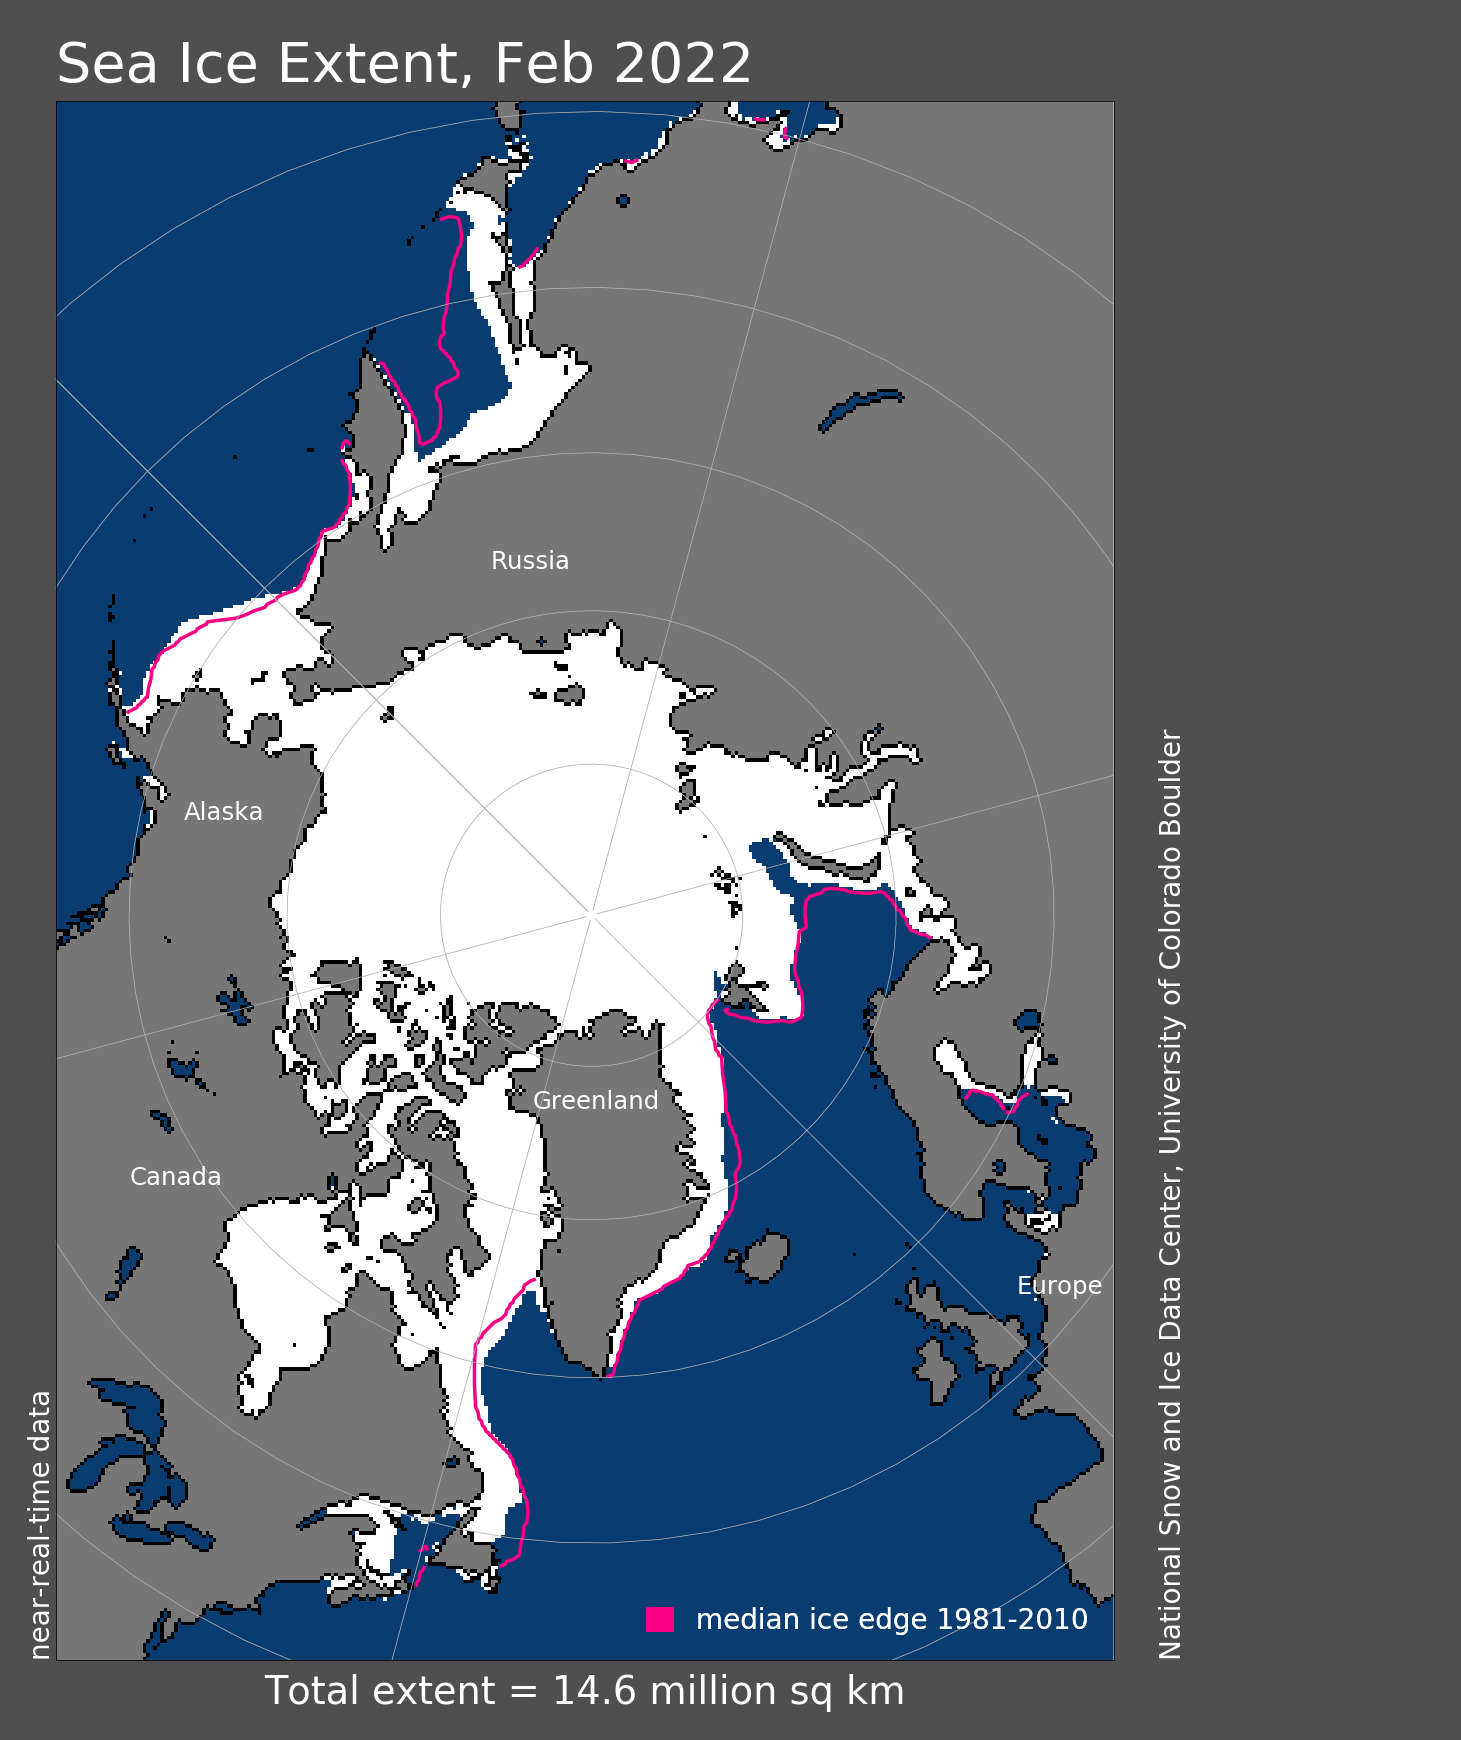
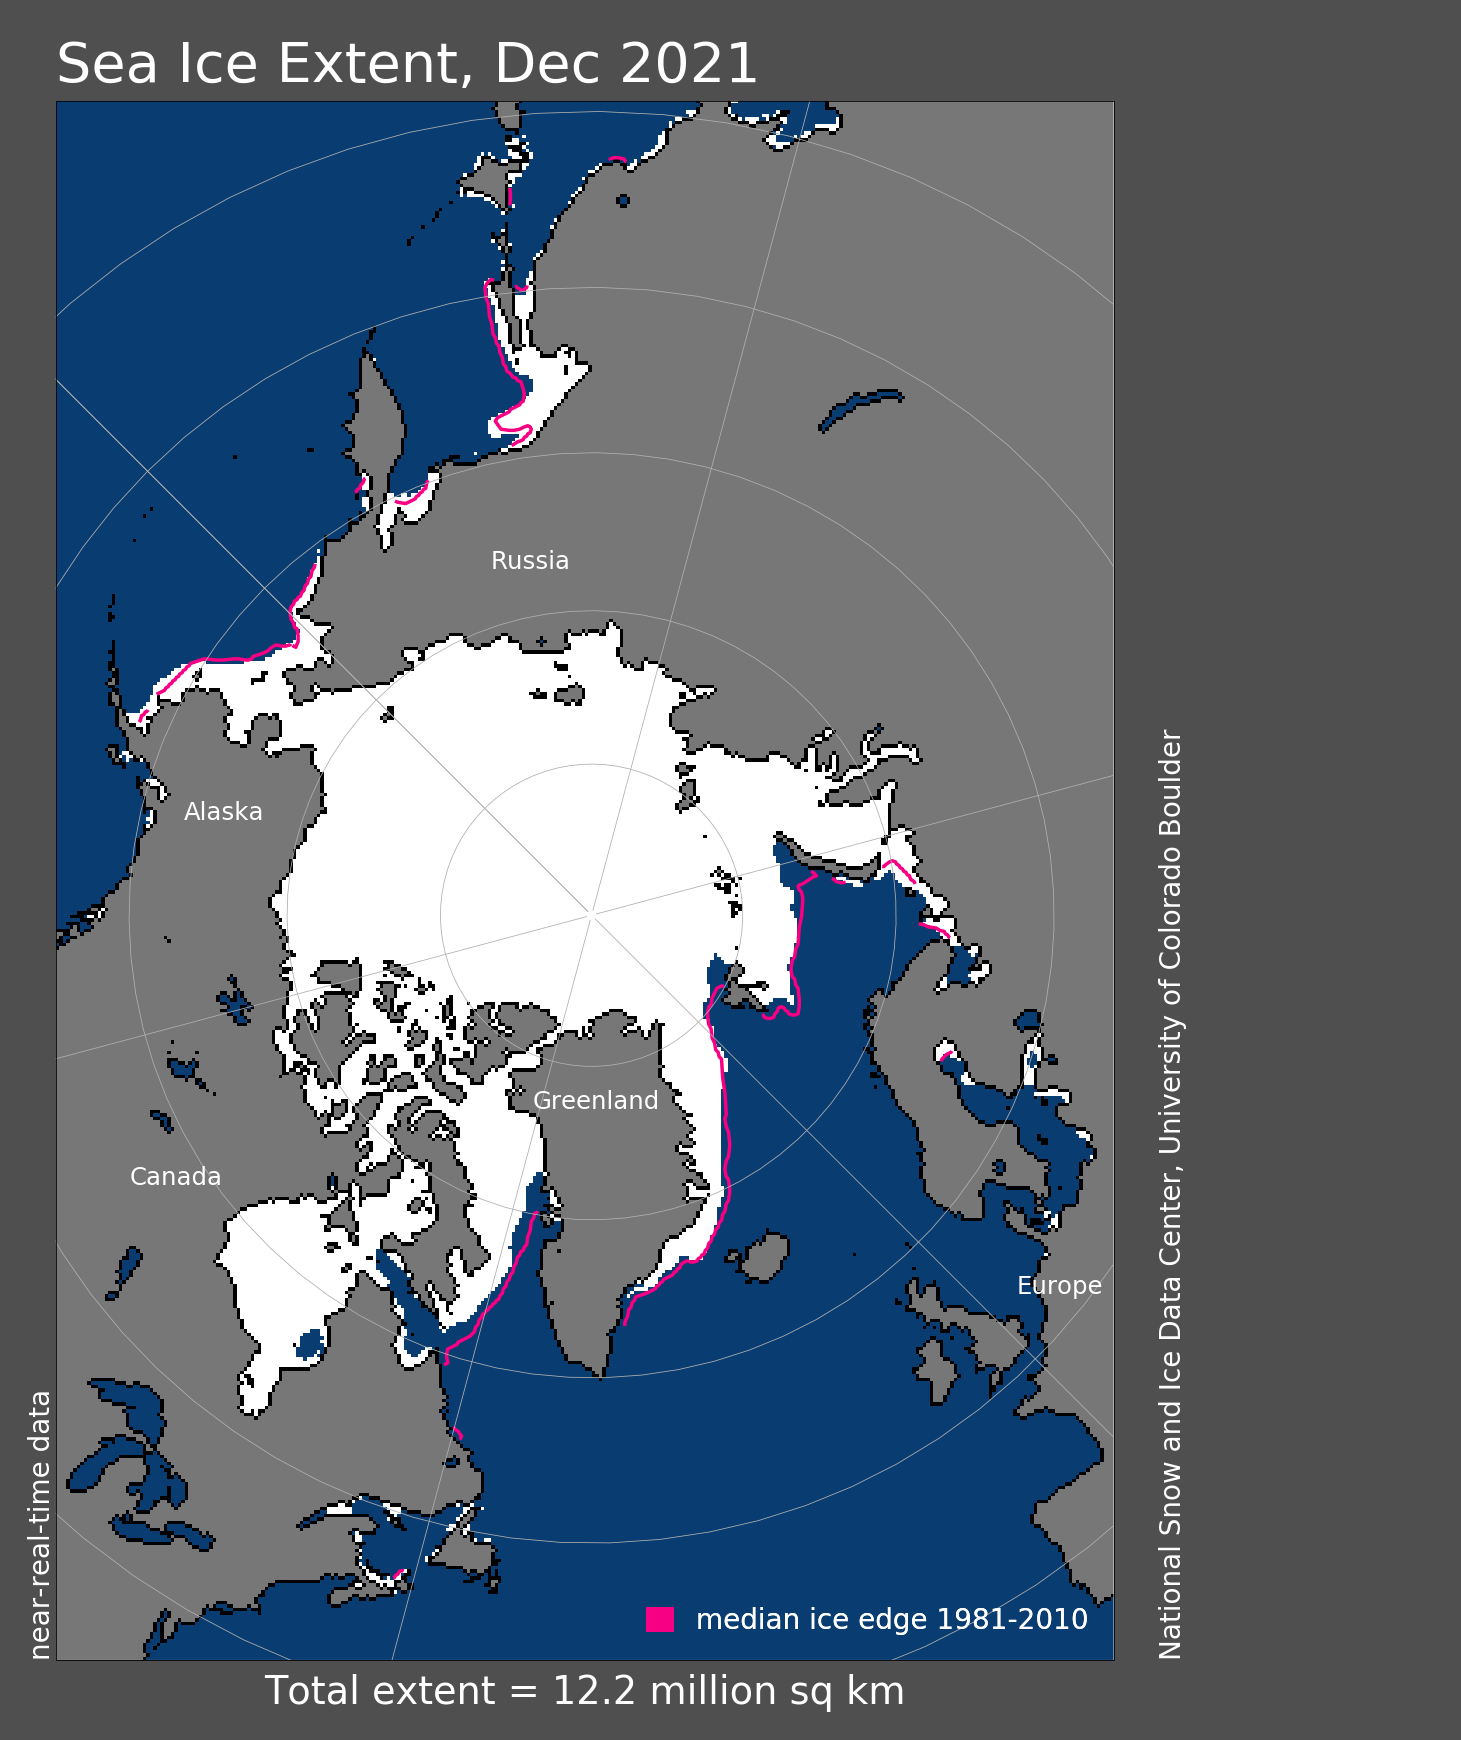
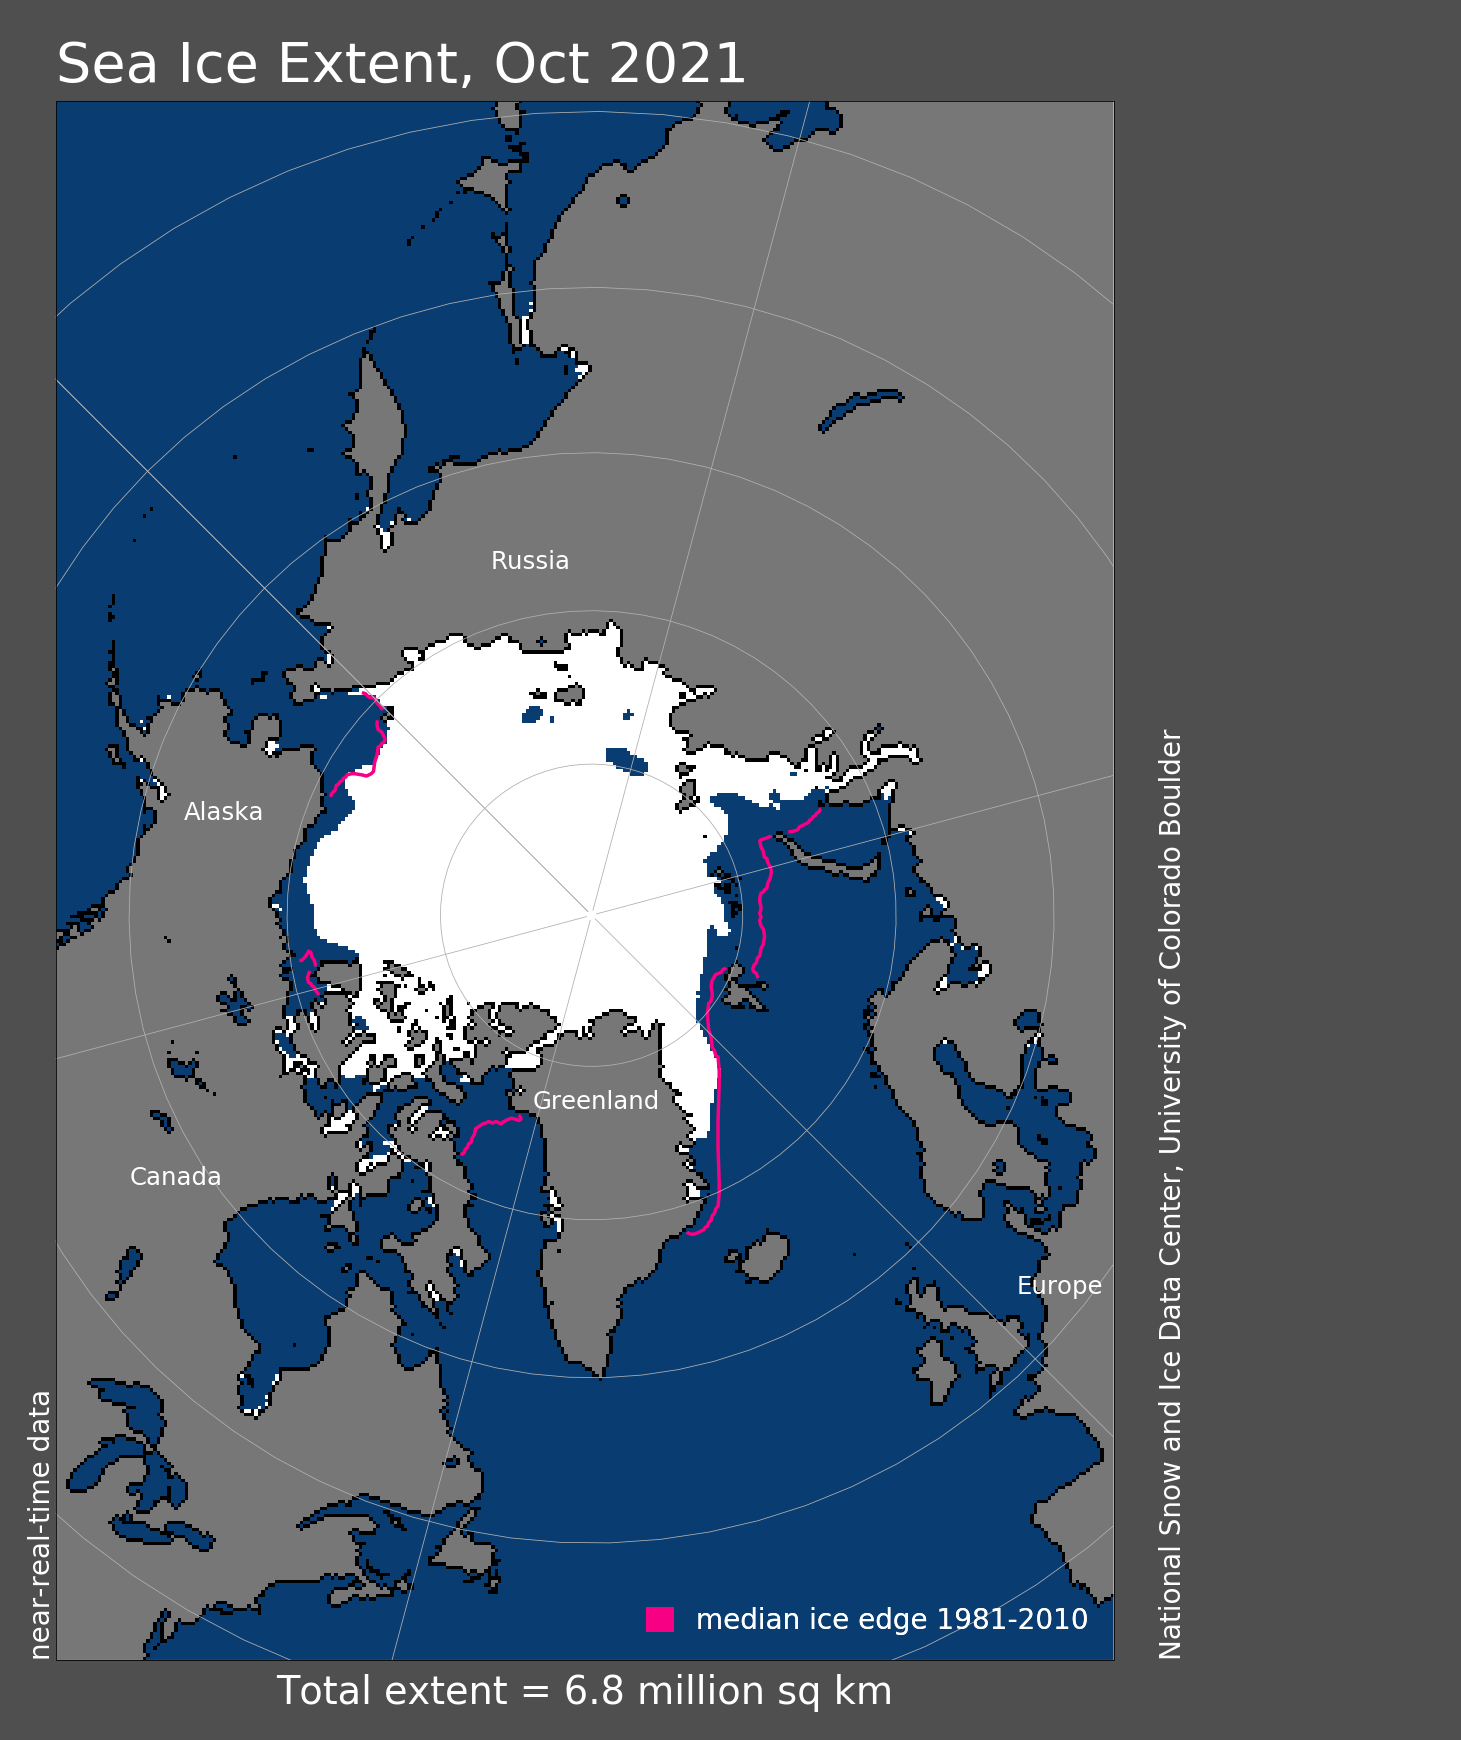
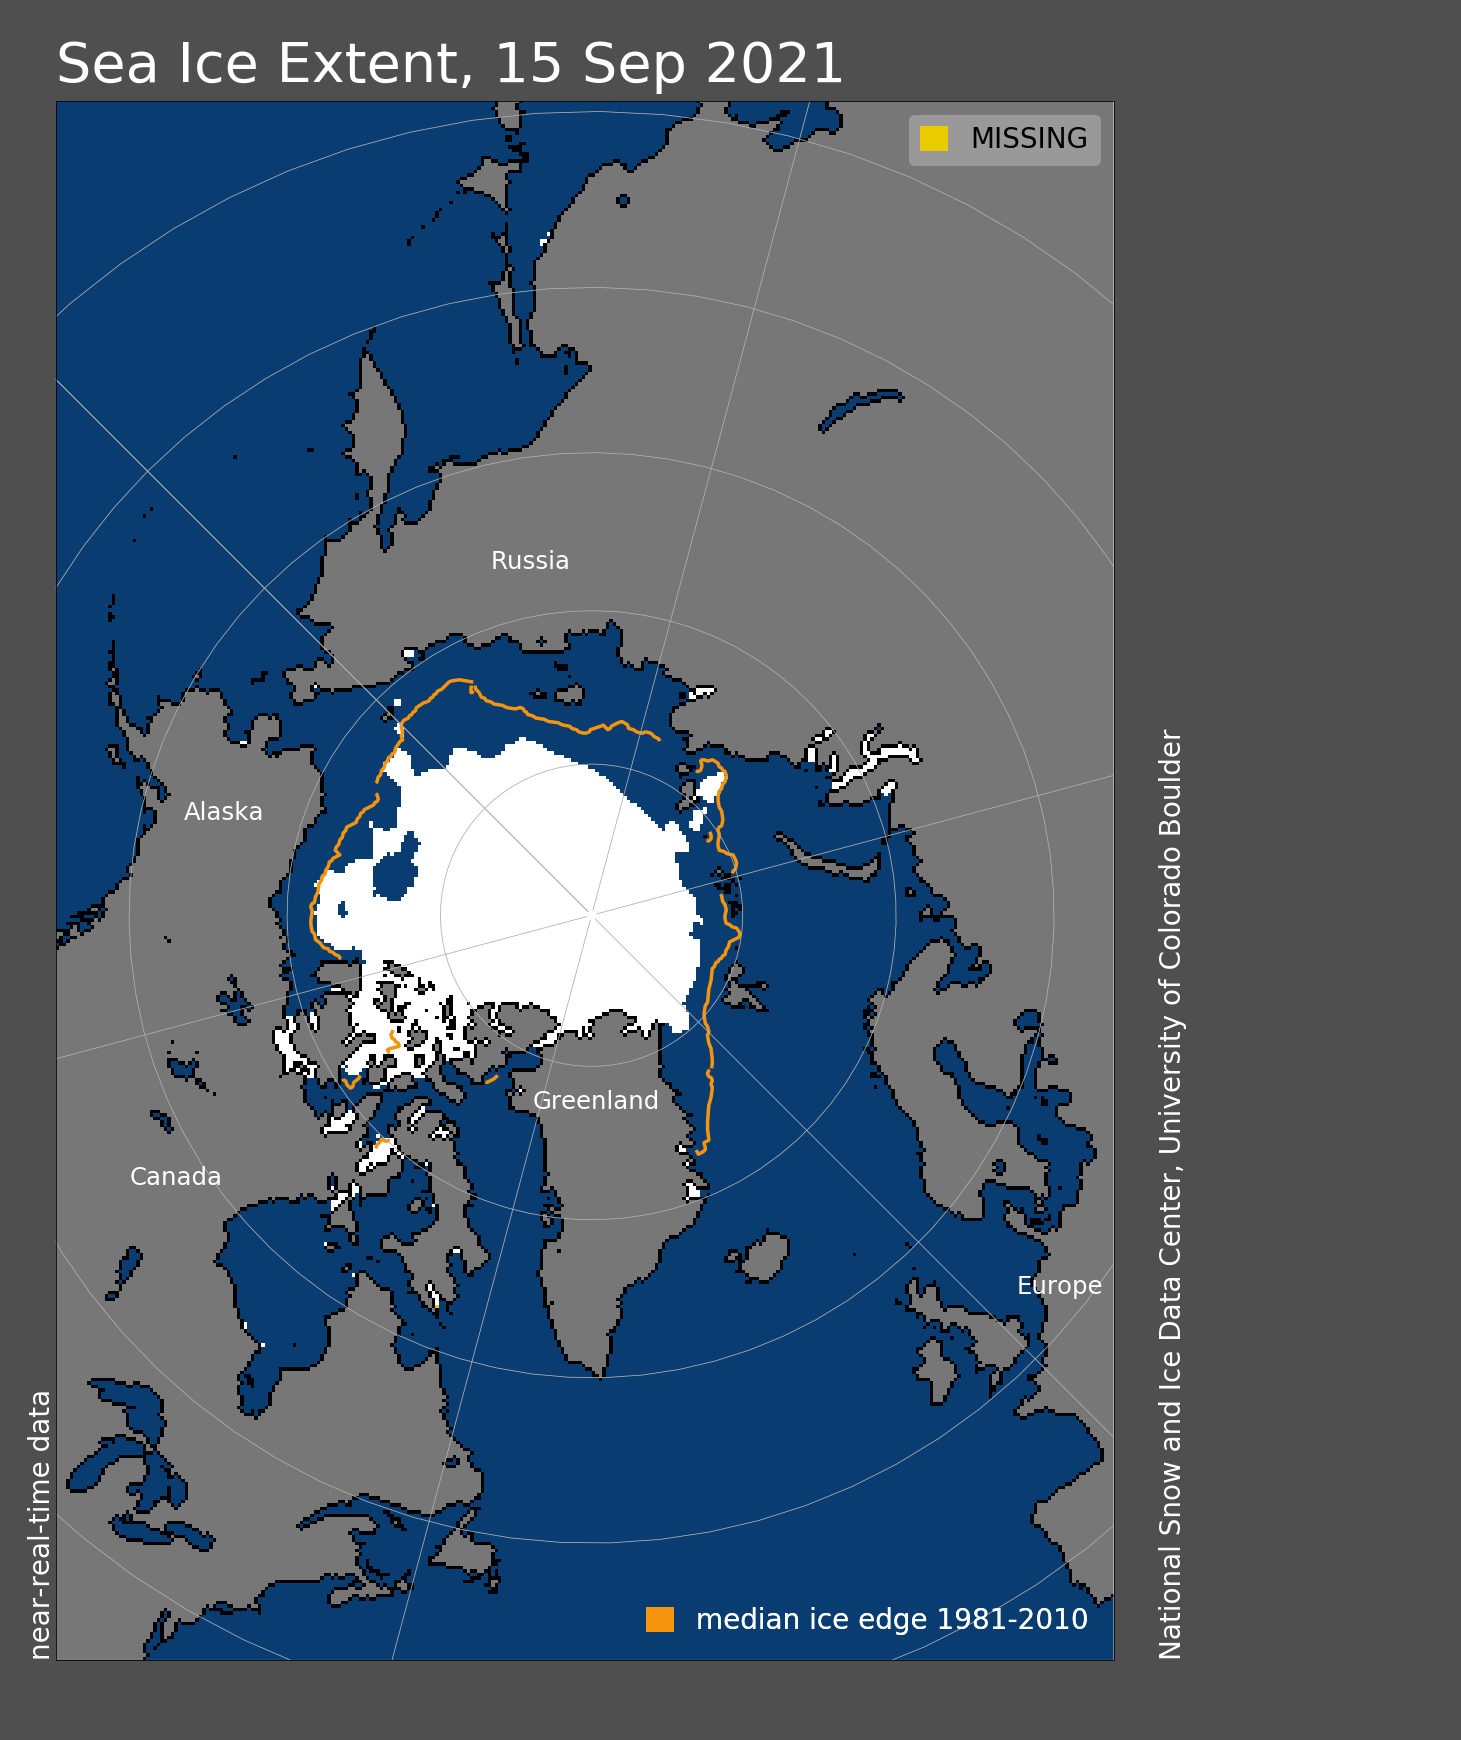
Figure 1a. Arctic sea ice extent for December 2022 was 11.92 million square kilometers (4.60 million square miles). The magenta line shows the 1981 to 2010 average extent for that month. Sea Ice Index data. About the data
Credit: National Snow and Ice Data Center
High-resolution image
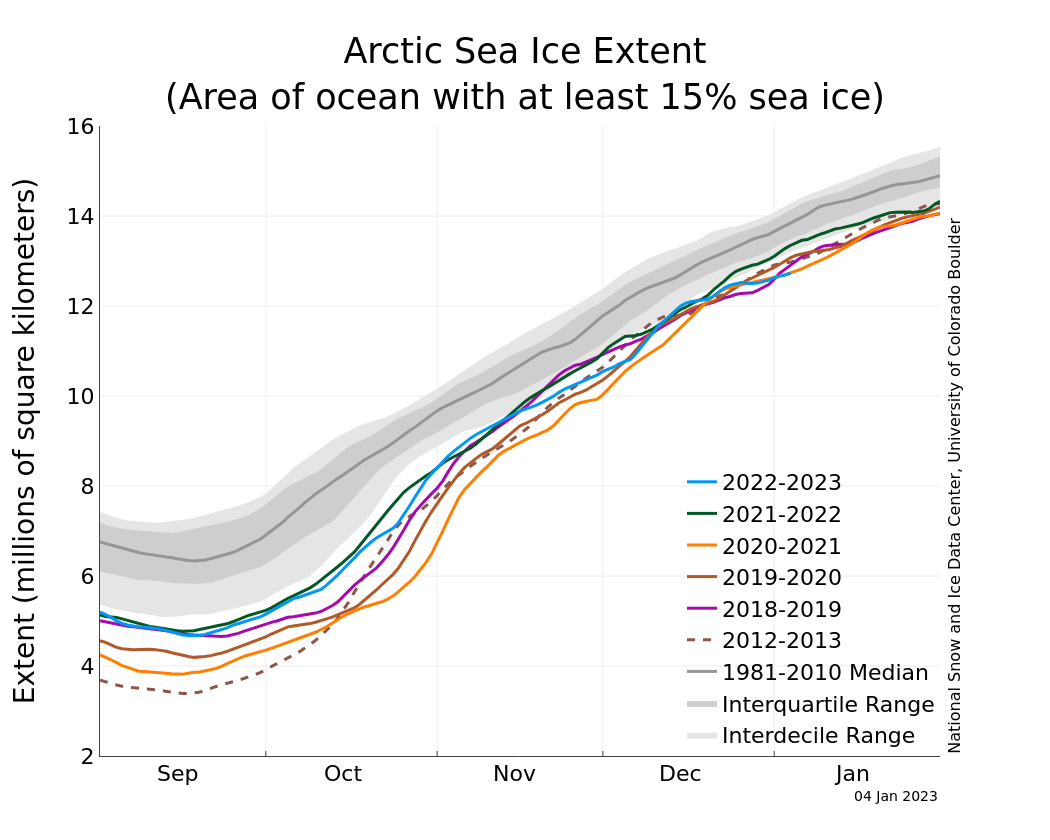
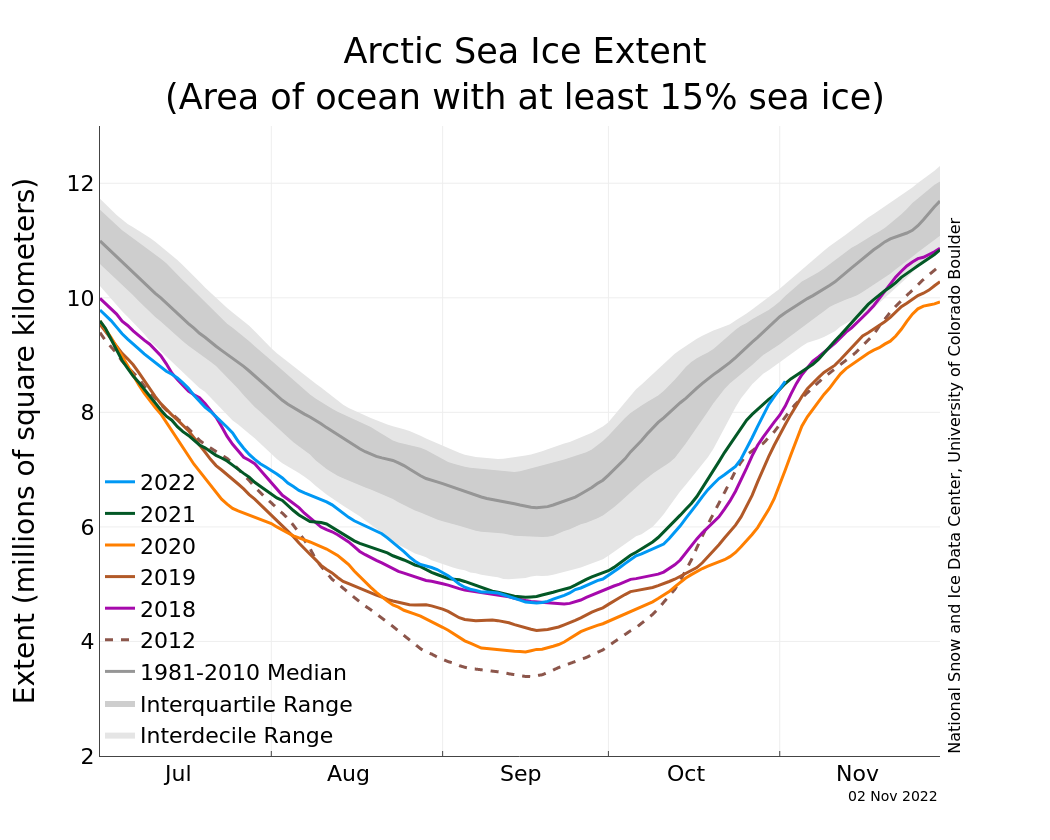
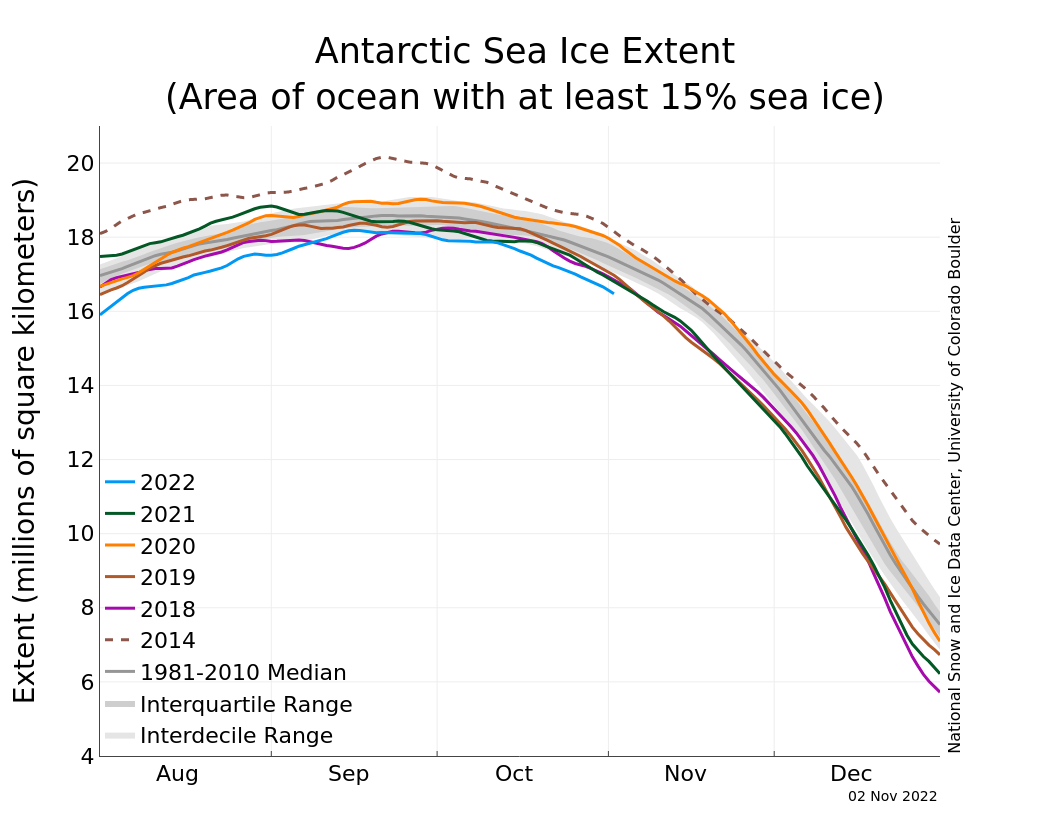
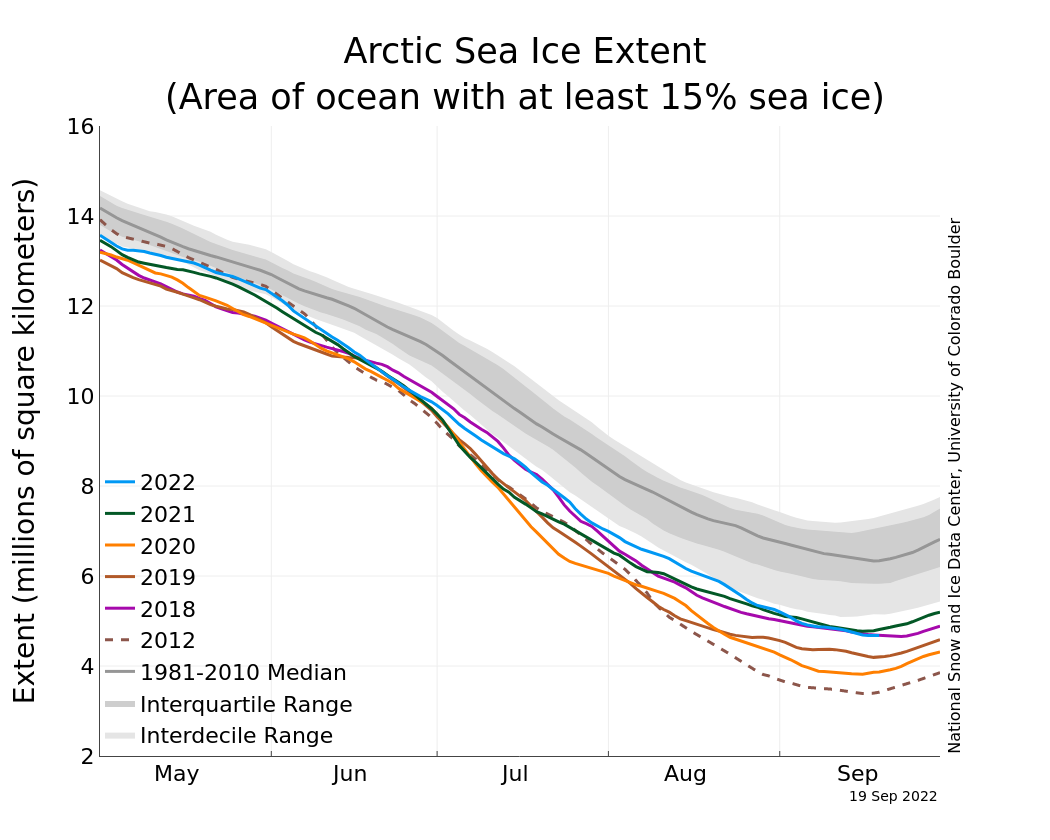
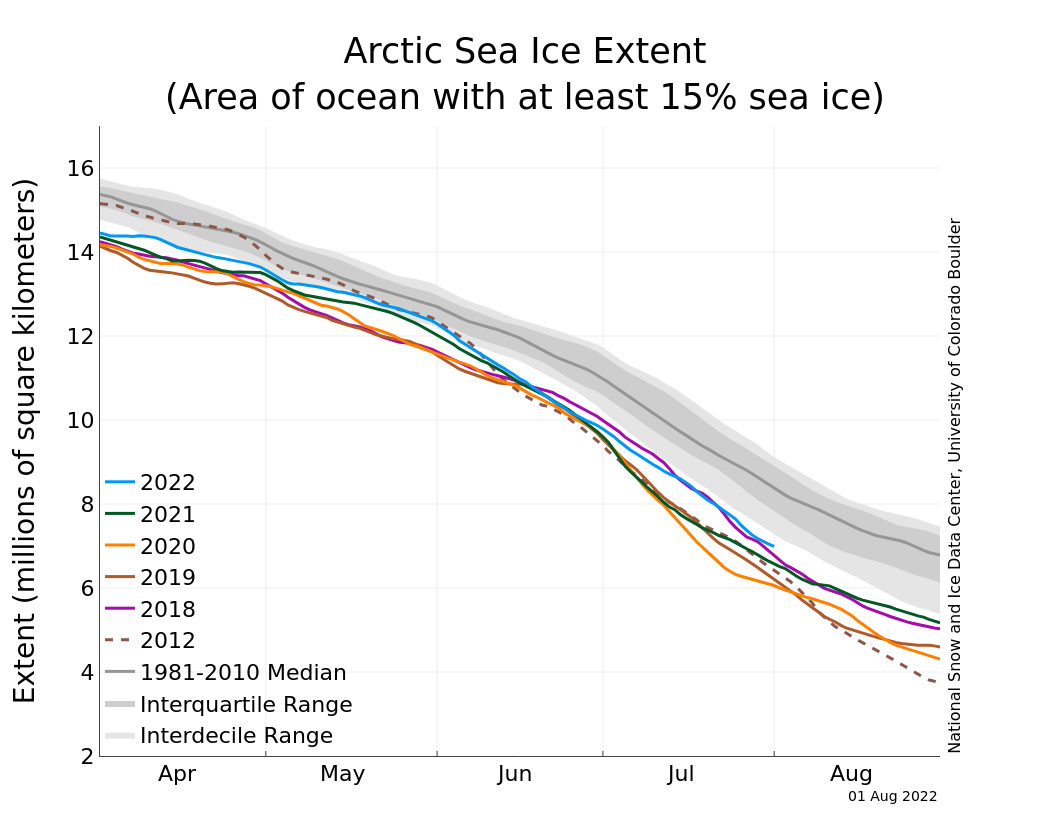
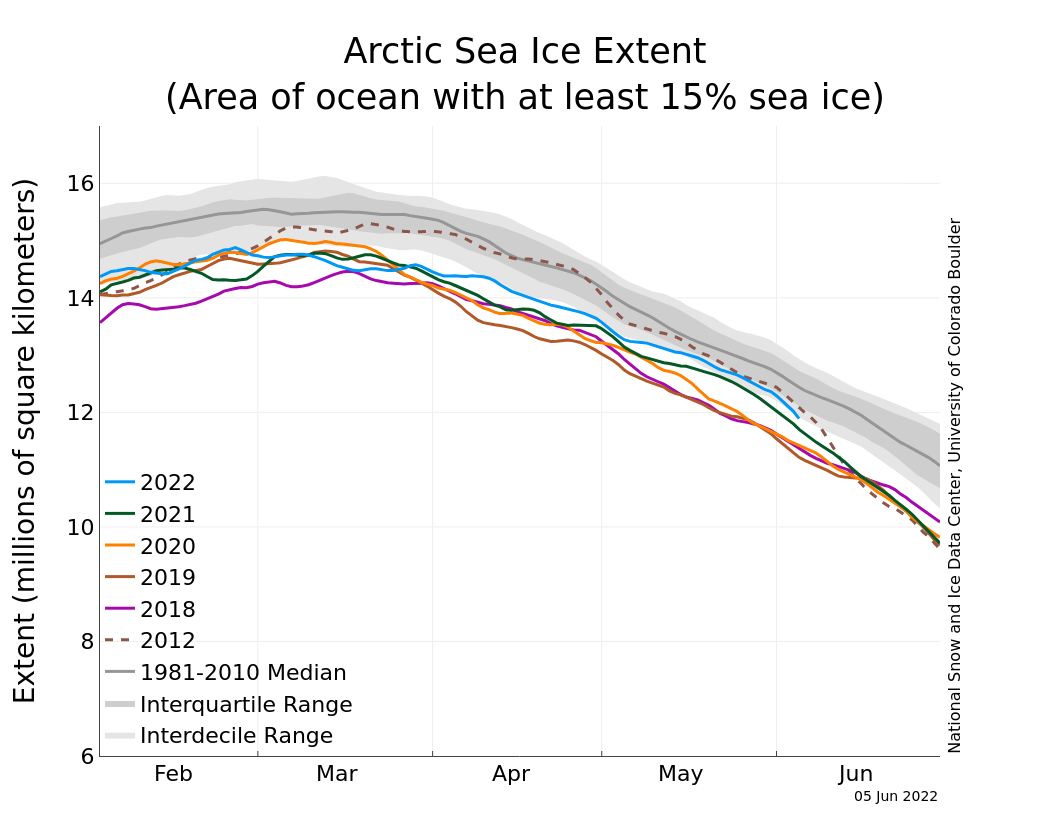
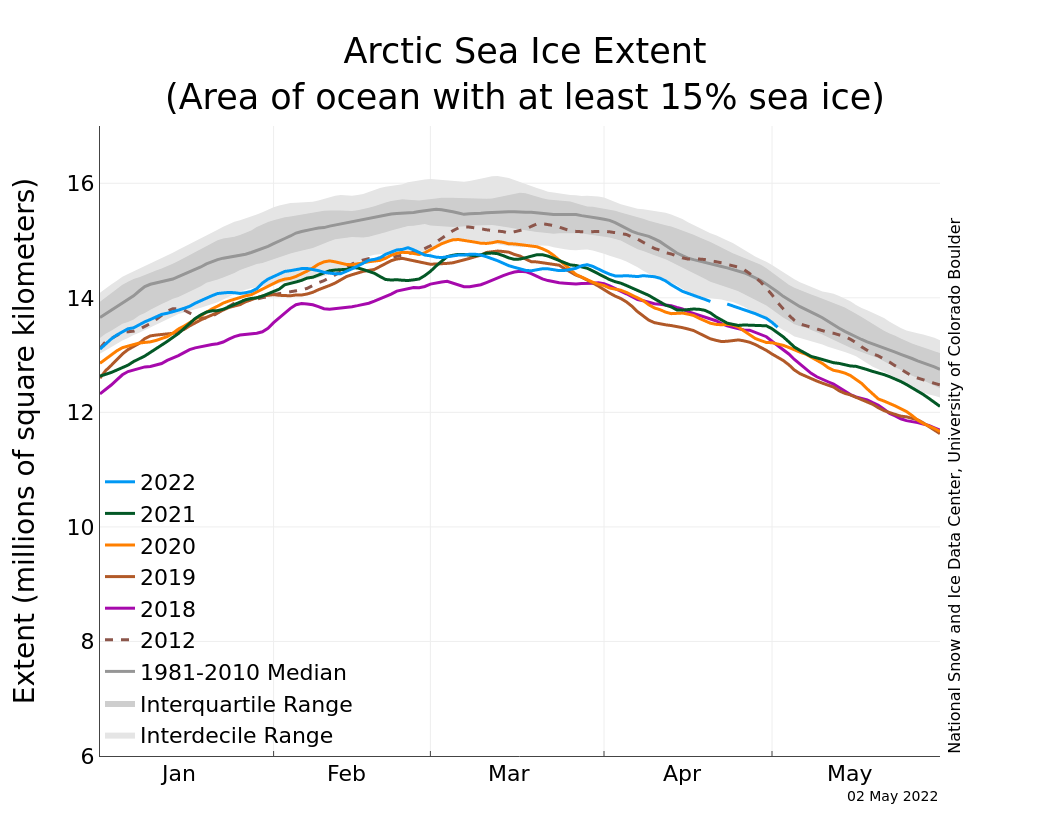
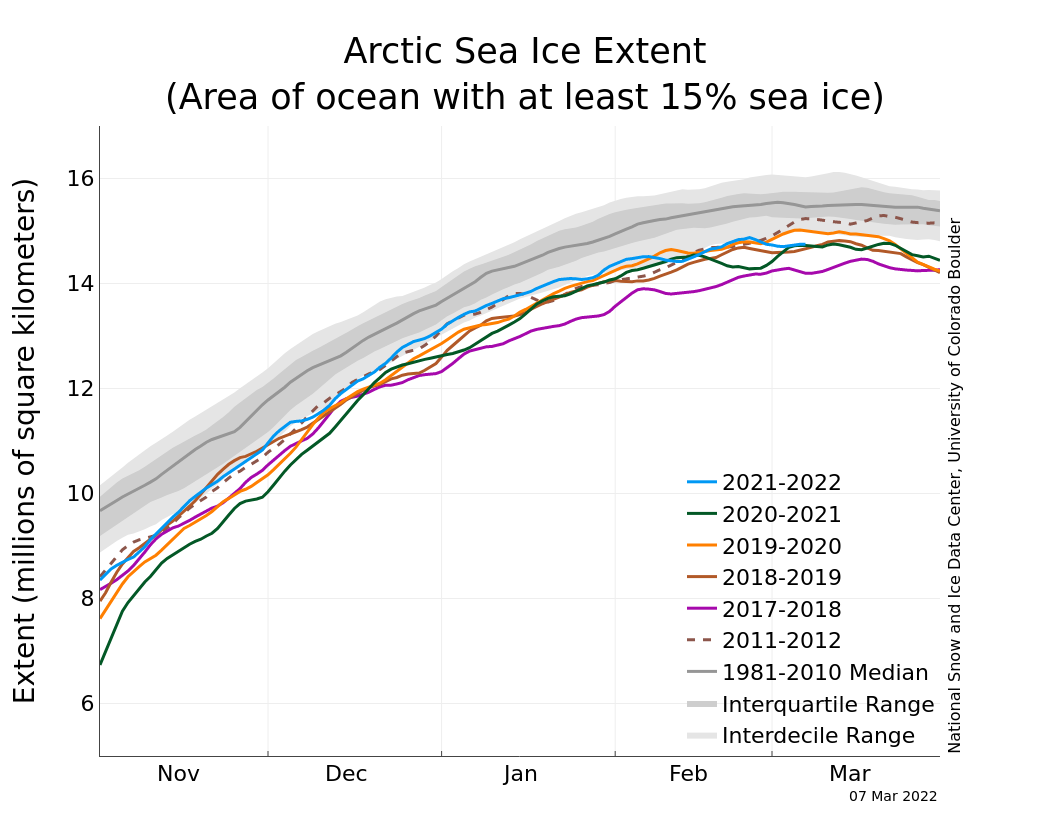
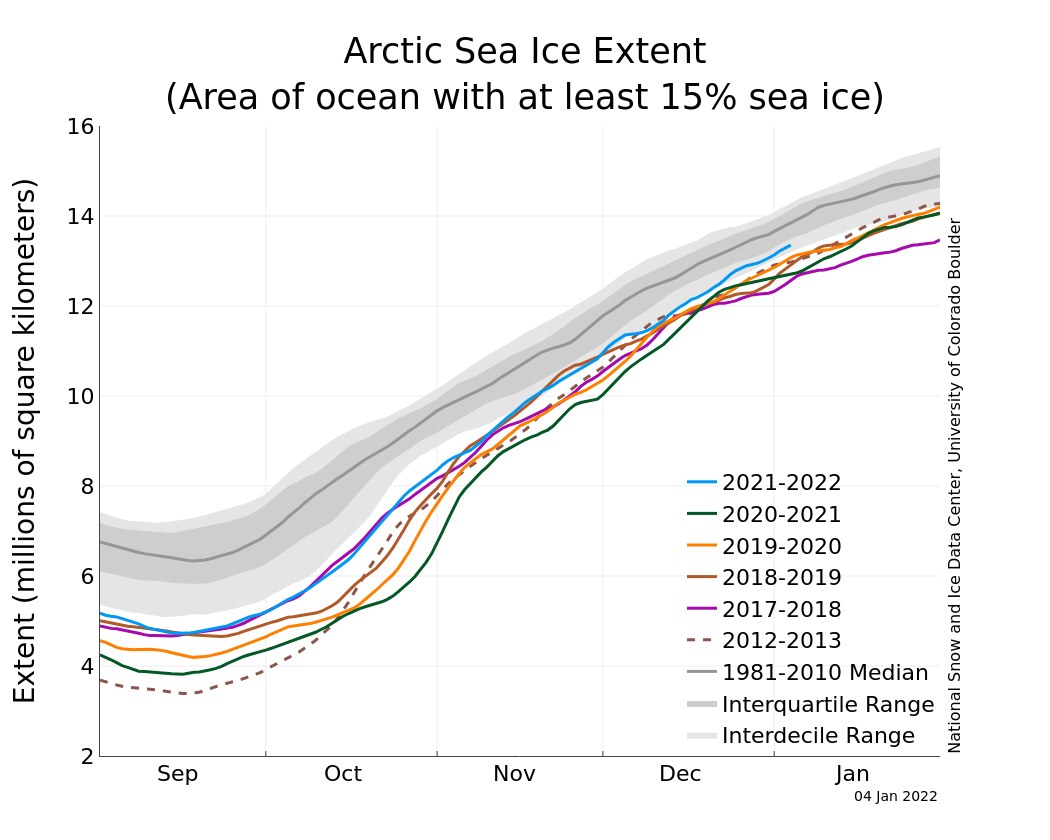
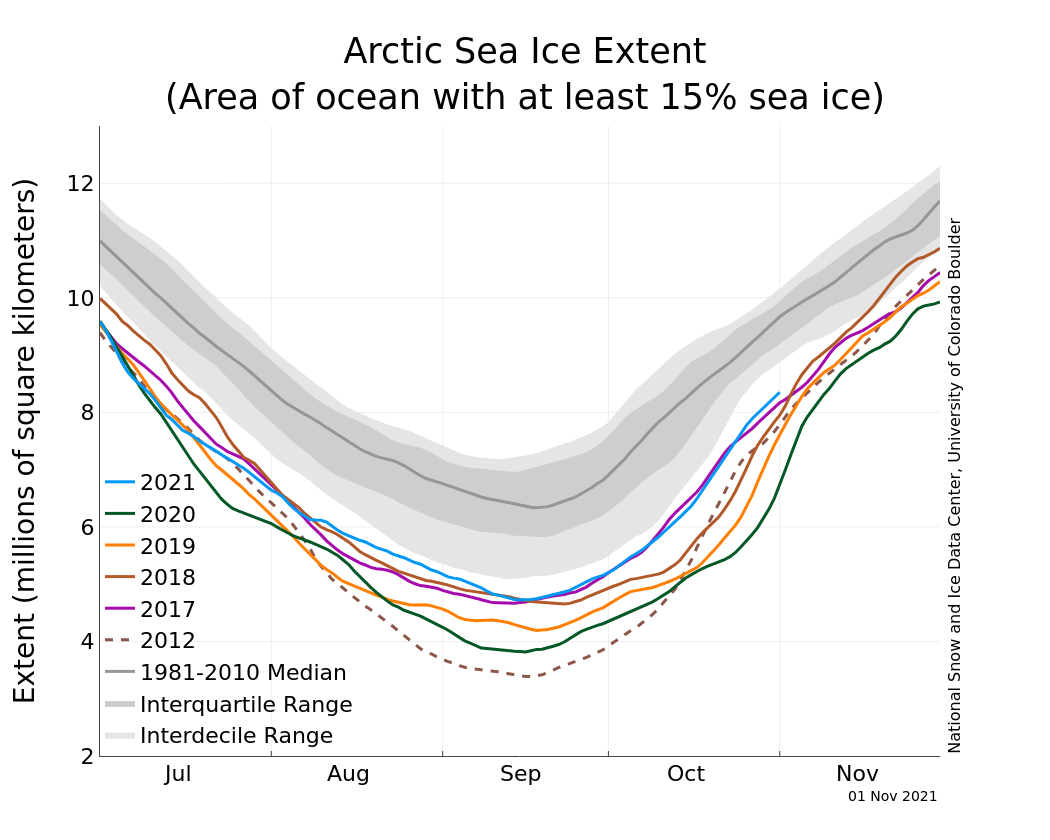
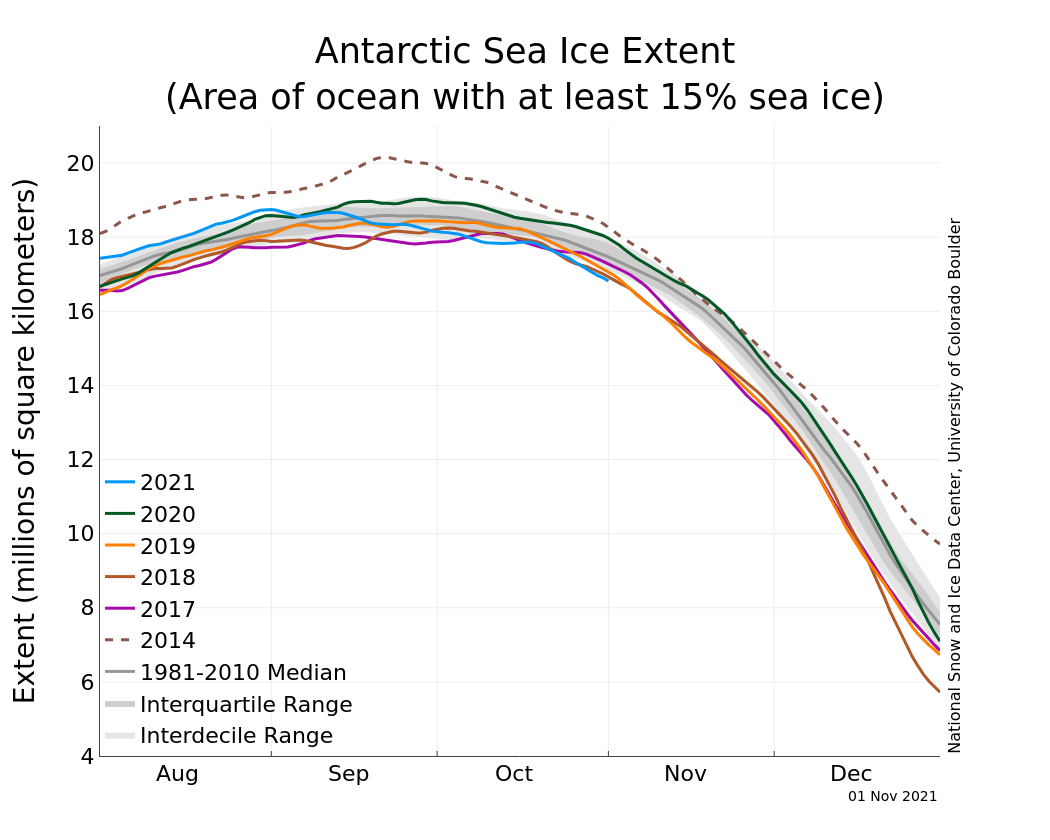
Figure 1b. The graph above shows Arctic sea ice extent as of January 4, 2023, along with daily ice extent data for four previous years and the record low year. 2022 to 2023 is shown in blue, 2021 to 2022 in green, 2020 to 2021 in orange, 2019 to 2020 in brown, 2018 to 2019 in magenta, and 2012 in dashed brown. The 1981 to 2010 median is in dark gray. The gray areas around the median line show the interquartile and interdecile ranges of the data. Sea Ice Index data.
Credit: National Snow and Ice Data Center
High-resolution image
The average Arctic sea ice extent for December 2022 was 11.92 million square kilometers (4.60 million square miles). This is the seventh lowest in the satellite record for the month (Figure 1a). Extent was 920,000 square kilometers (355,000 square miles) below the 1981 to 2010 average of 12.84 million square kilometers (4.96 million square miles) and 460,000 million square kilometers (178,000 square miles) above the record December low set in 2016 of 11.46 million square kilometers (4.42 square miles).
The rate of ice growth through the month was variable. It was faster than average through the first half of the month, then growth slowed, and then picked up the pace again. Over the last week of the month, ice growth was very slow, and as a result, total extent at the end of December stood at fourth lowest in the satellite record (Figure 1b). Regionally, at month’s end, the ice edge was notably north of its average location in the Barents Sea and on the Russian side of the Bering Sea. Hudson Bay is now almost completely iced over.
Conditions in context

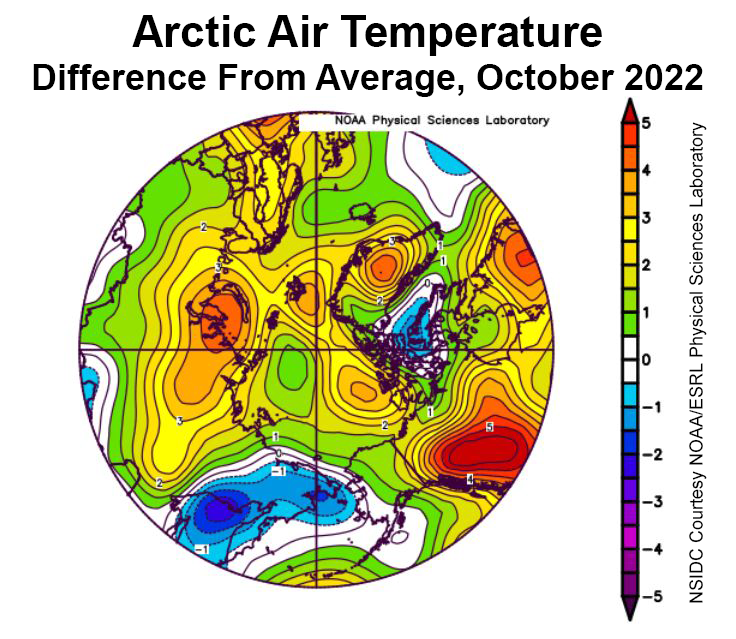
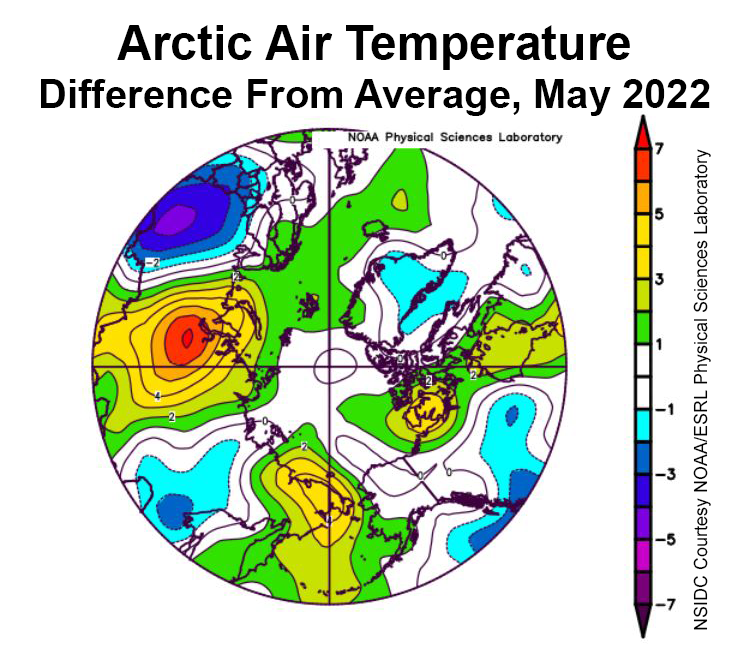
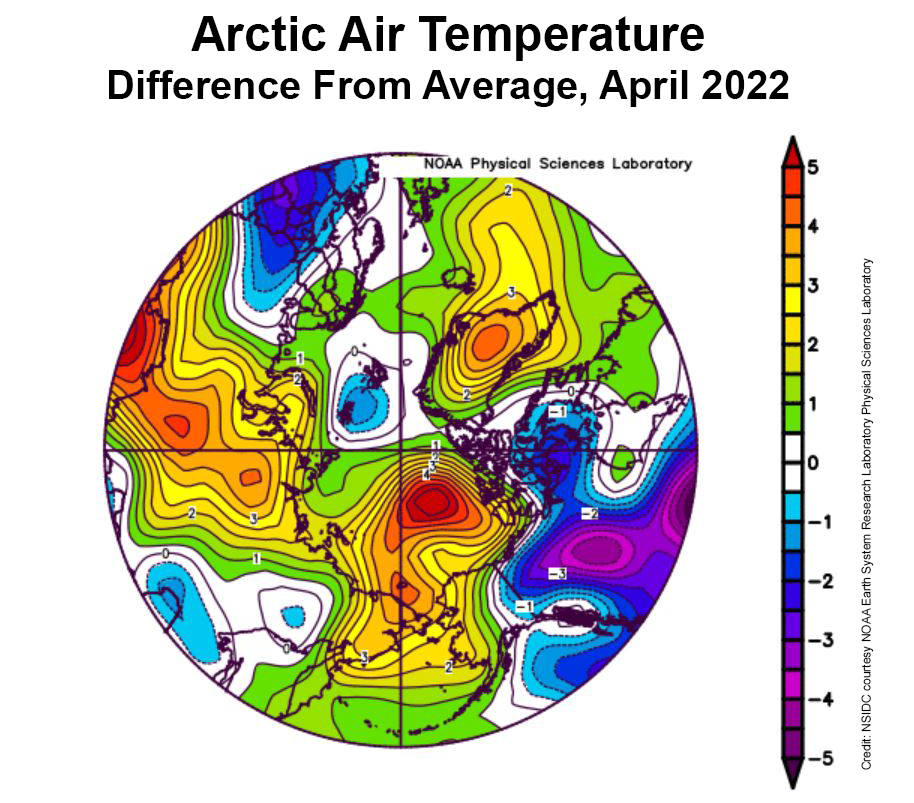
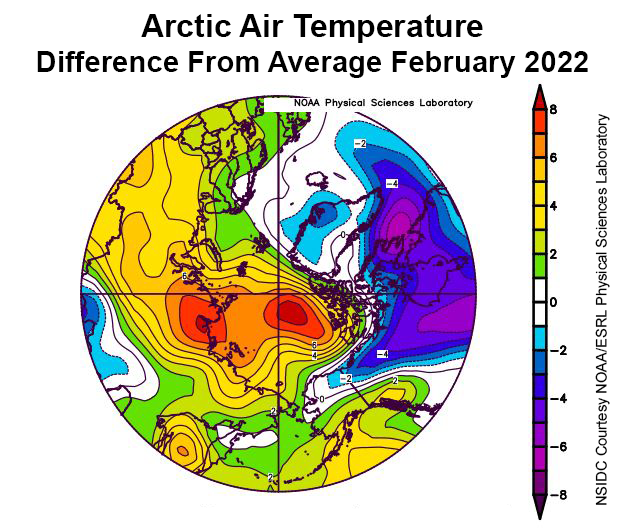
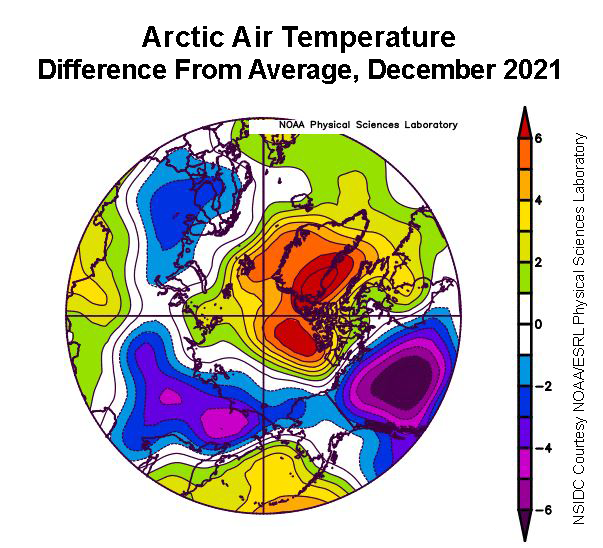
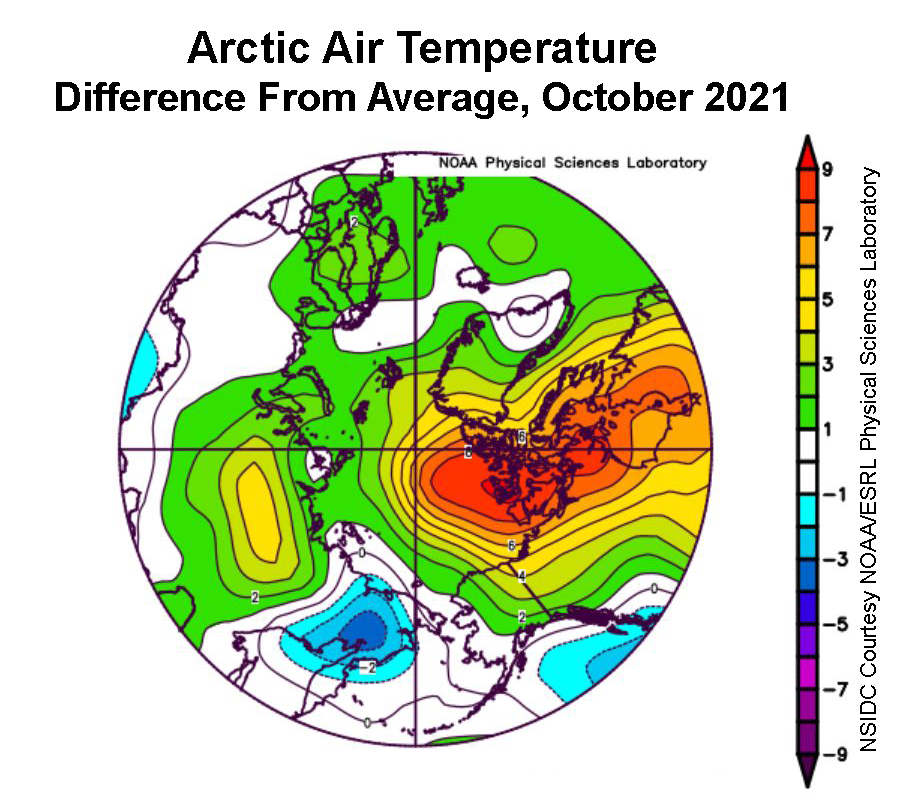
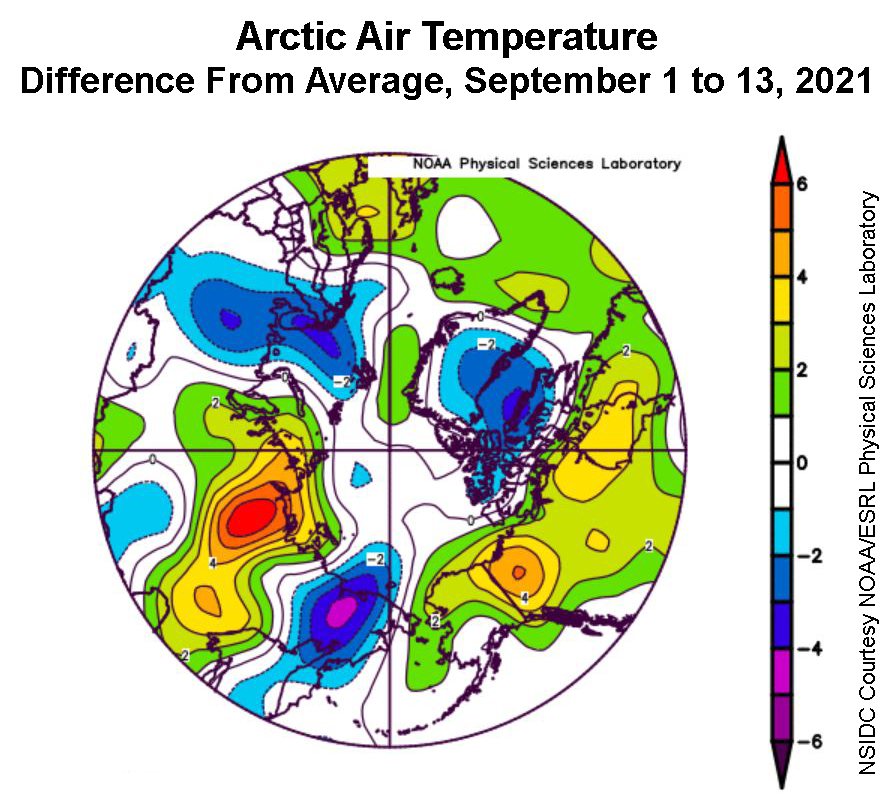
Figure 2a. This plot shows the departure from average air temperature in the Arctic at the 925 hPa level, in degrees Celsius, for December 2022. Yellows and reds indicate higher than average temperatures; blues and purples indicate lower than average temperatures.
Credit: NSIDC courtesy NOAA Earth System Research Laboratory Physical Sciences Laboratory
High-resolution image

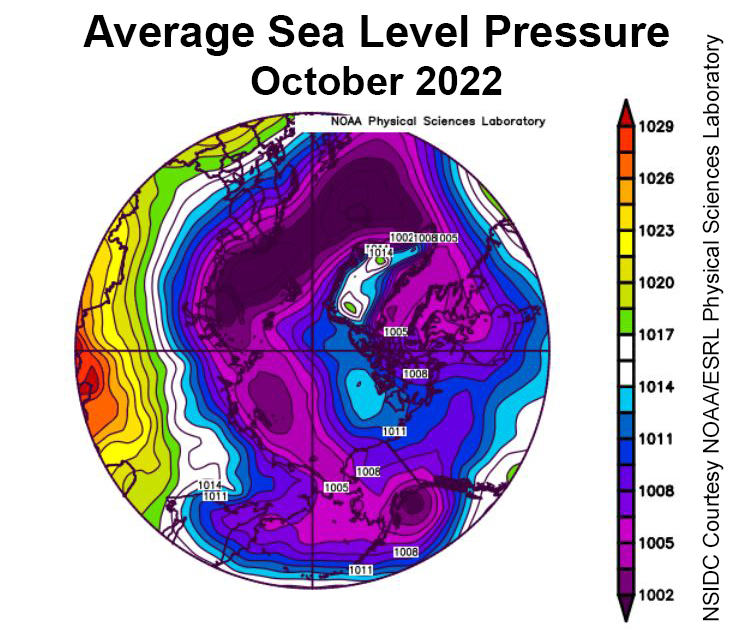
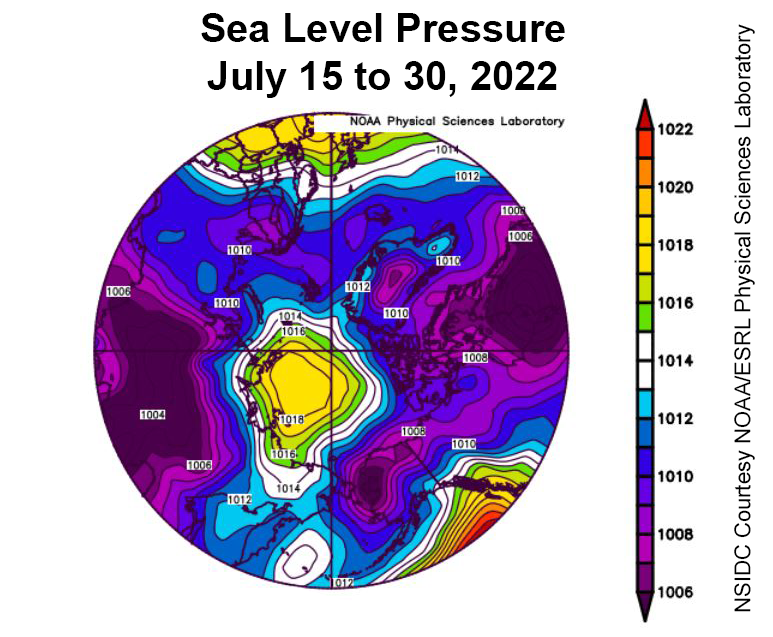
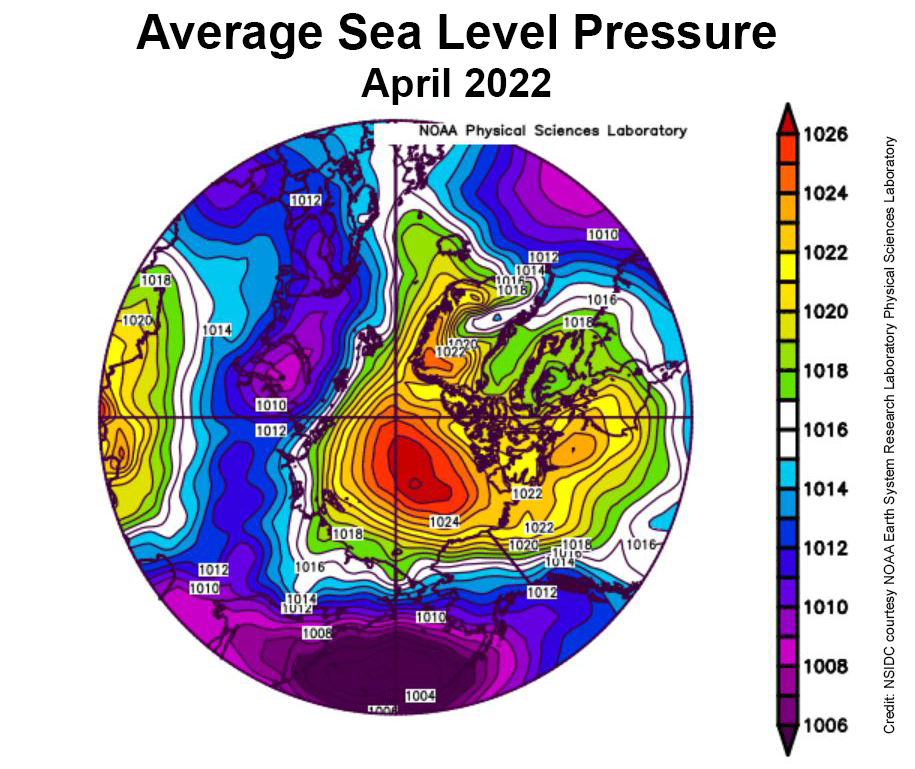
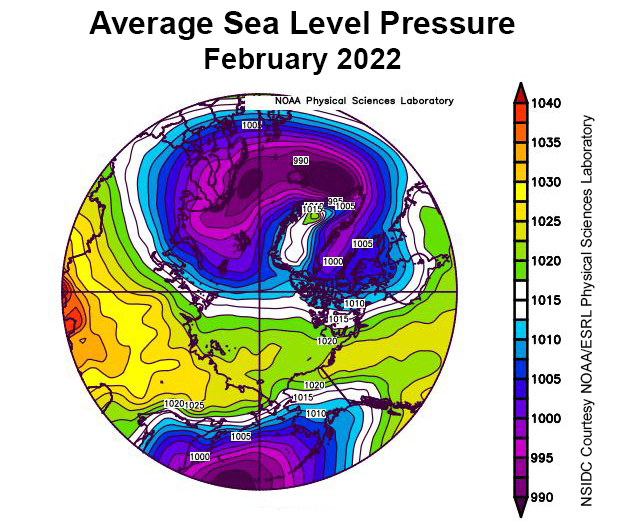
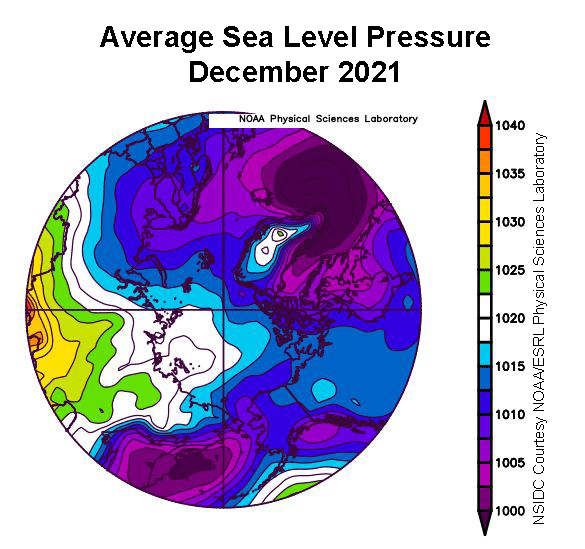
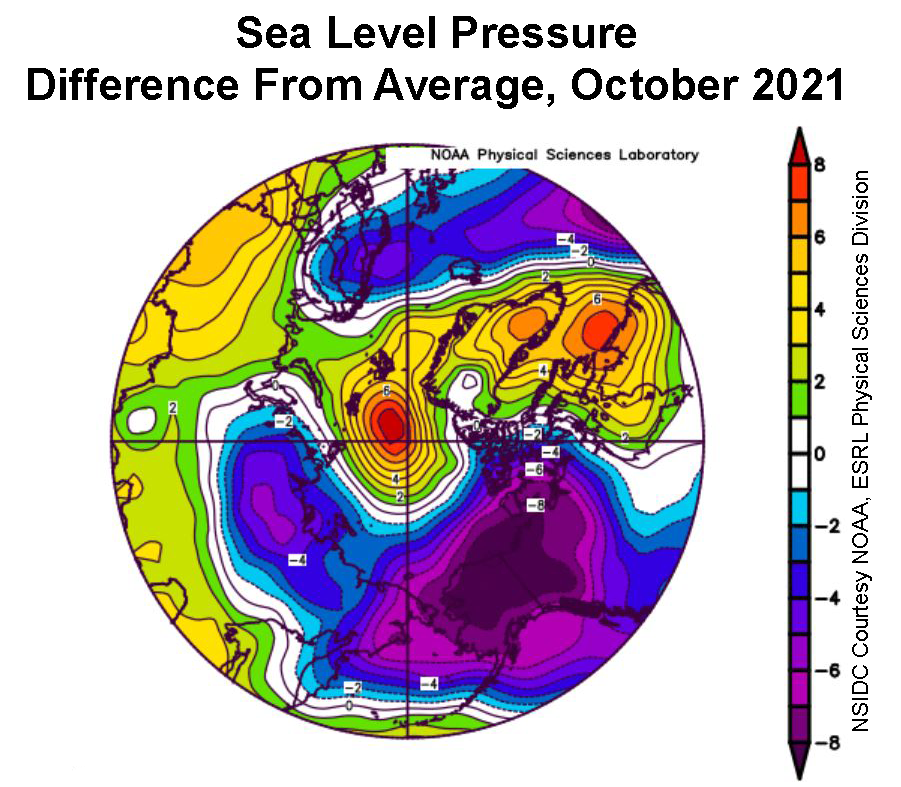
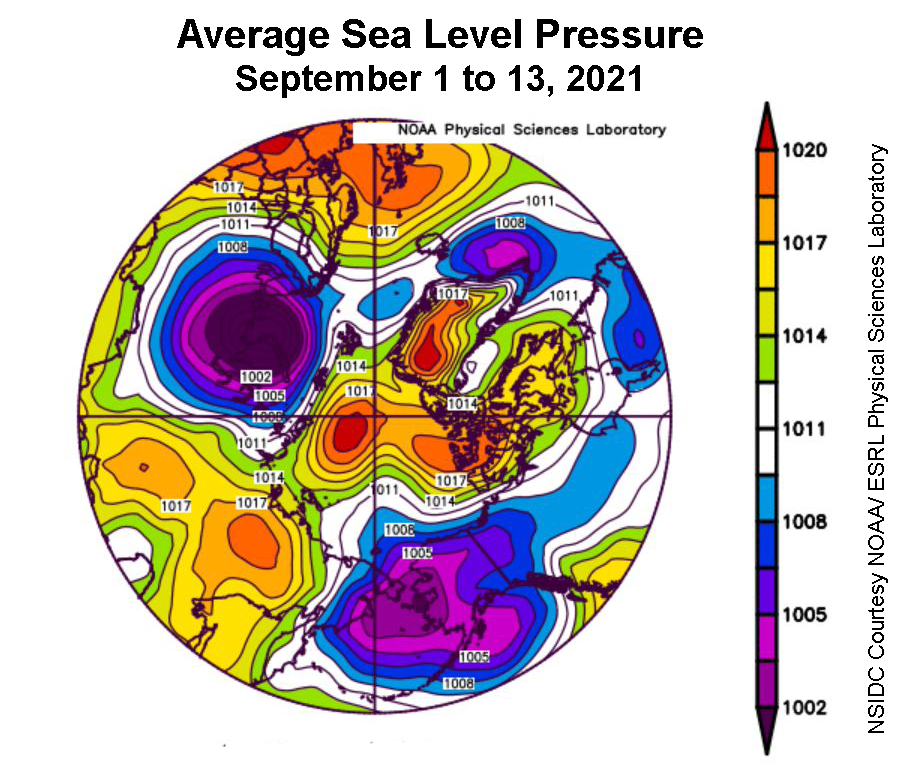
Figure 2b. This plot shows average sea level pressure in the Arctic in millibars for December 2022. Yellows and reds indicate high air pressure; blues and purples indicate low pressure.
Credit: NSIDC courtesy NOAA Earth System Research Laboratory Physical Sciences Laboratory
High-resolution image
Average December air temperatures at the 925 hPa level (approximately 2,500 feet above the surface) were above the 1991 to 2020 average over essentially all of the Arctic Ocean, but notably in the area centered over the East Siberian Sea (Figure 2a). The unusually warm conditions in this area, which were 6 to 8 degrees Celsius (11 to 14 degrees Fahrenheit) above average, appear to be related to the large area of below-average sea level pressure over the northern North Pacific Ocean pumping warm air into the East Siberian Sea (Figure 2b). Air temperatures were also above average over the eastern Canadian Arctic and most of Greenland.
December 2022 compared to previous years

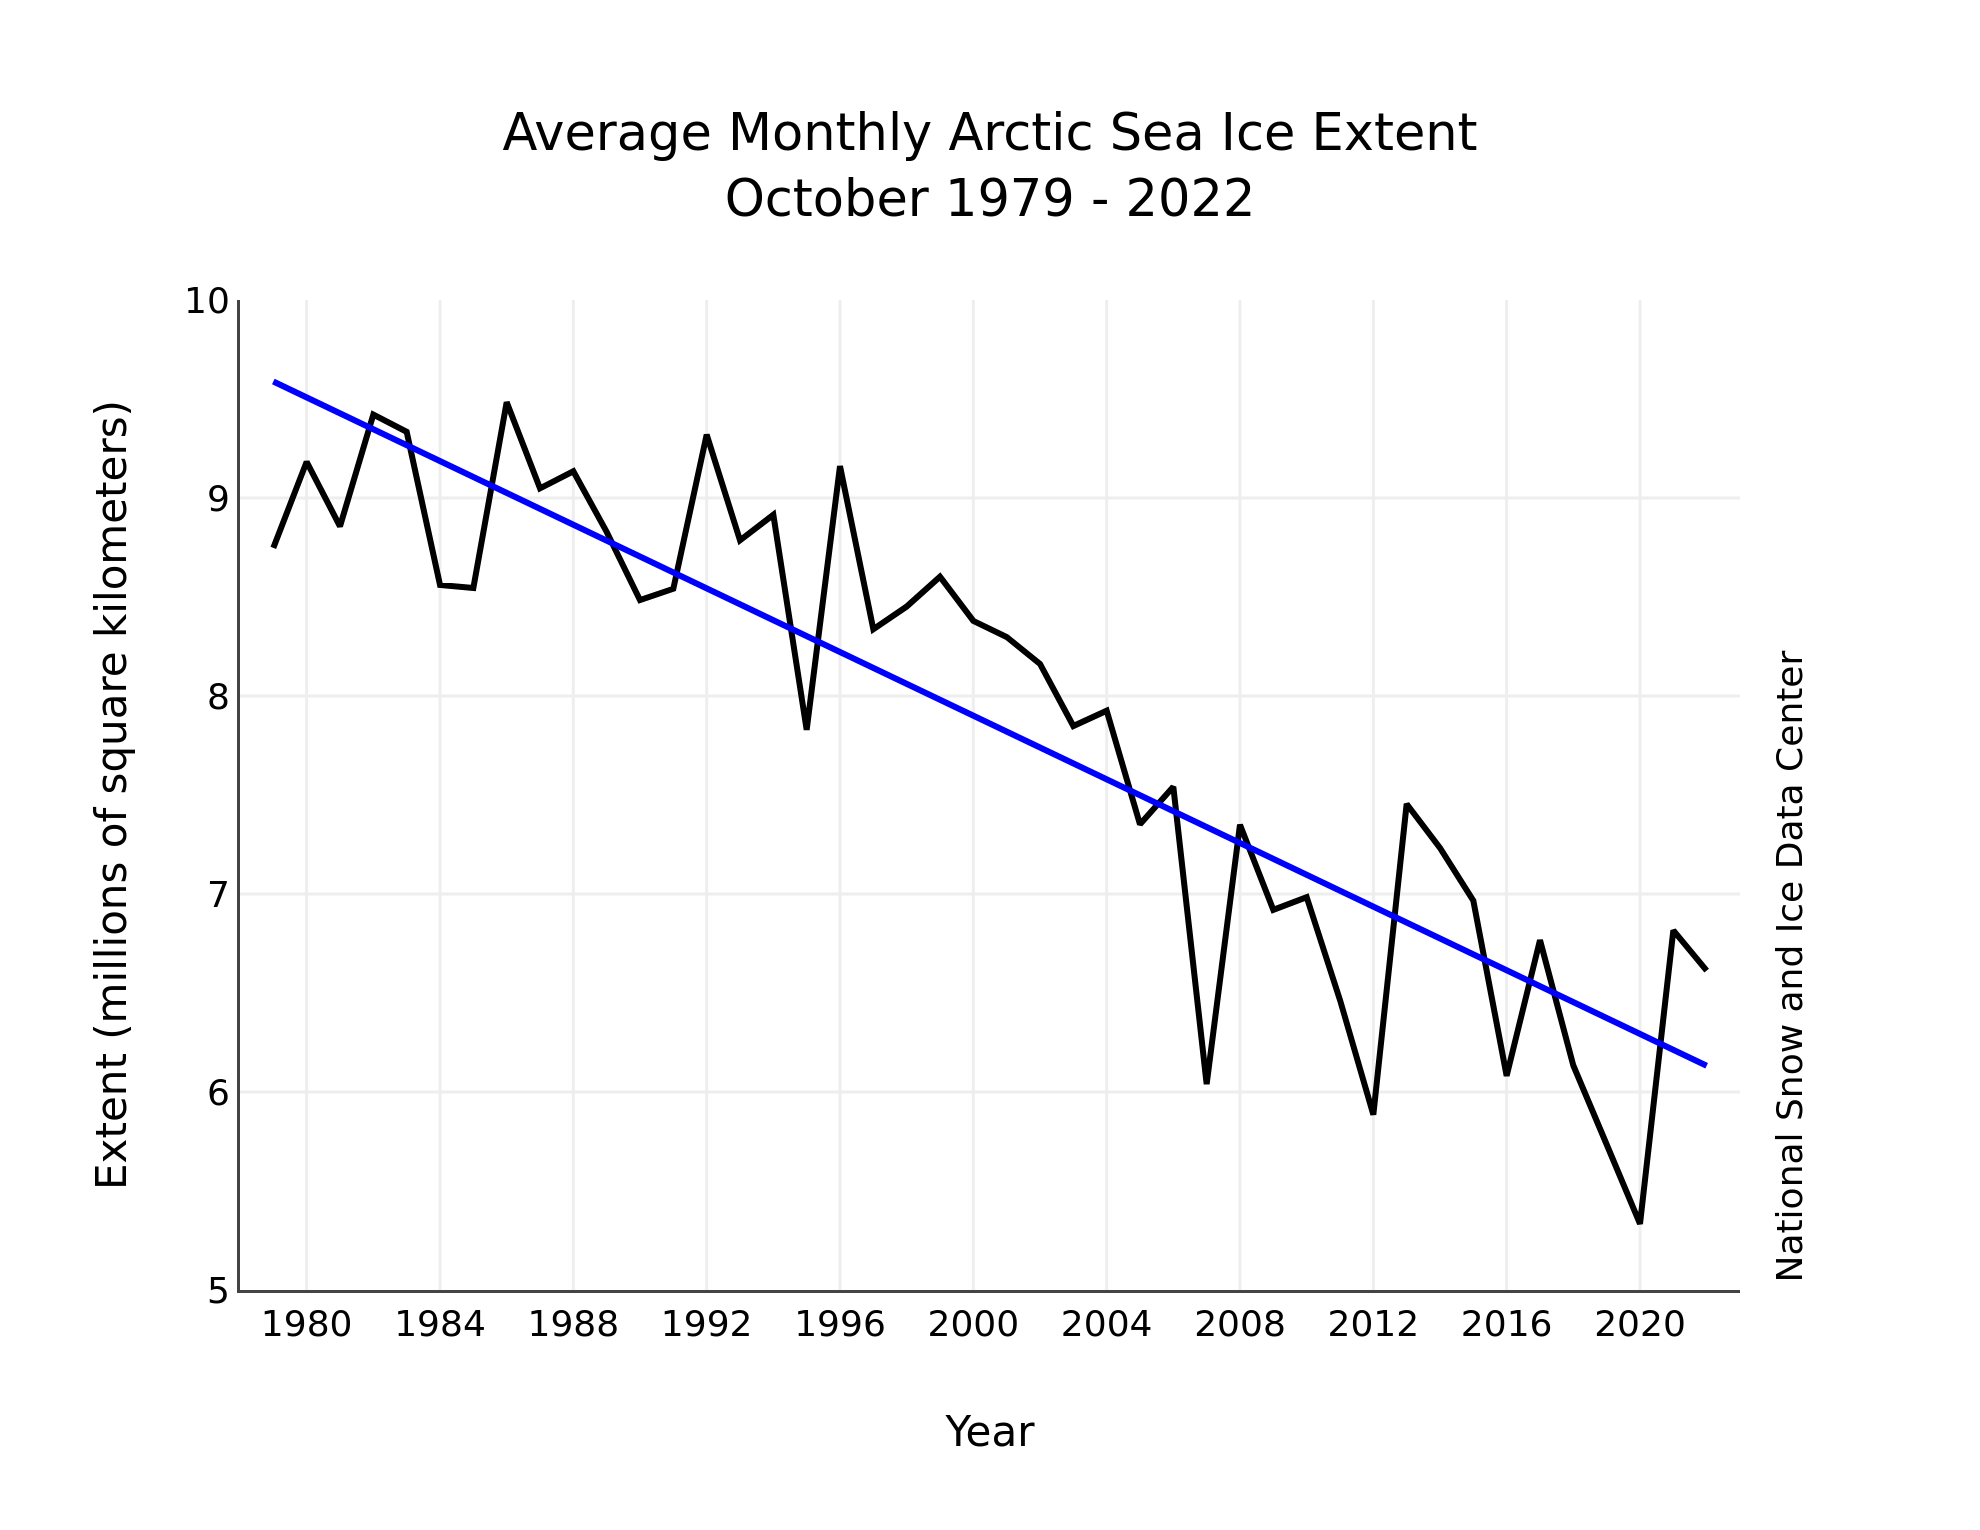
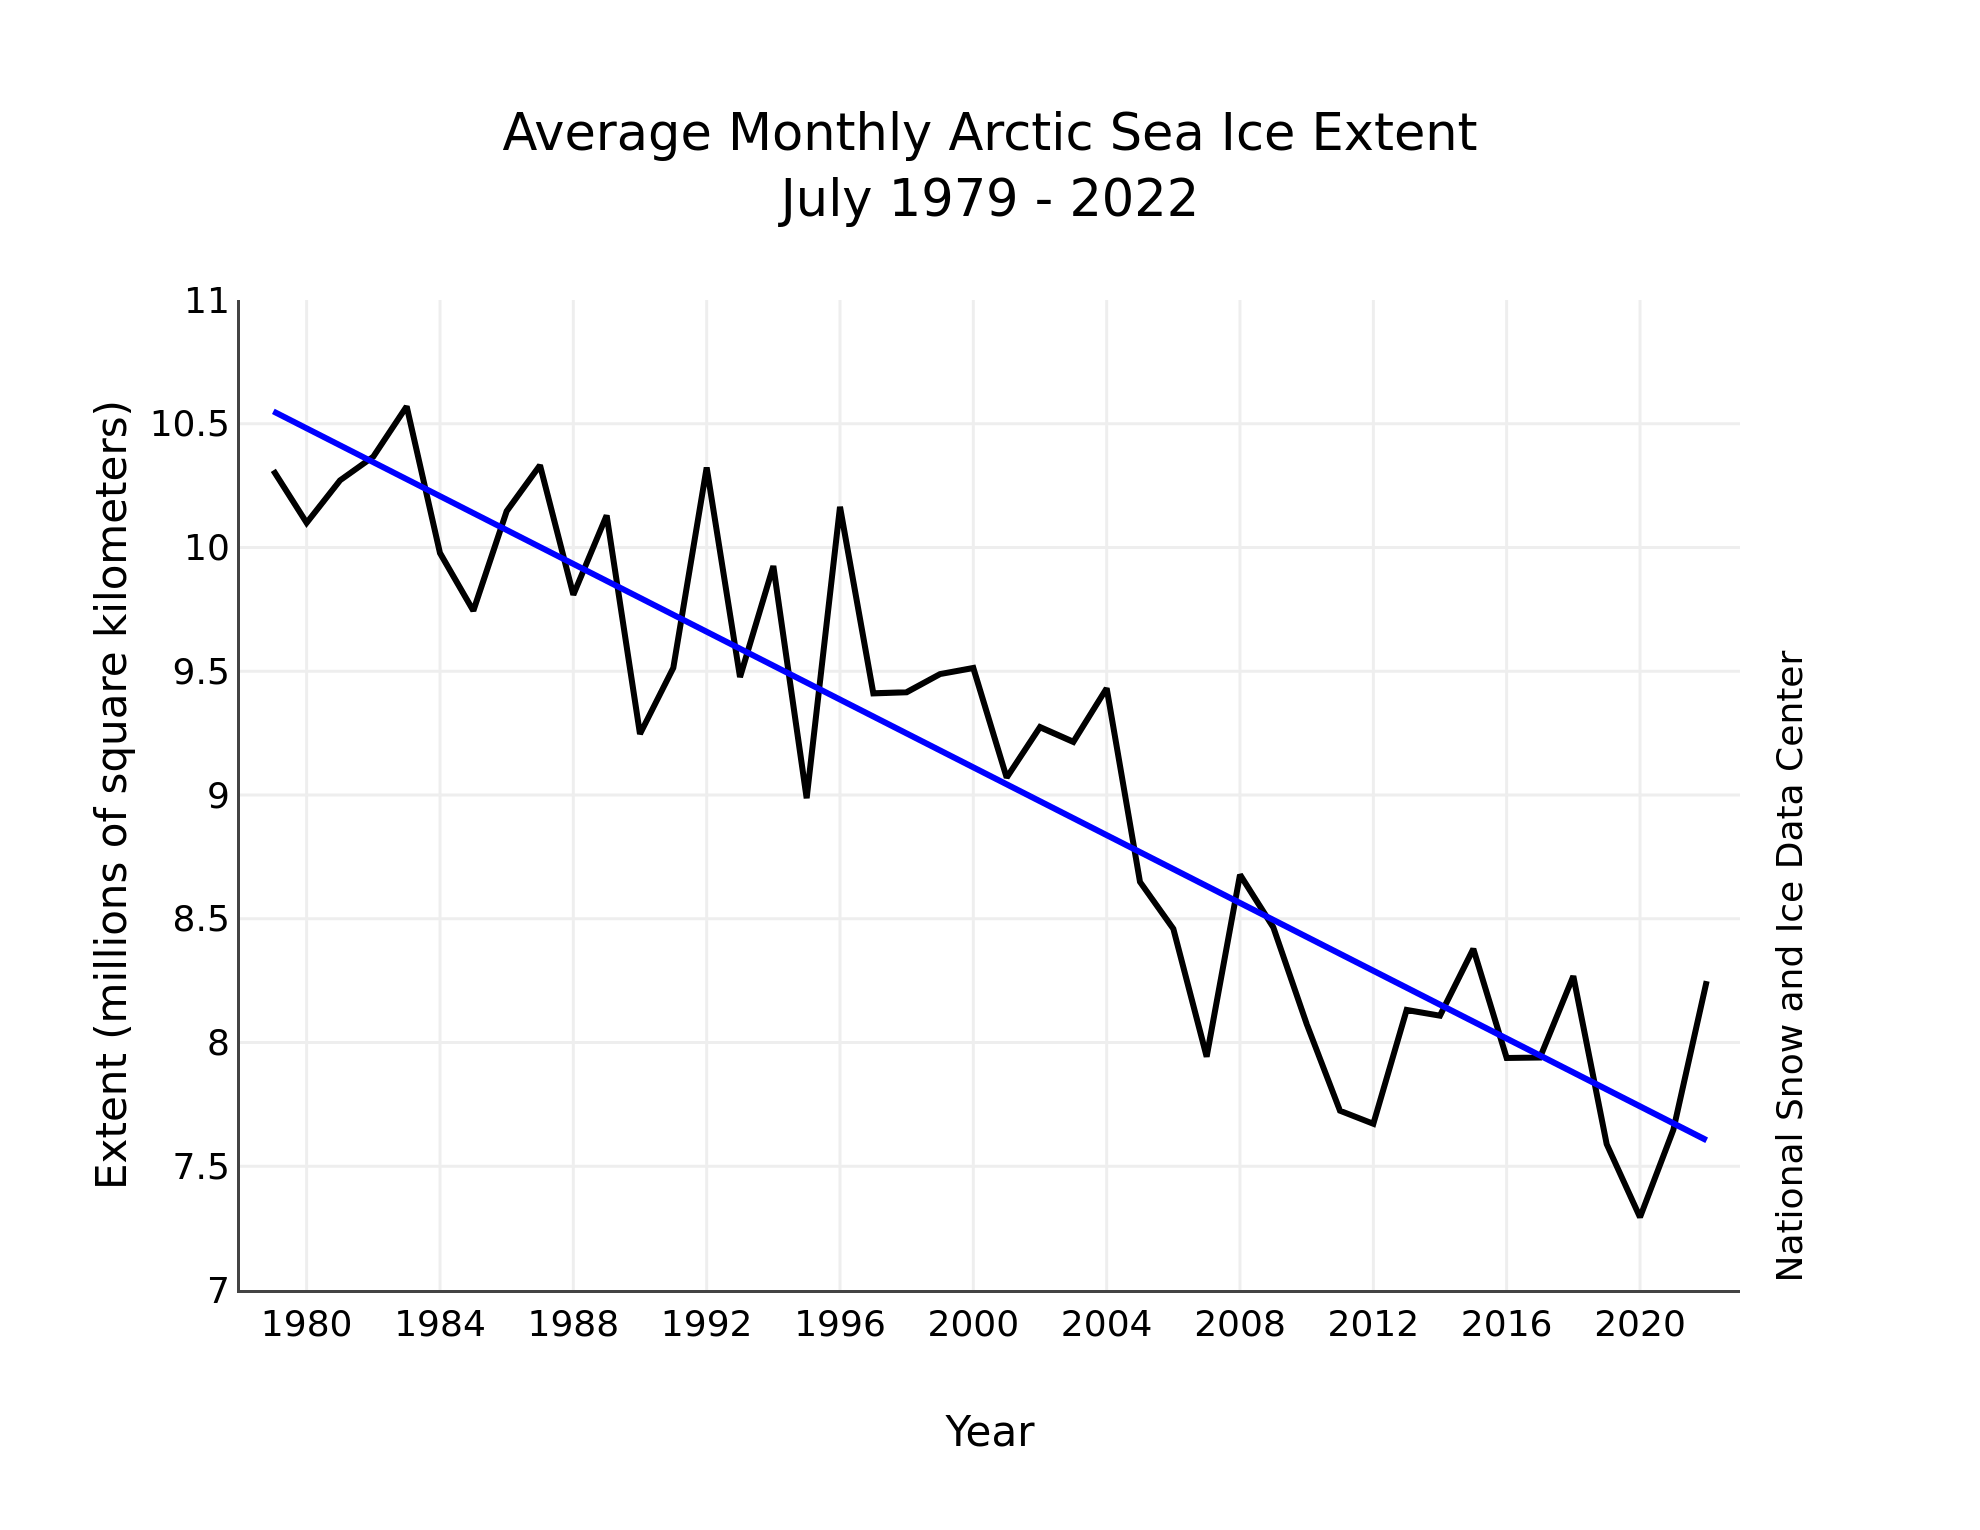
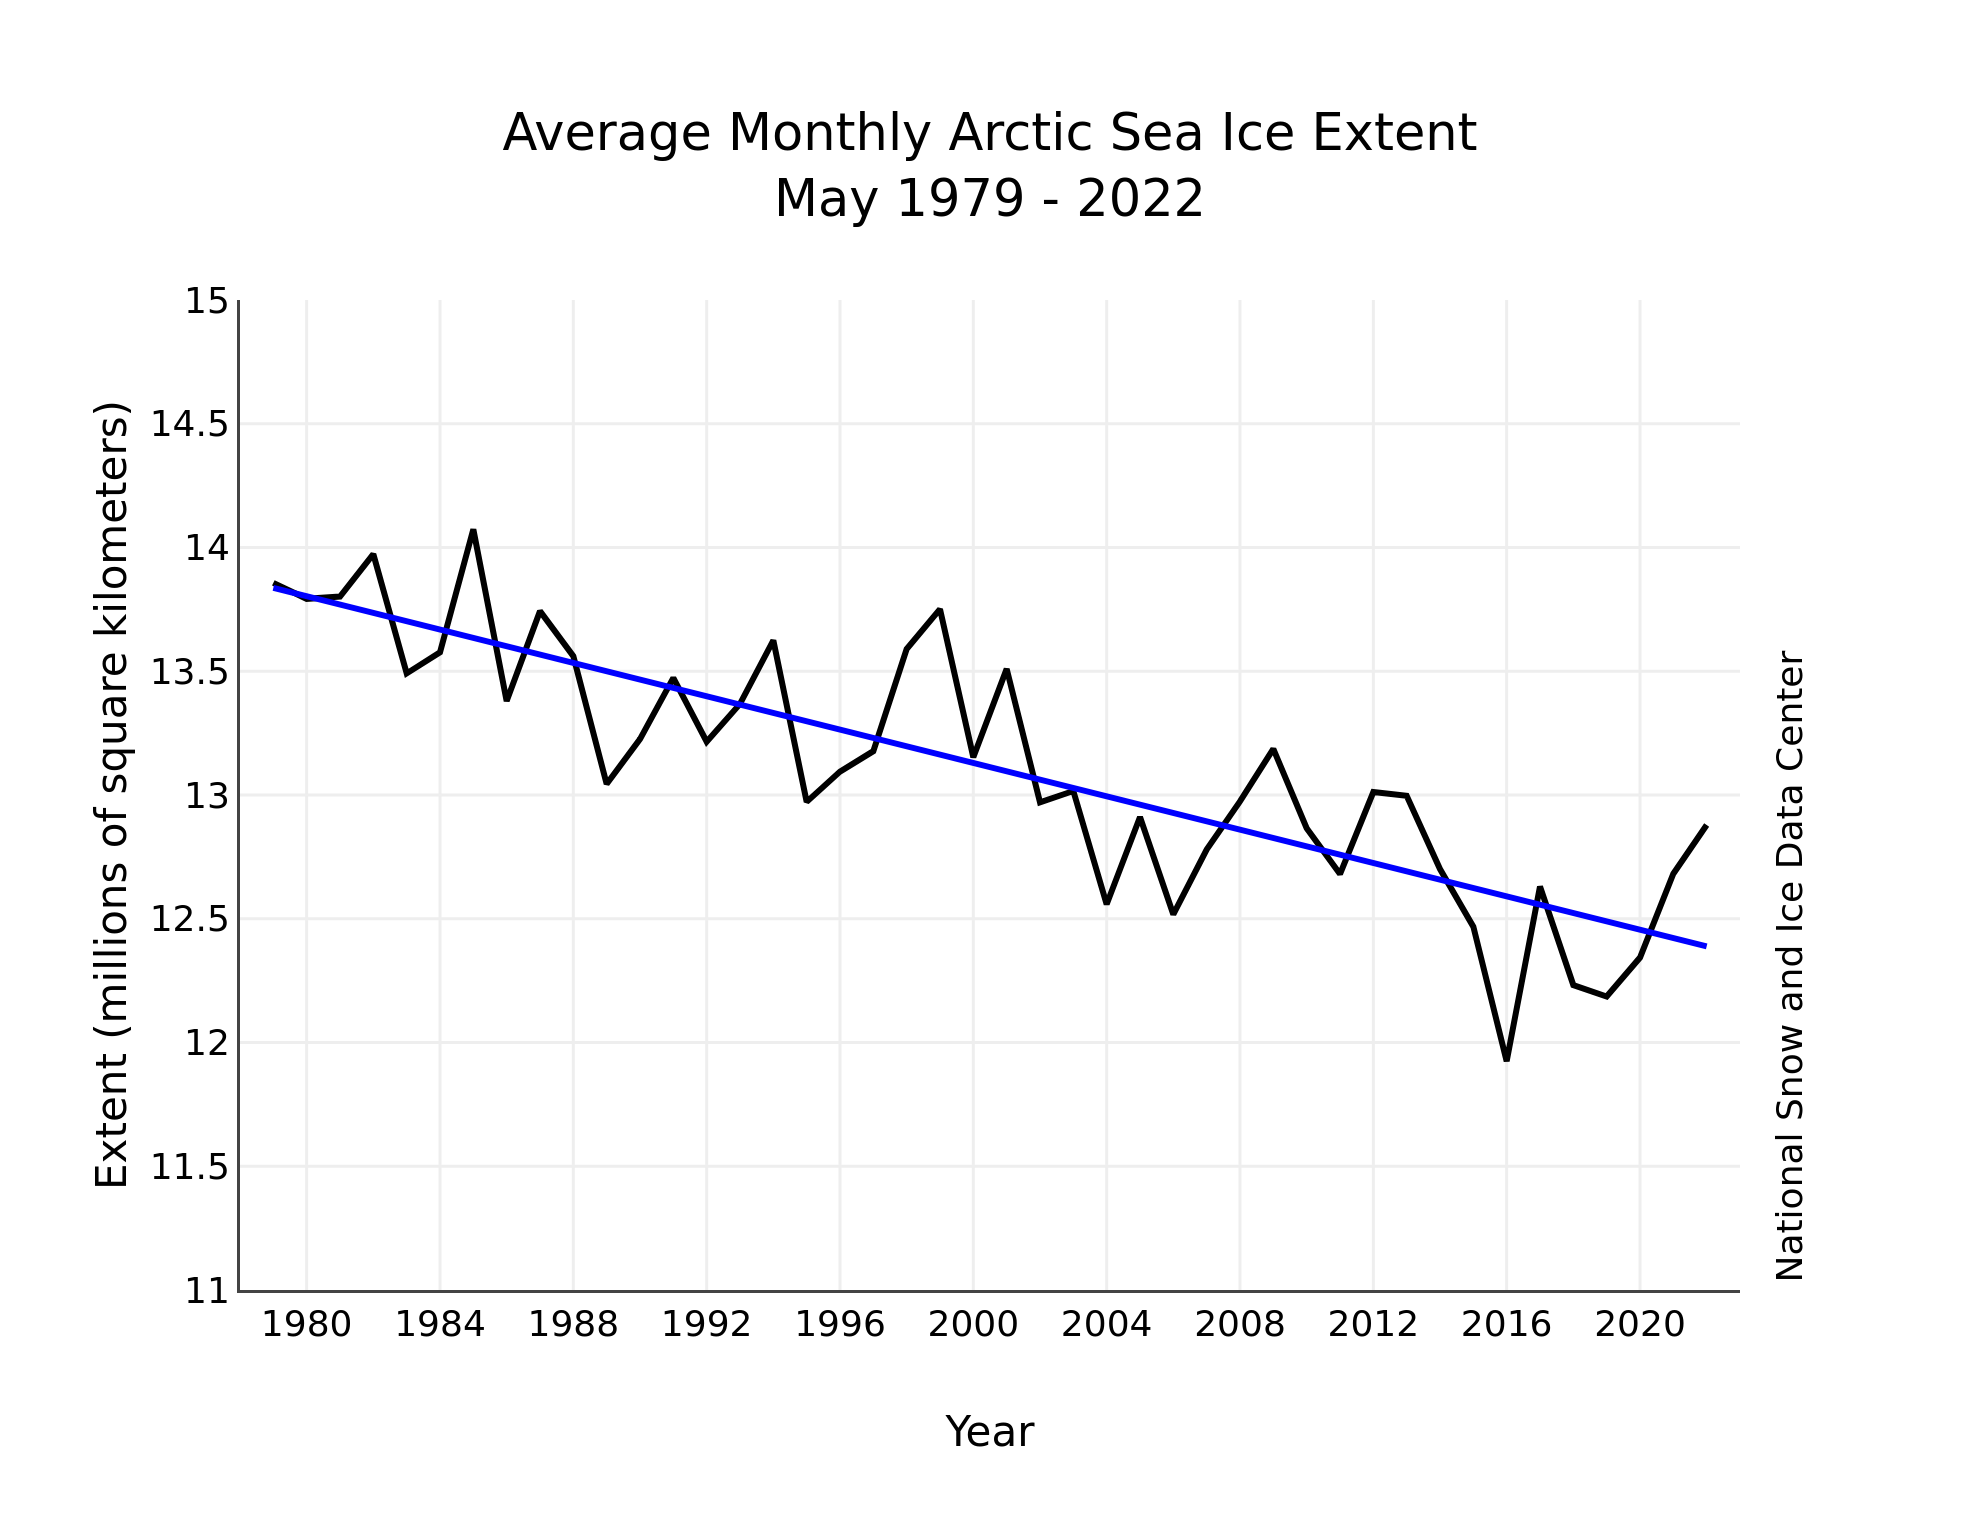
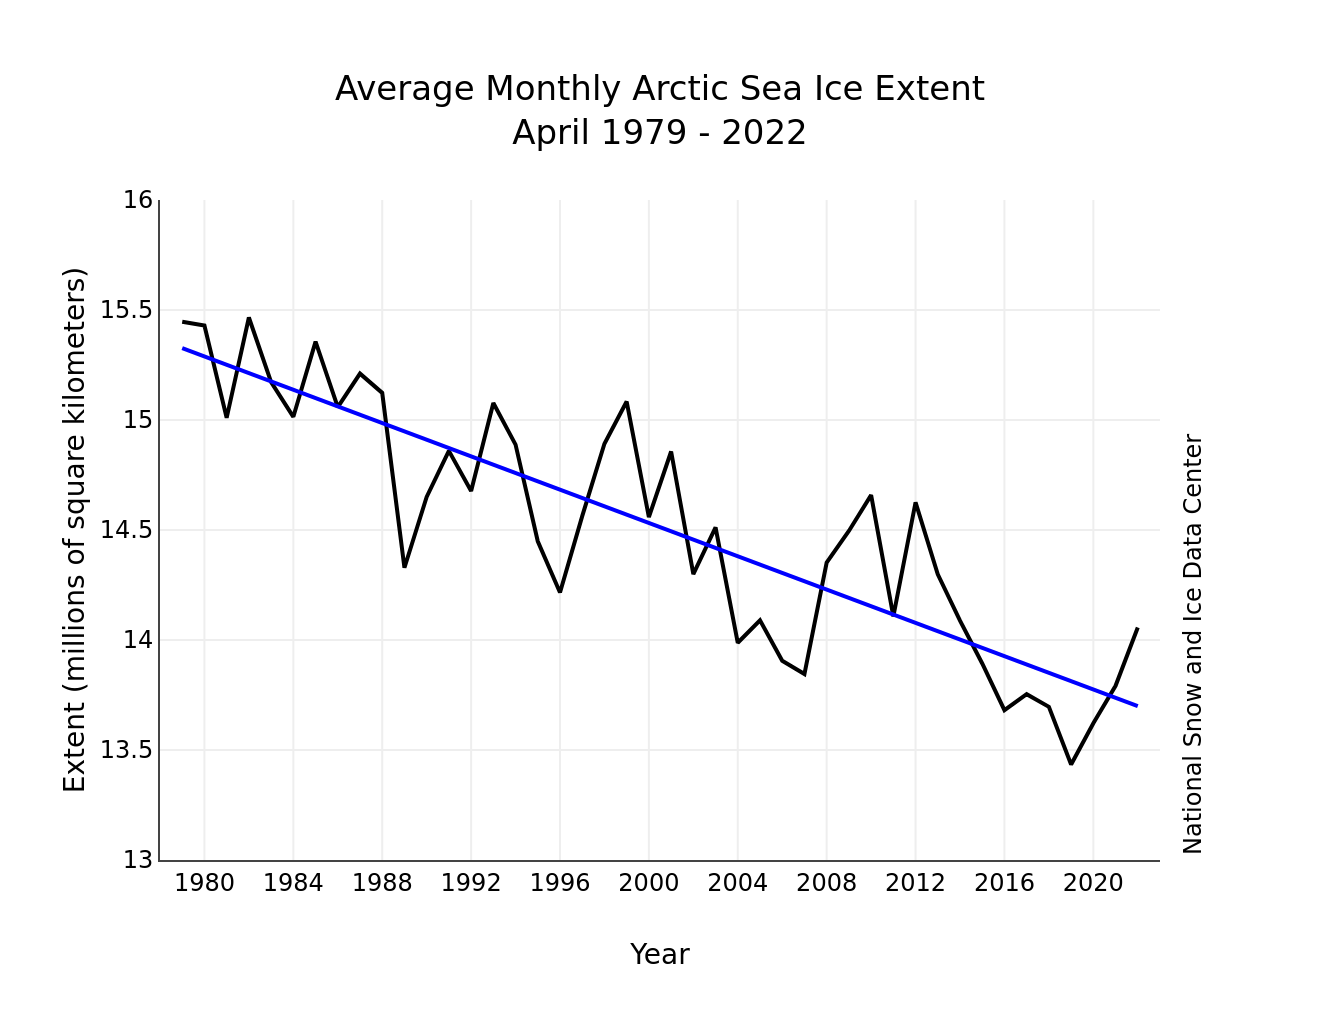
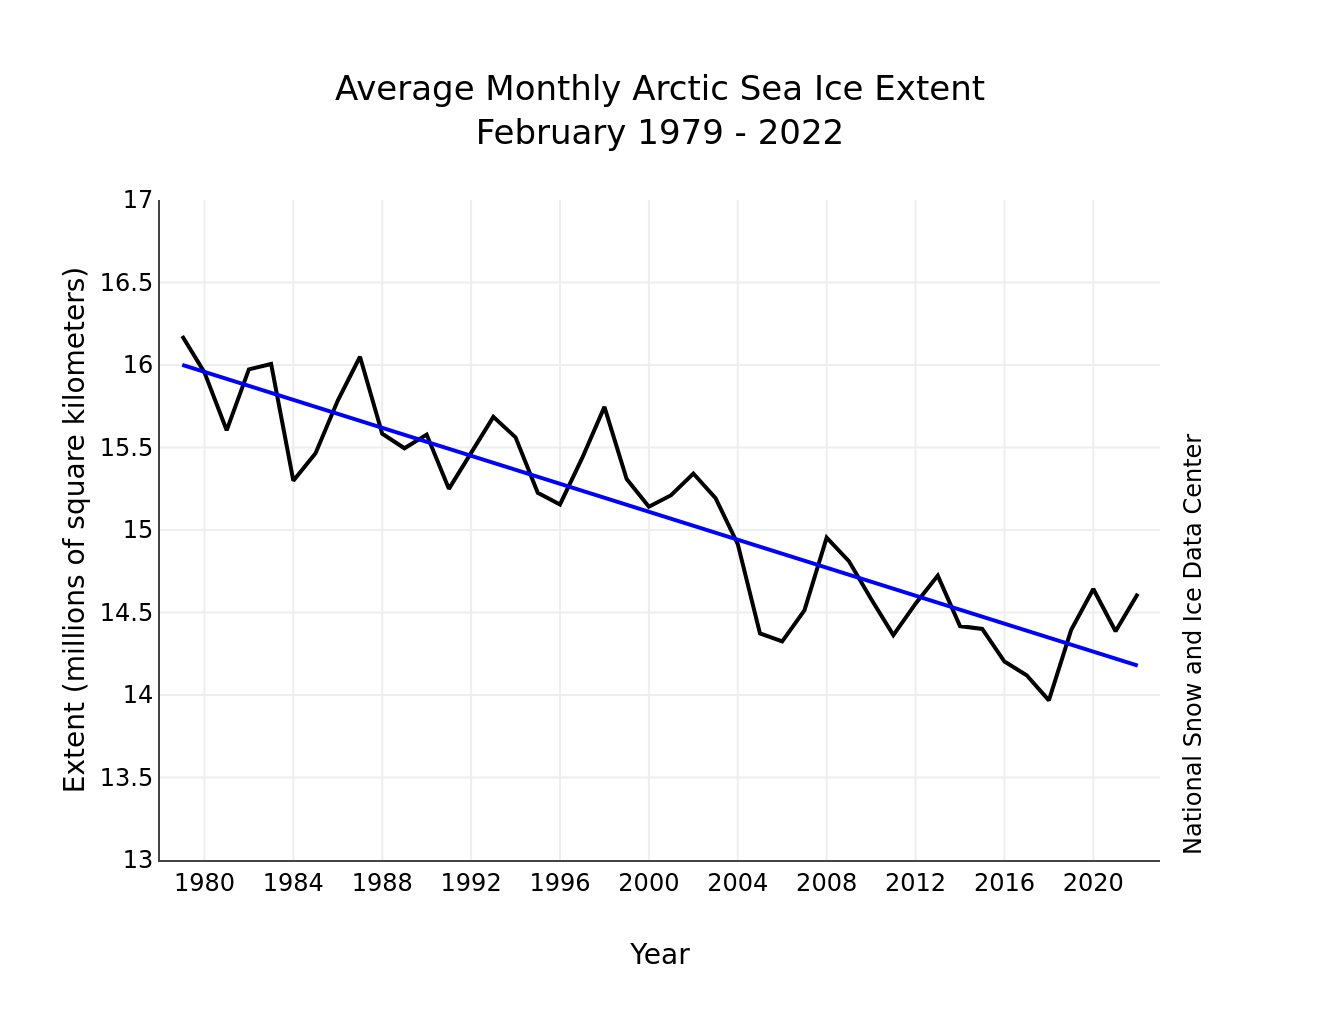
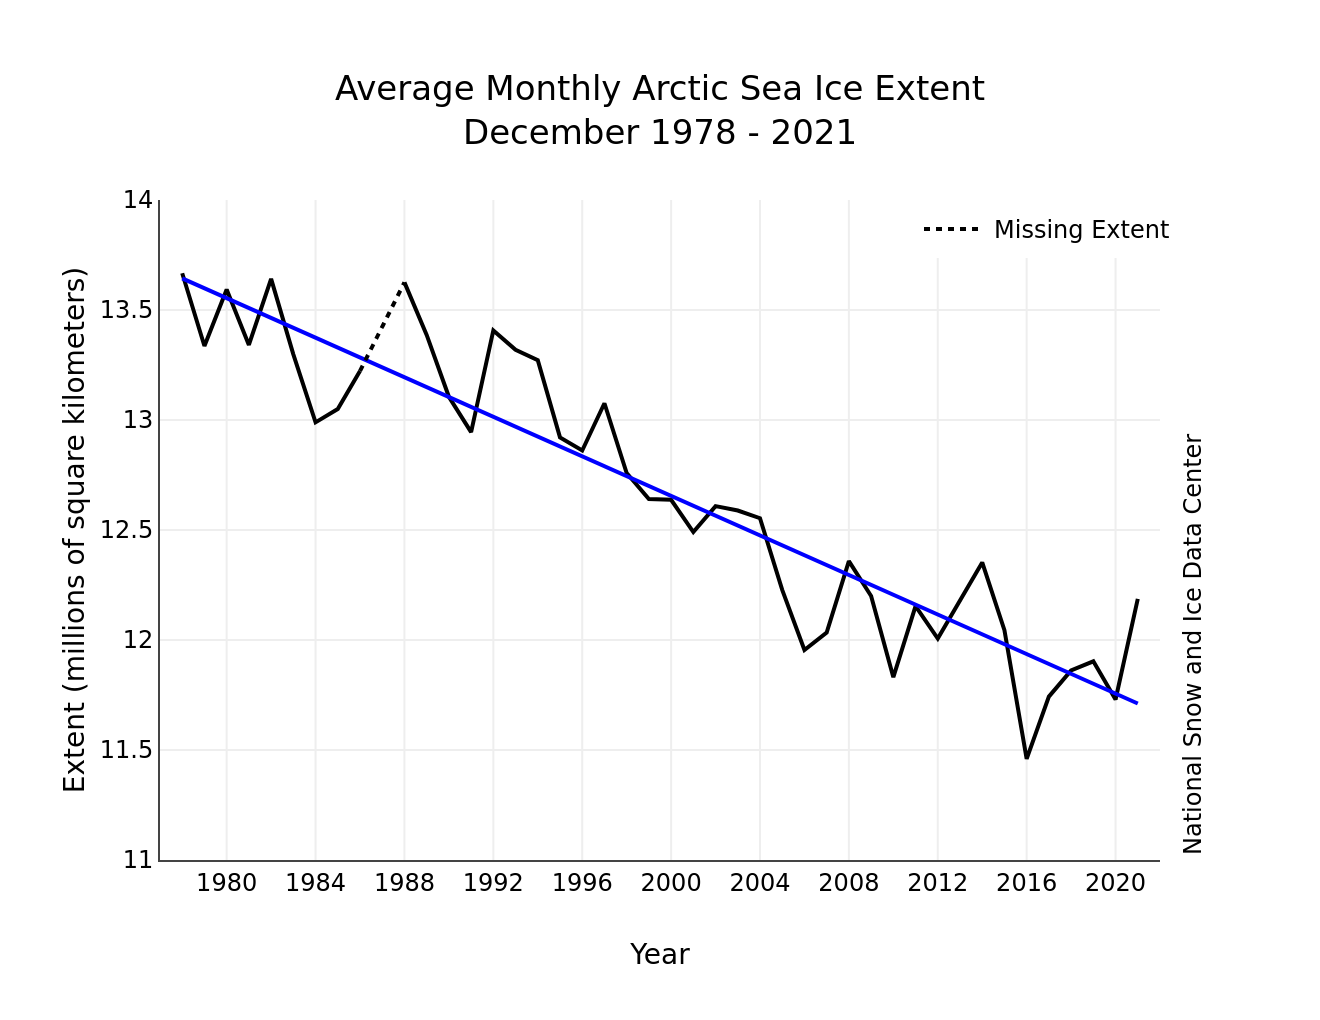
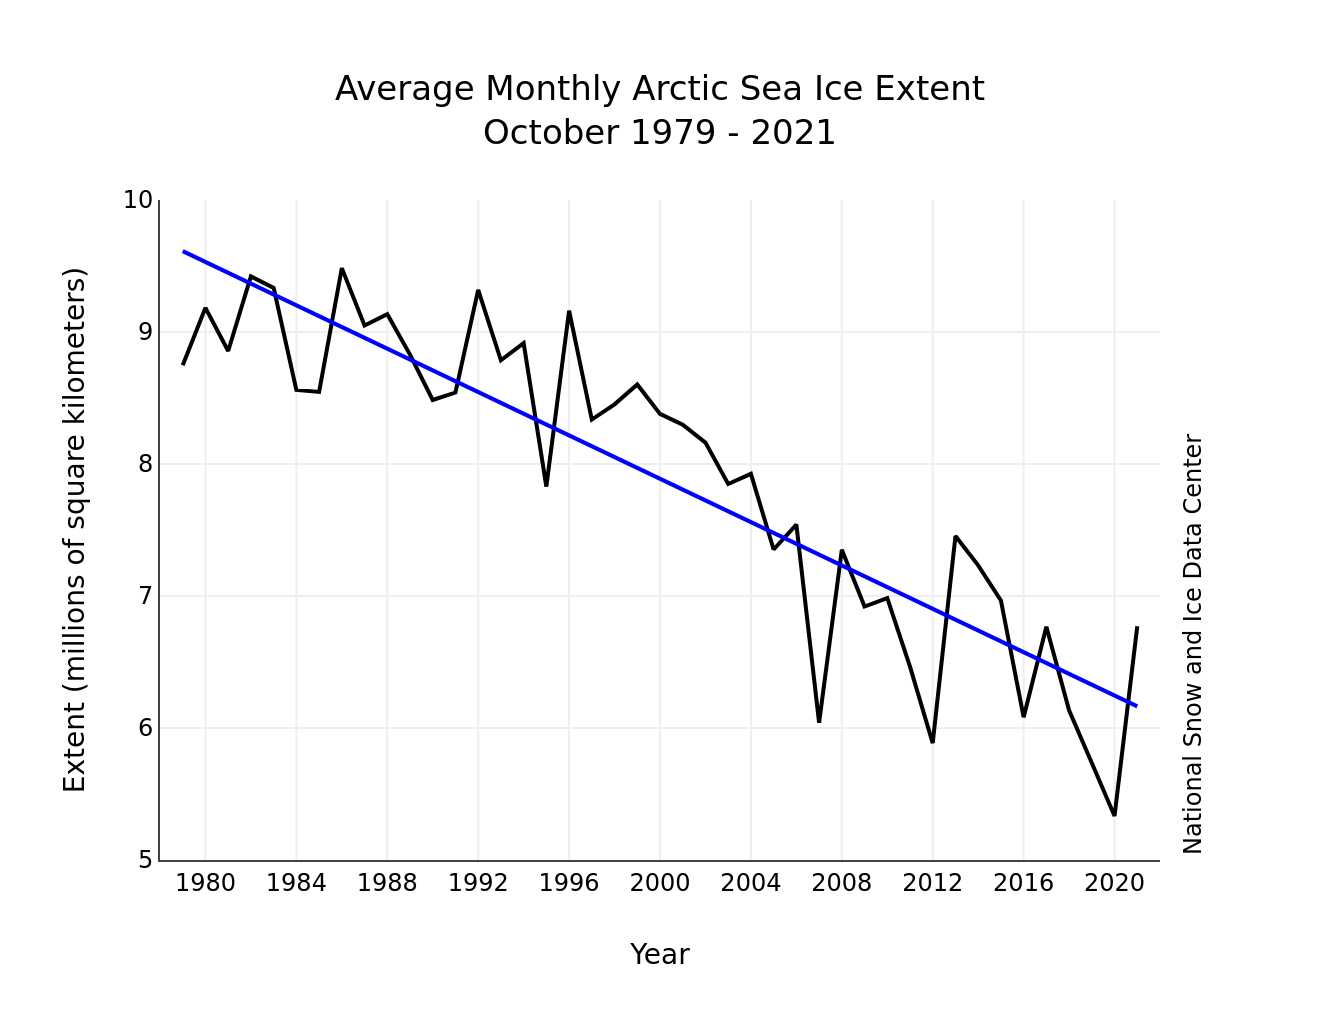
Figure 3. Monthly December ice extent for 1978 to 2022 shows a decline of 3.5 percent per decade.
Credit: National Snow and Ice Data Center
High-resolution image
The downward linear trend in December sea ice extent over the 45-year satellite record is 44,400 square kilometers (17,100 square miles) per year, or 3.5 percent per decade relative to the 1981 to 2010 average. Based on the linear trend, since 1978, November has lost 2.28 million square kilometers (880,000 square miles). This is equivalent to about 1.5 times the size of Alaska.
The year in review
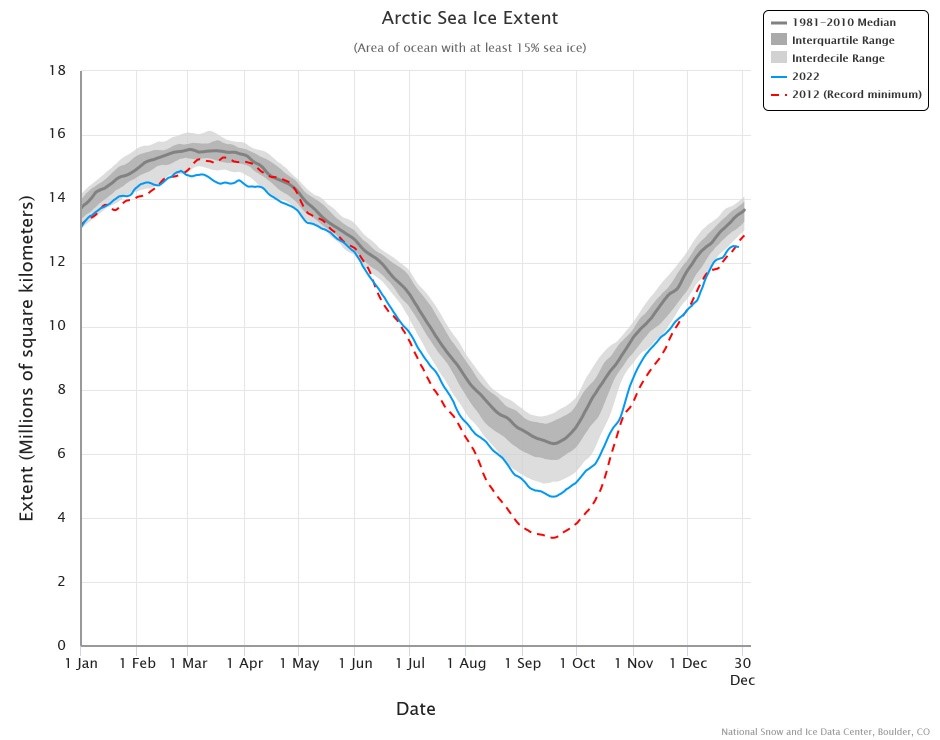
Figure 4a. The graph above shows Arctic sea ice extent for 2022 (blue line) and 2012, the record minimum year (dashed red line). The gray line shows the 1981 to 2010 median, the dark gray shaded area shows the interquartile range, and the light gray shaded area shows the interdecile range of the data. Sea Ice Index data.
Credit: National Snow and Ice Data Center
High-resolution image
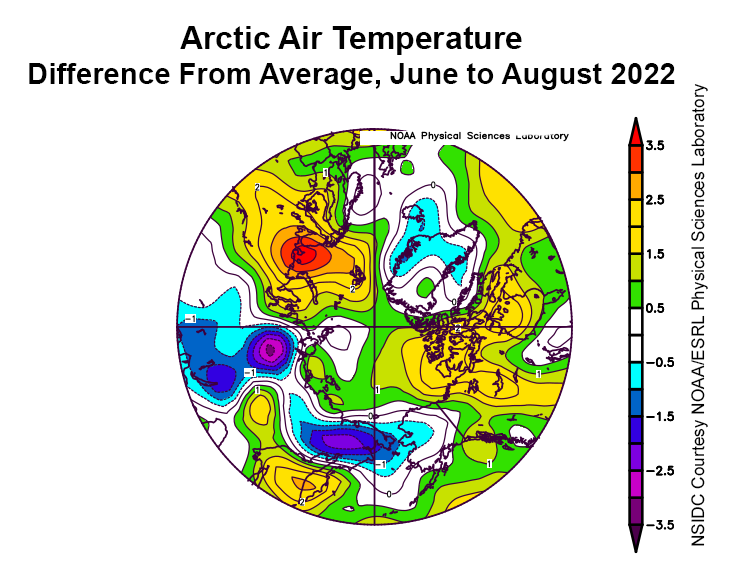
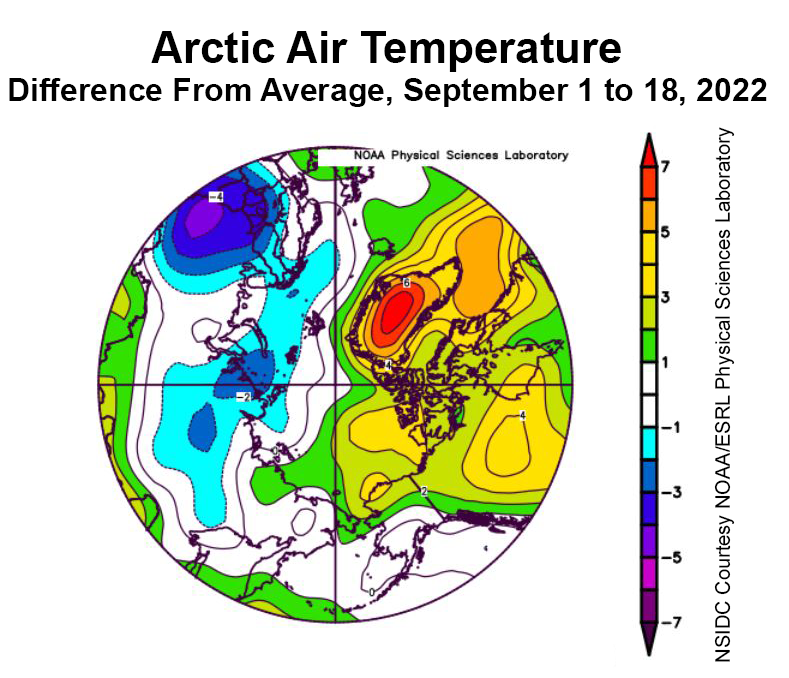
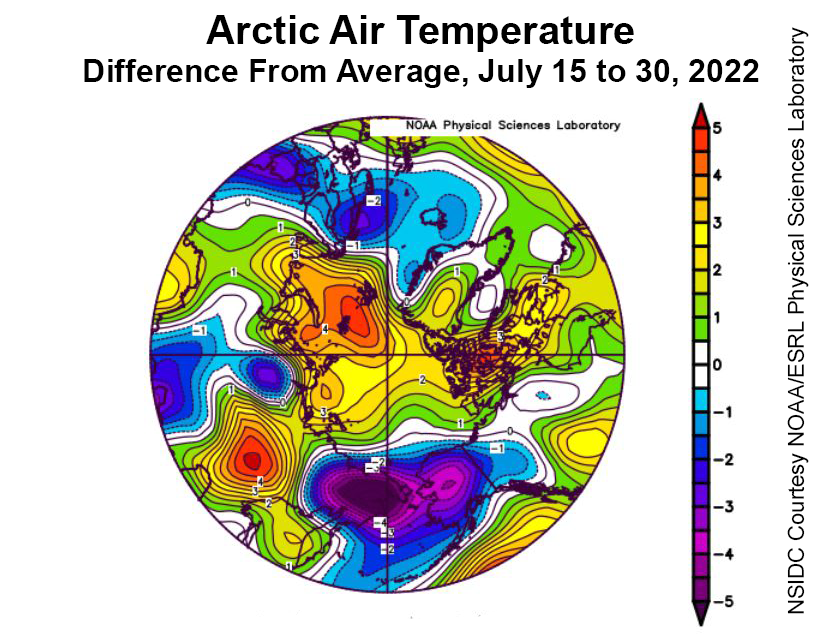
Figure 4b. This plot shows the departure from average air temperature in the Arctic at the 925 hPa level, in degrees Celsius, for summer 2022 from June 1 to August 31. Yellows and reds indicate higher than average temperatures; blues and purples indicate lower than average temperatures.
Credit: NSIDC courtesy NOAA Earth System Research Laboratory Physical Sciences Laboratory
High-resolution image
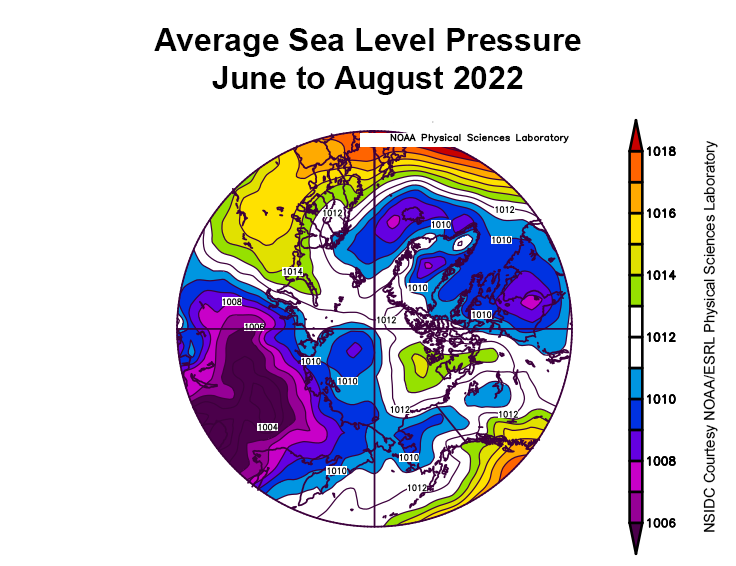
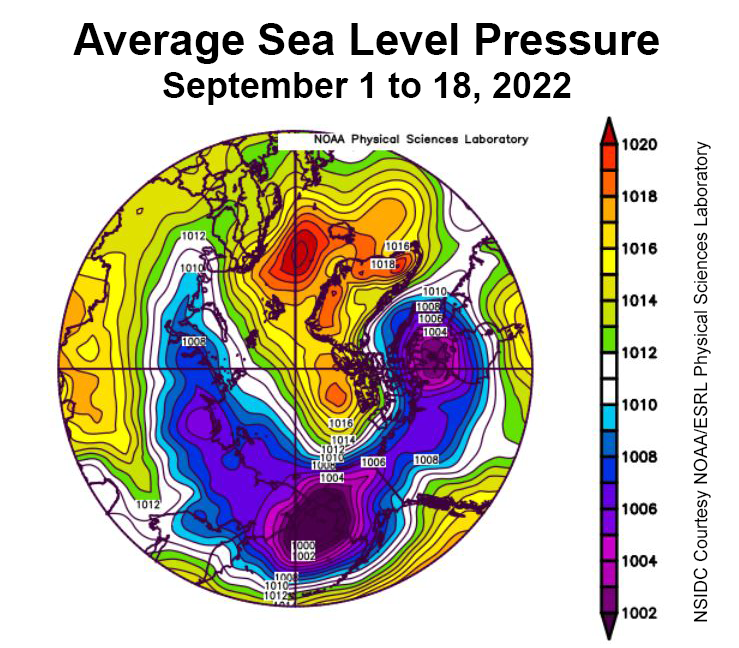
Figure 4c. This plot shows average sea level pressure in the Arctic in millibars for summer 2022 from June 1 to August 31. Yellows and reds indicate high air pressure; blues and purples indicate low pressure.
Credit: NSIDC courtesy NOAA Earth System Research Laboratory Physical Sciences Laboratory
High-resolution image
While Arctic sea ice extent was below average over the entire year (Figure 4a), no records were set, and the September average sea ice extent, at 4.87 million square kilometers (1.88 million square miles), tied with 2010 as only the eleventh lowest in the satellite record. The September daily minimum extent, set on September 18 at 4.67 million square kilometers (1.80 million square miles), tied with 2017 and 2018 for tenth lowest in the satellite record. The September minimum extent is strongly dependent on summer weather conditions, and summer average air temperatures, while above climatological averages over most of the Arctic Ocean, were not extreme (Figure 4b), generally from 1.5 to 2.5 degrees Celsius (3 to 4.5 degrees Fahrenheit) above the 1991 to 2020 baseline. The summer average sea level pressure pattern was in turn quite flat, meaning light winds. A pronounced Beaufort Sea High, which generally favors low September sea ice extent, is notably lacking (Figure 4c).
Ice down under
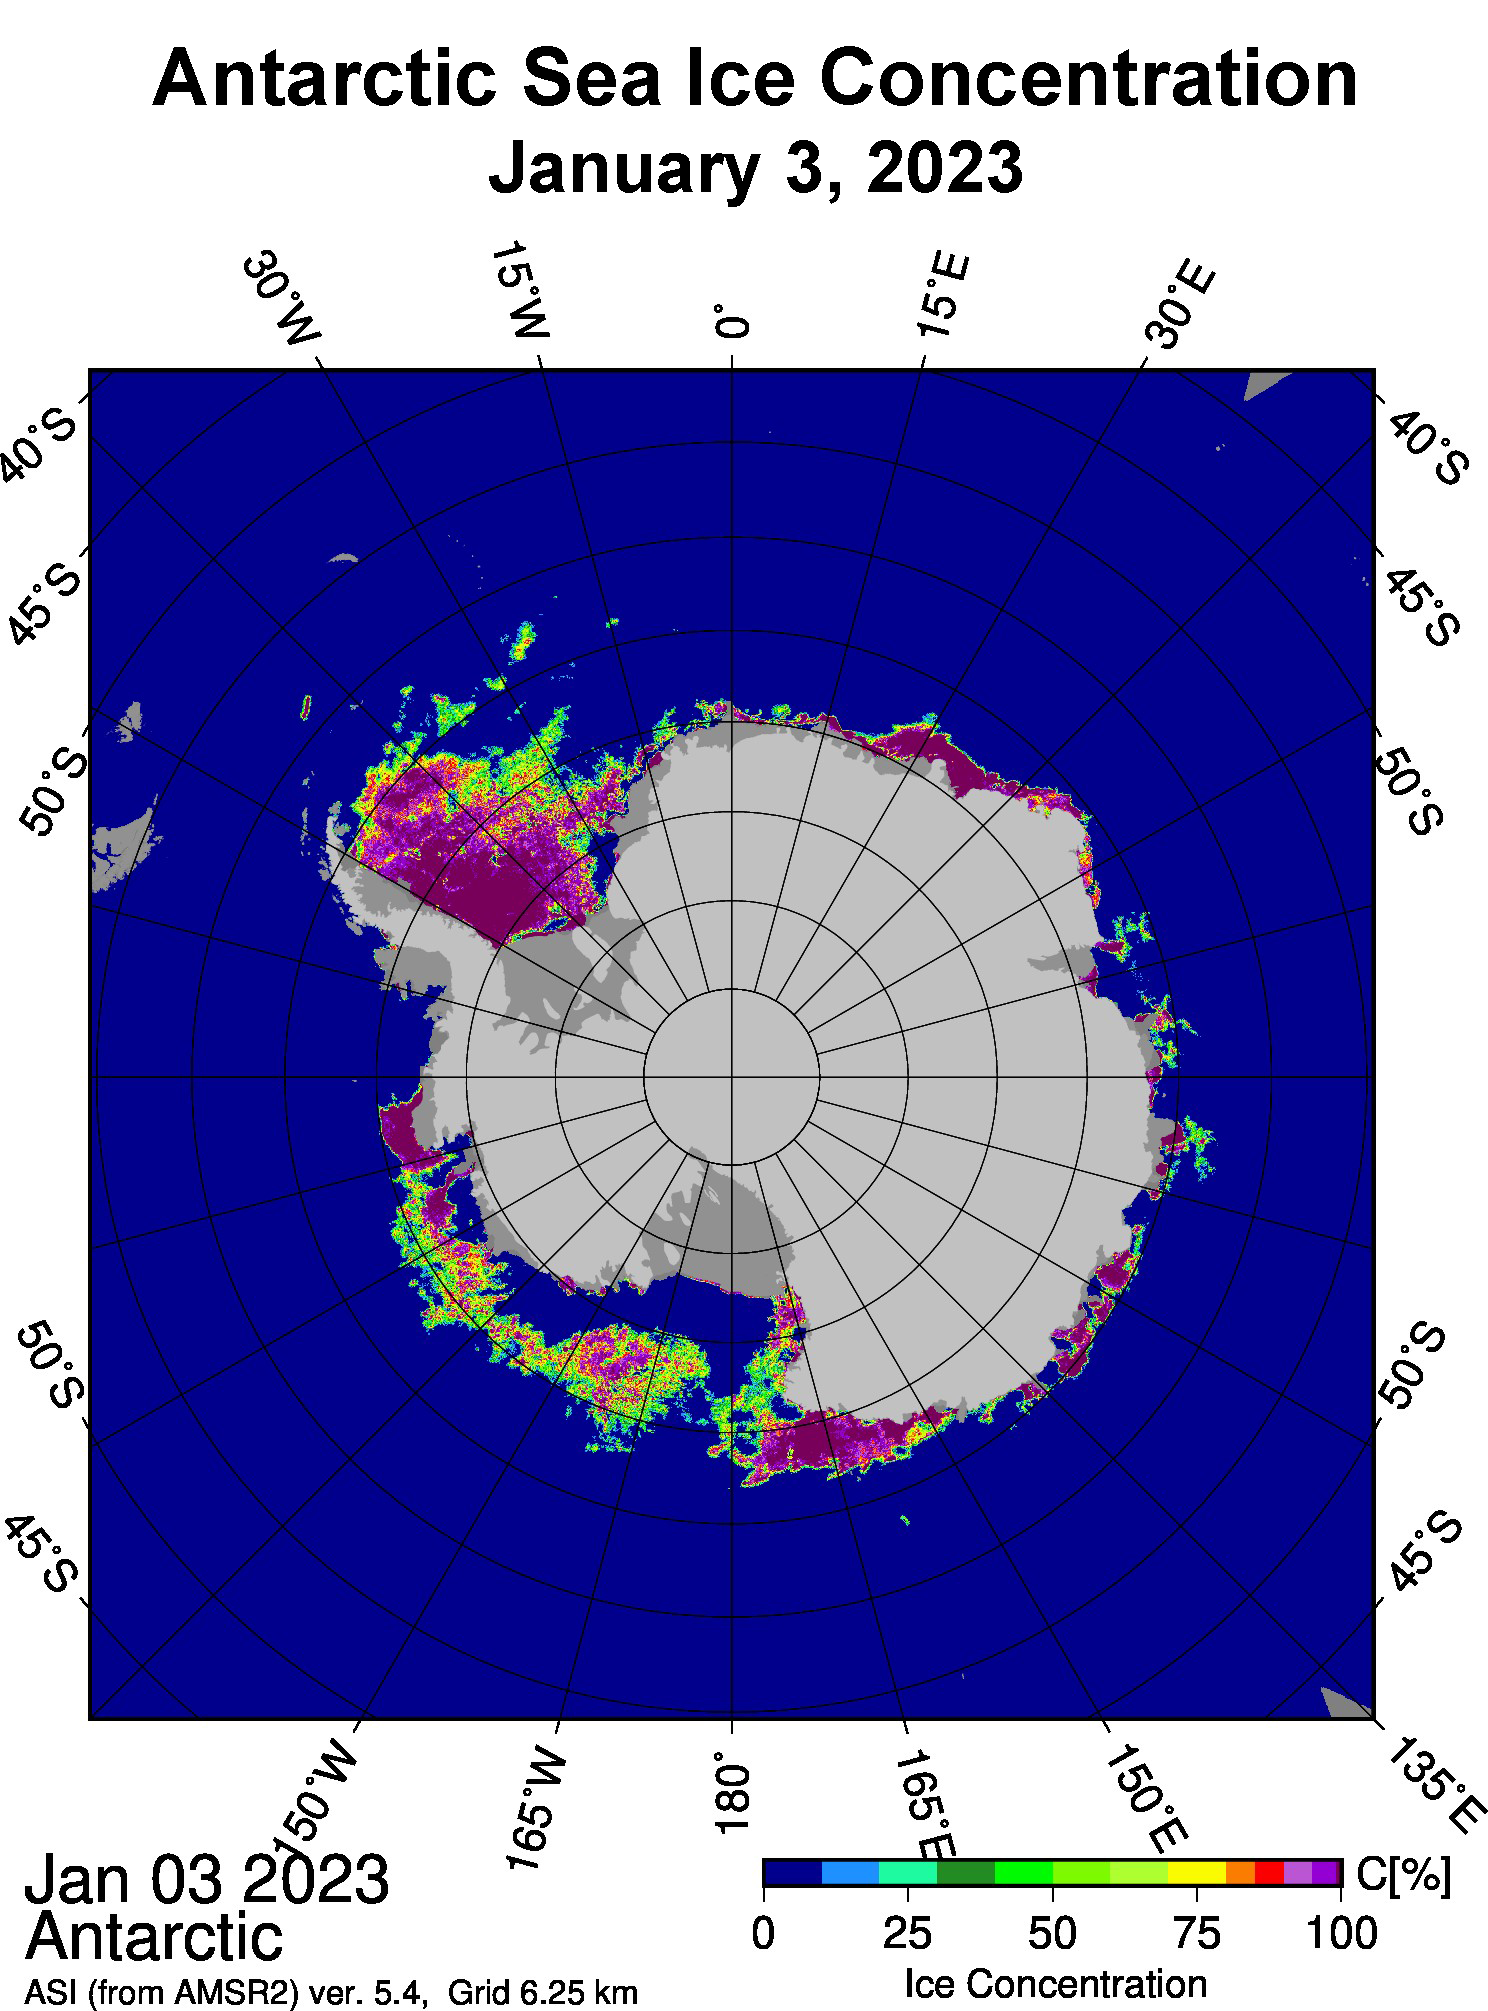
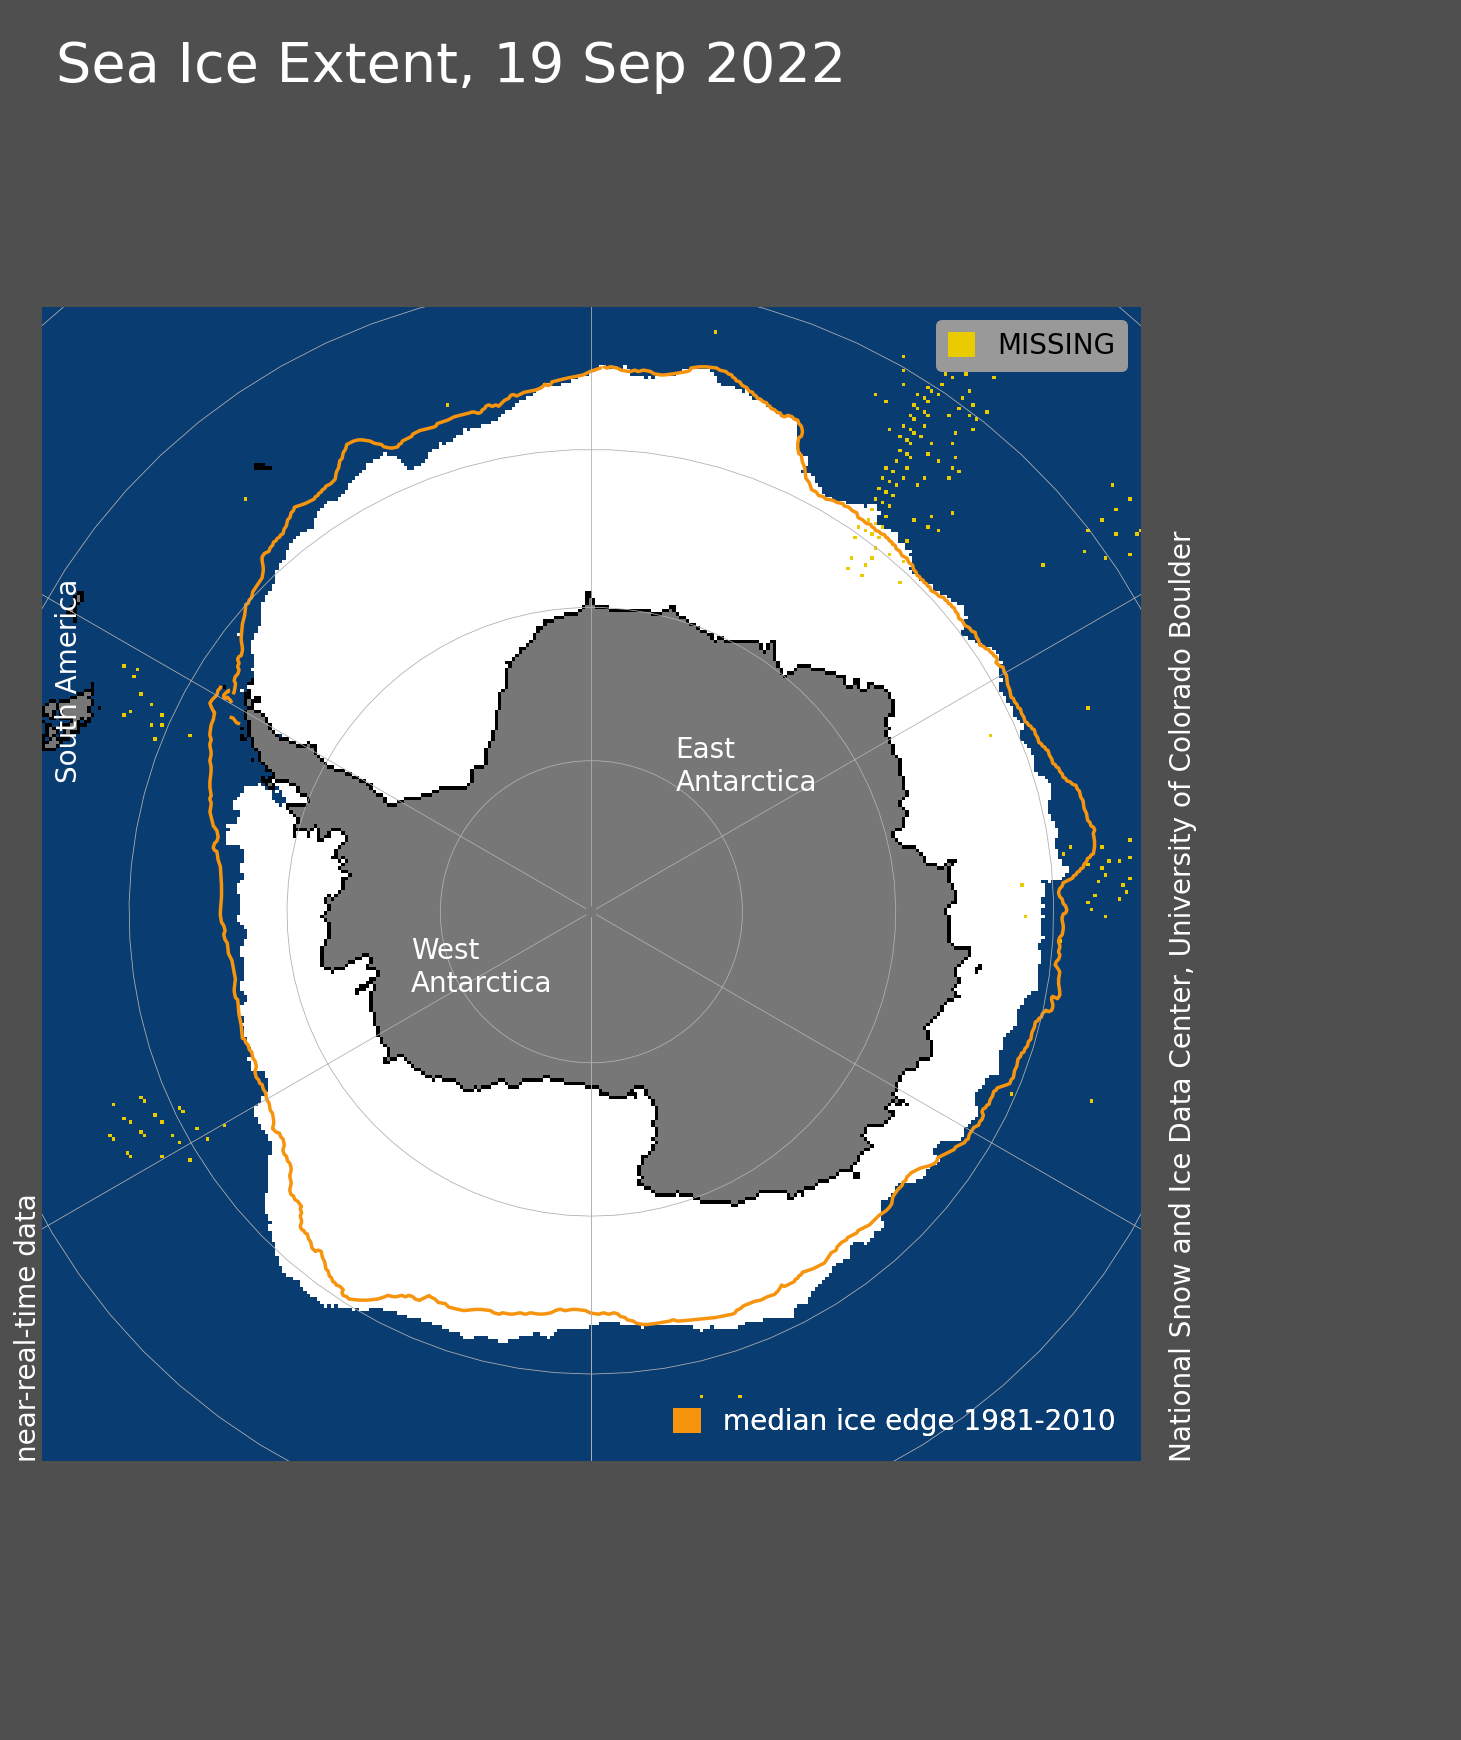
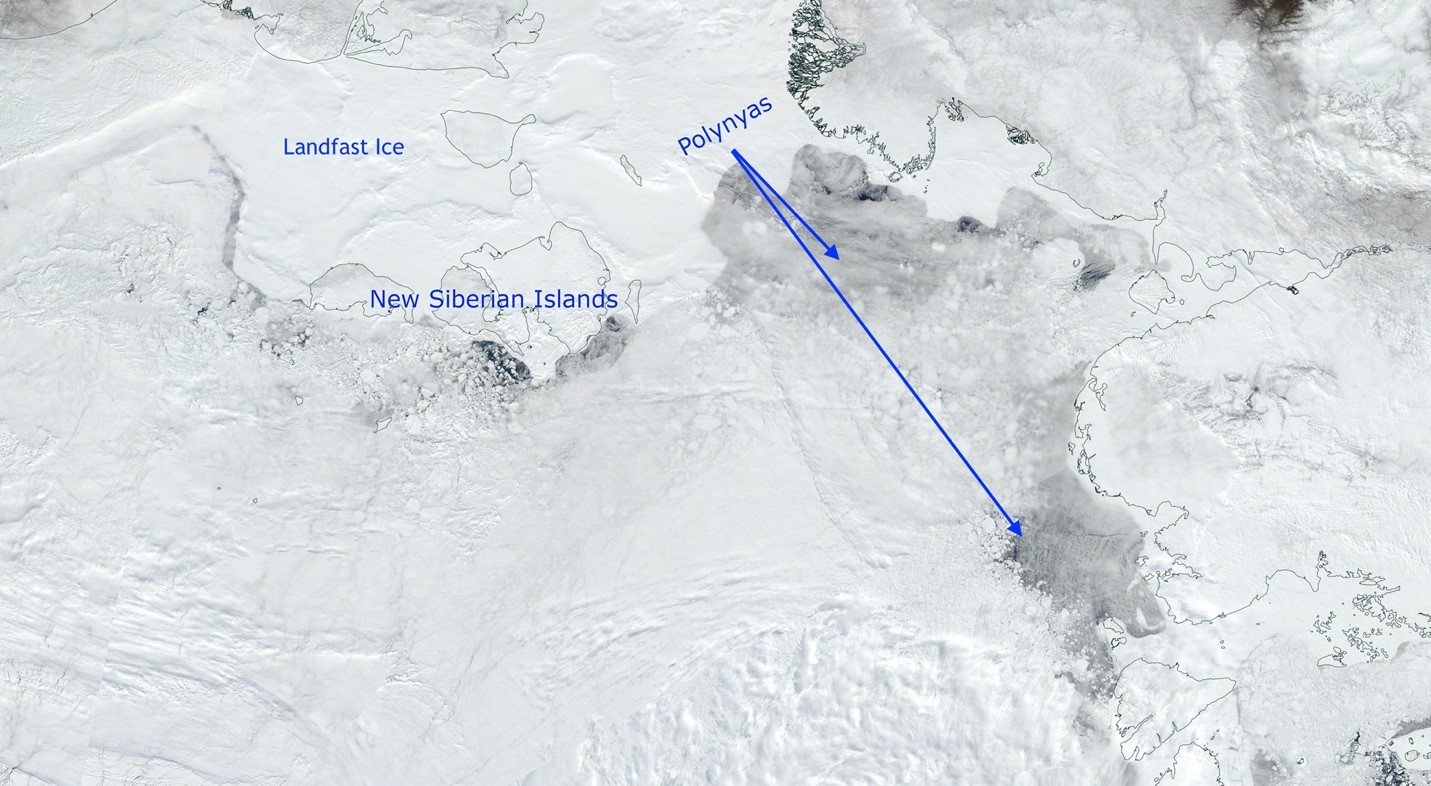
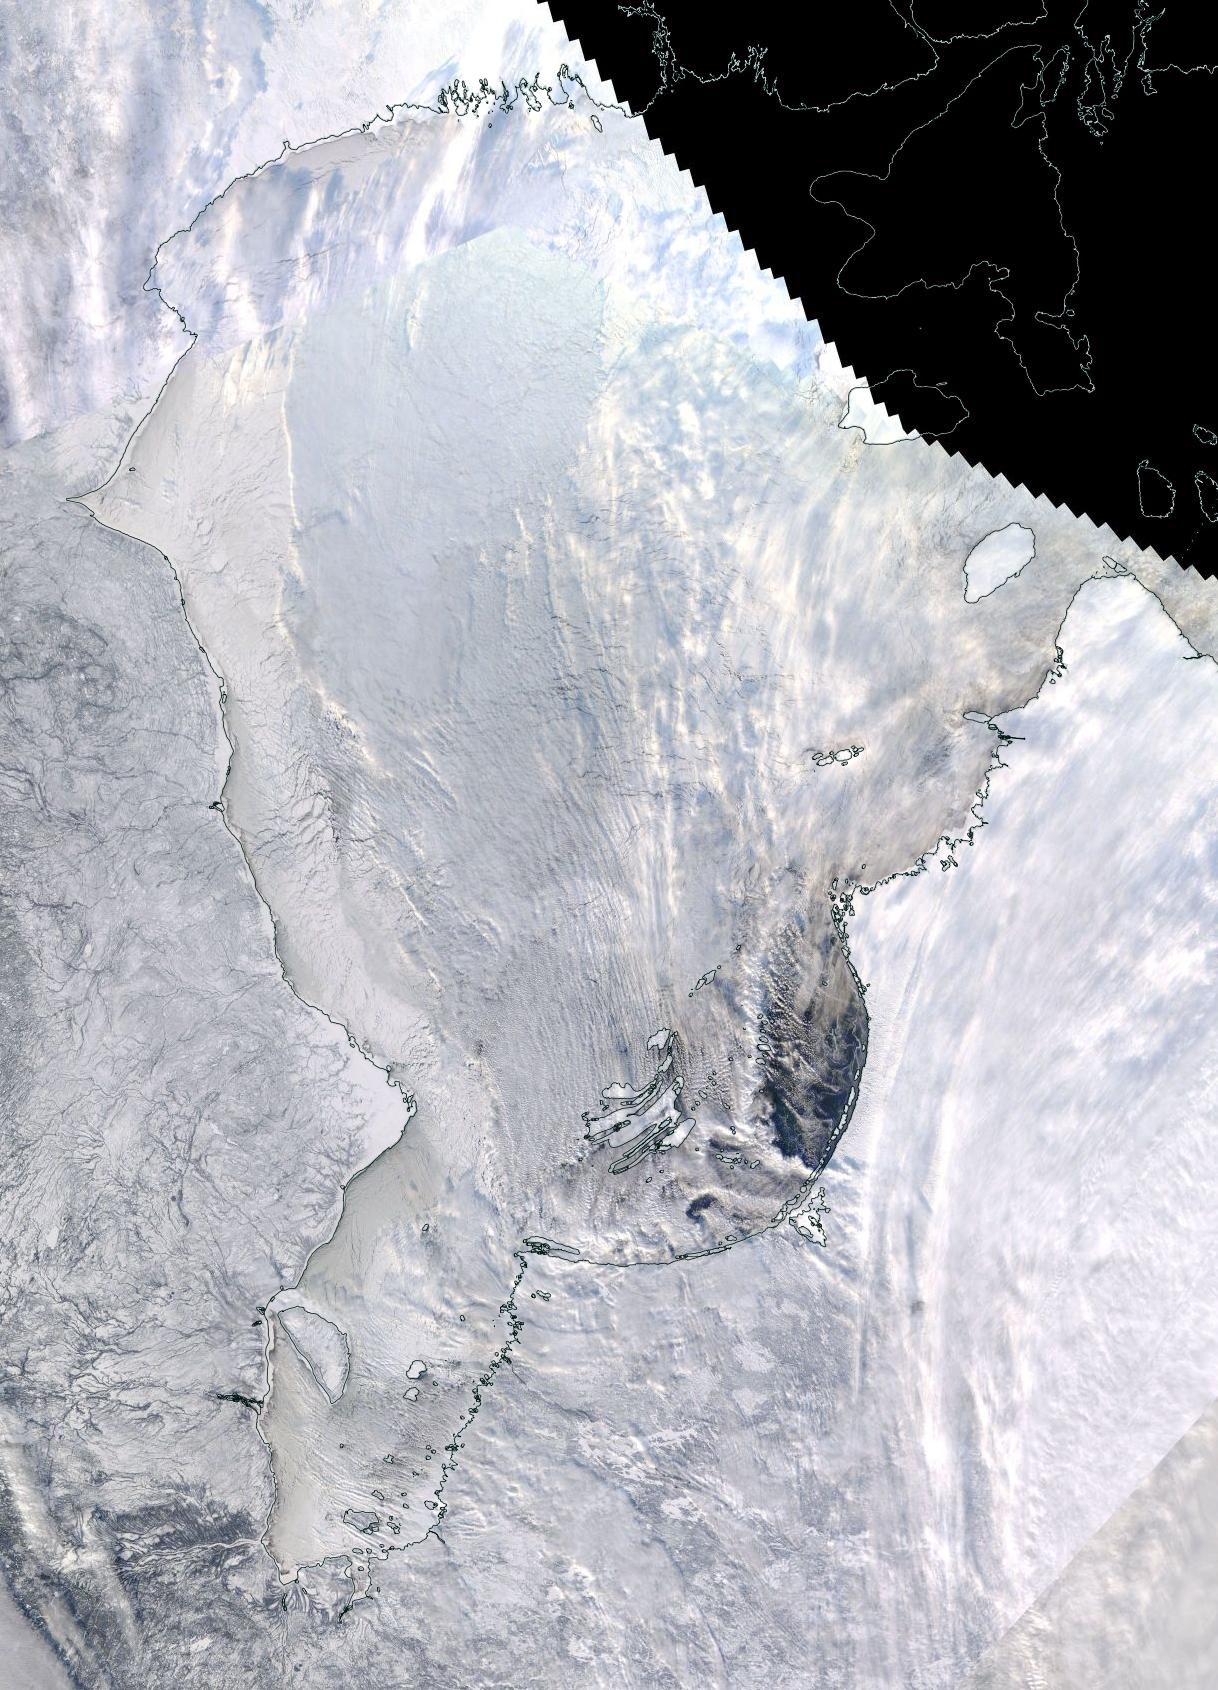
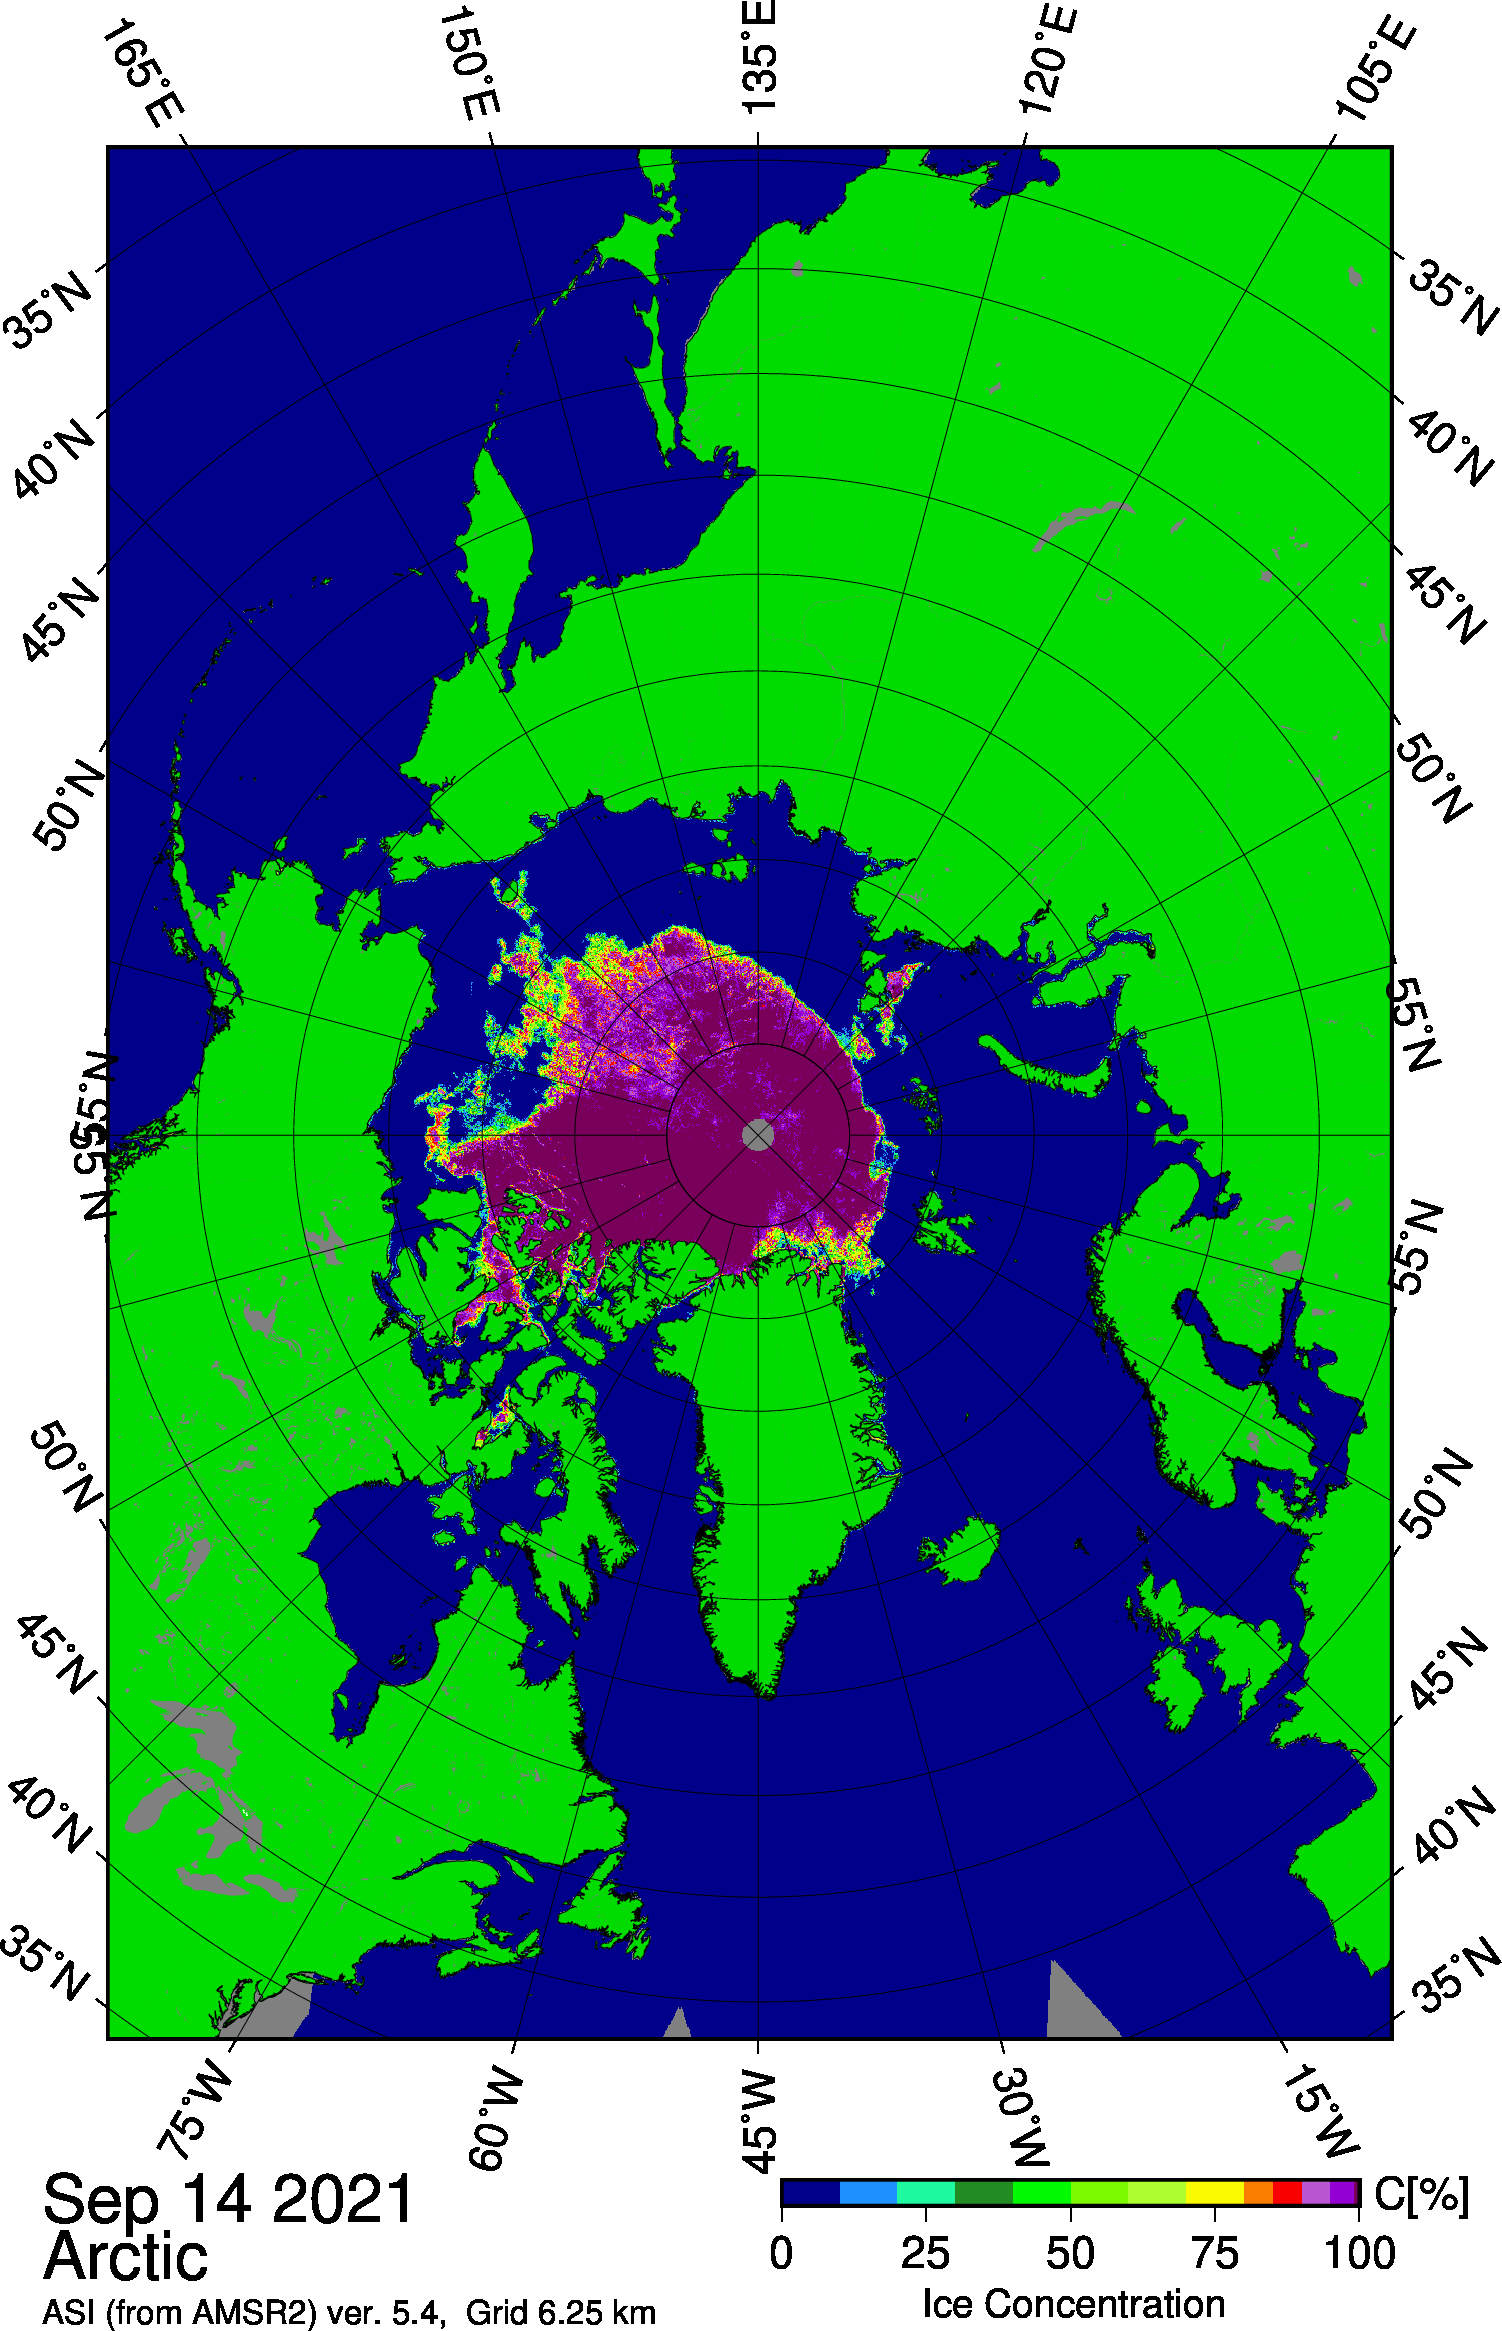
Figure 5a. This map from January 3, 2023, shows a large polynya that now spans the Ross Sea and much of the western Amundsen Sea, as well as polynyas that have appeared in Pine Island Bay and the southeastern Weddell Sea. Sea ice concentration data are from the Japan Aerospace Exploration Agency Advanced Microwave Scanning Radiometer 2 (AMSR2) imagery.
Credit: University of Bremen
High-resolution image
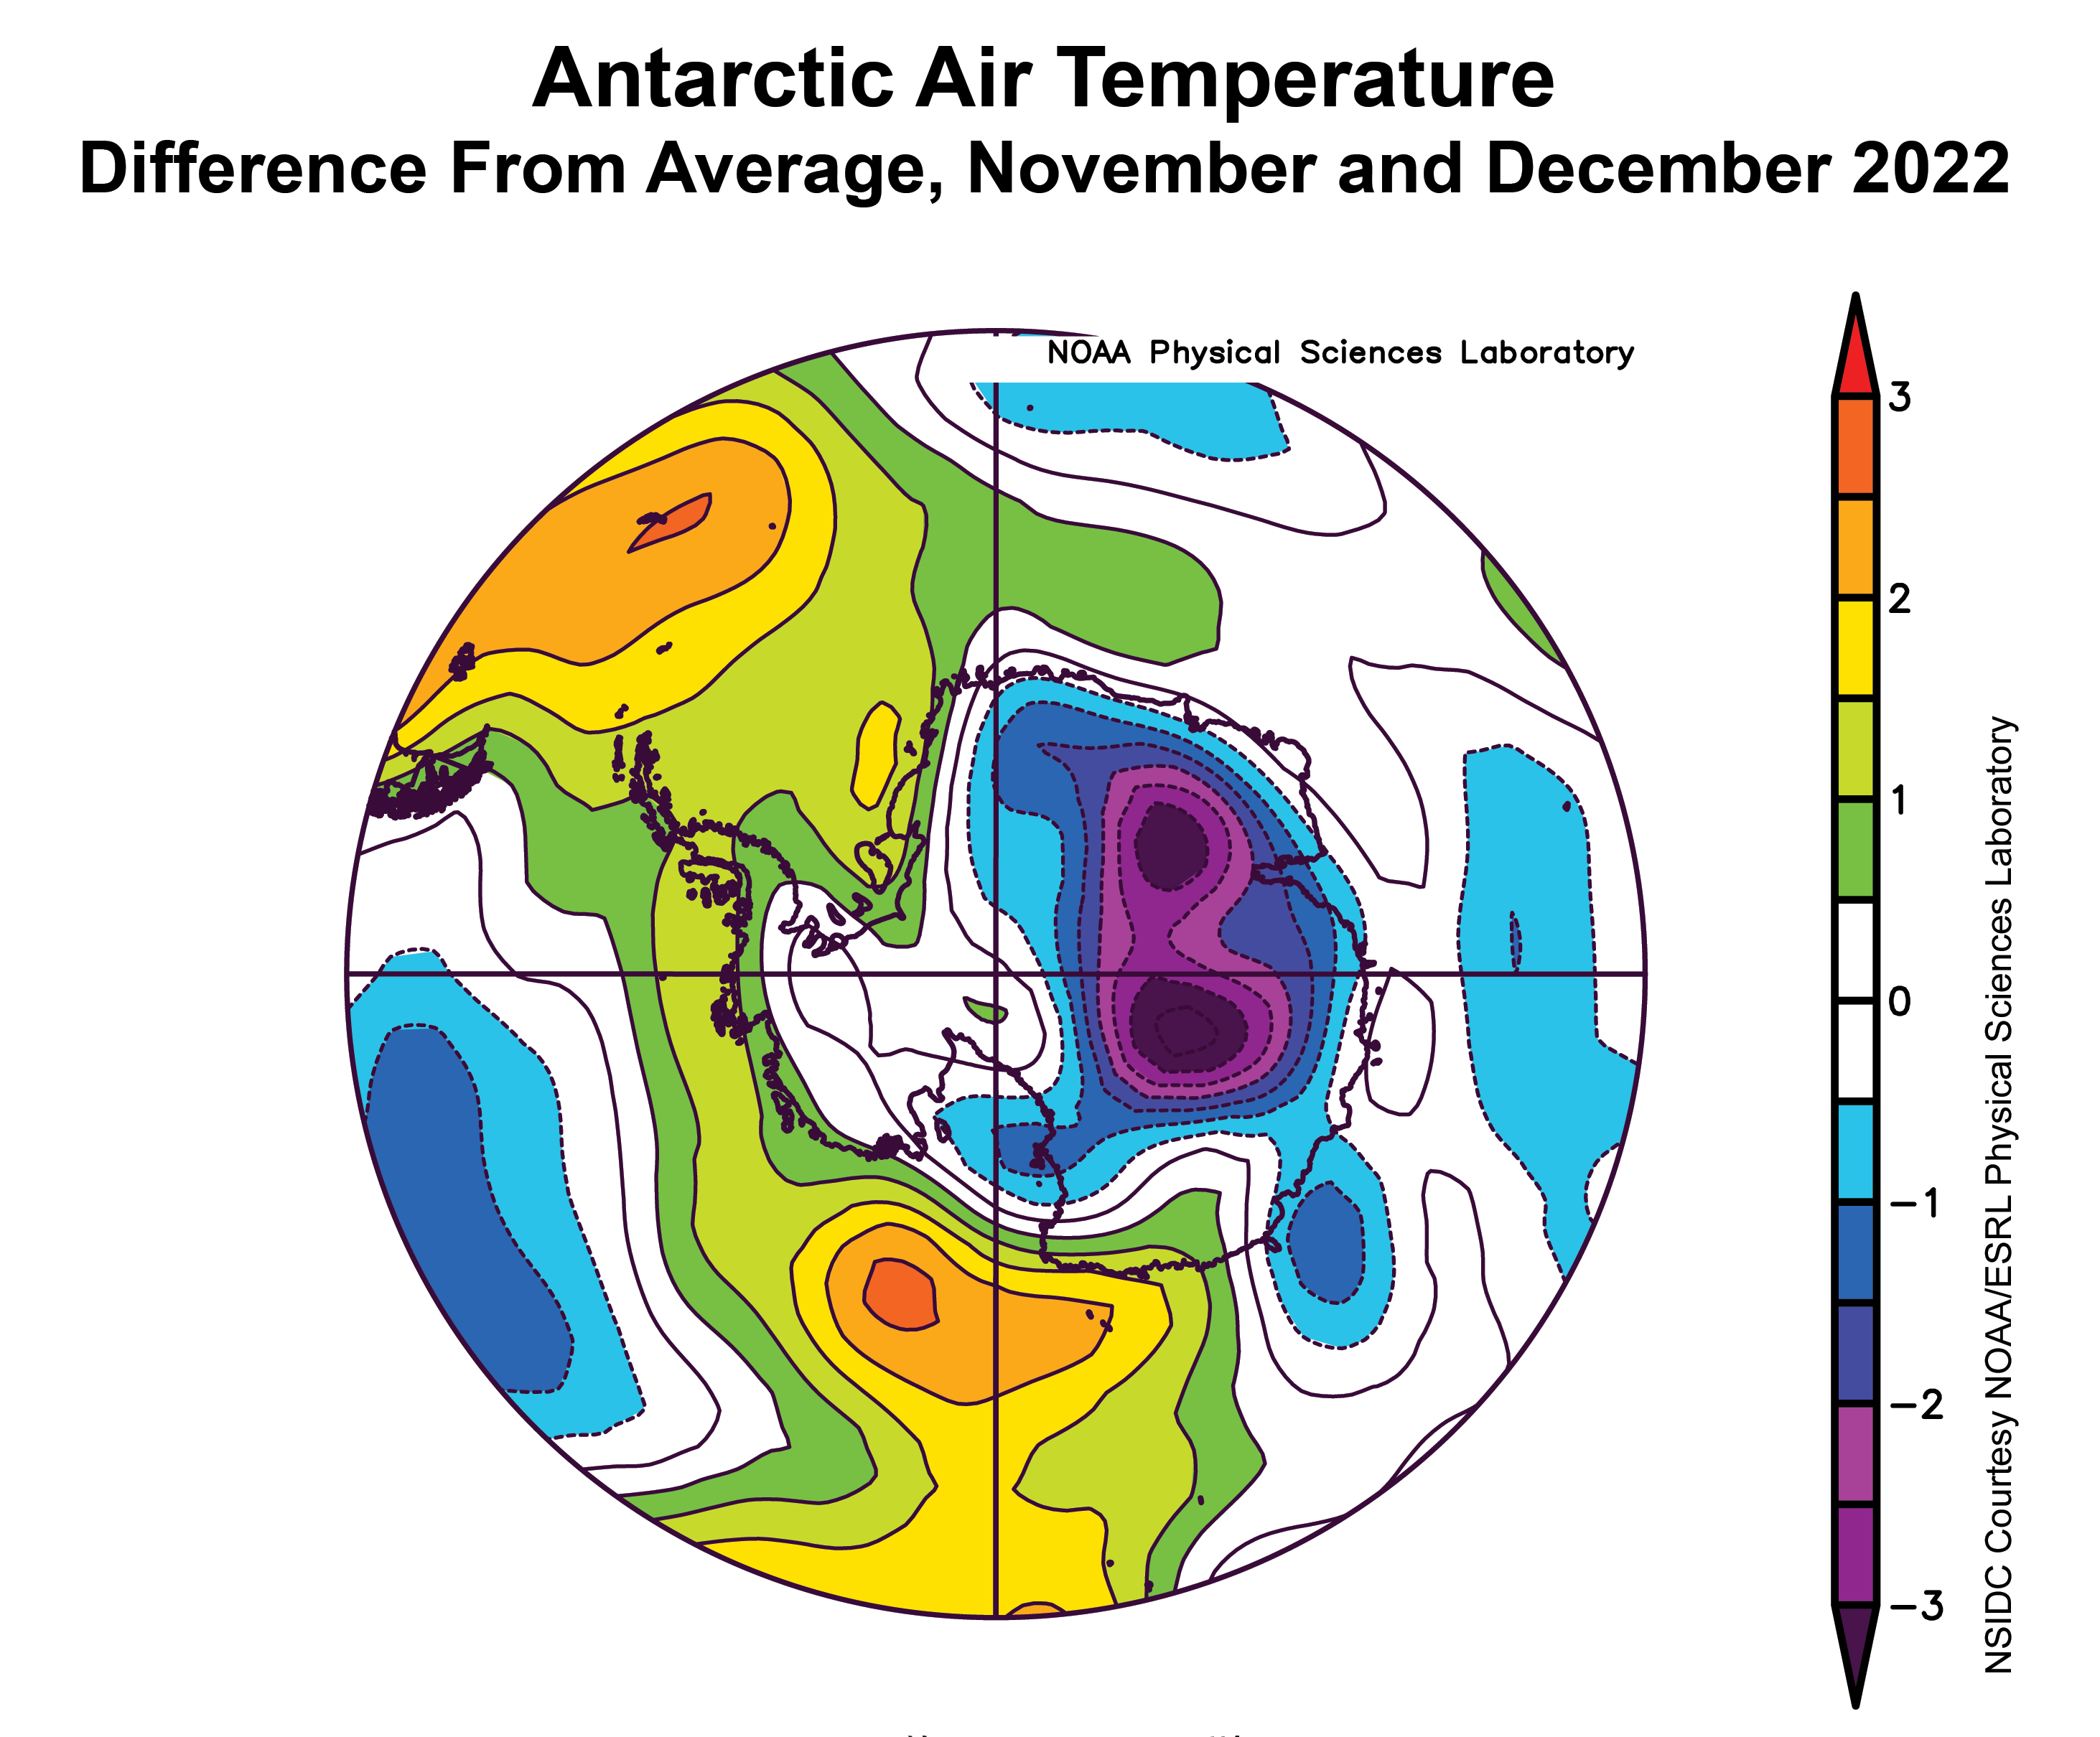
Figure 5b. This plot shows the departure from average air temperature in the Antarctic at the 925 hPa level, in degrees Celsius, for November and December 2022. Yellows and reds indicate higher than average temperatures; blues and purples indicate lower than average temperatures.
Credit: NSIDC courtesy NOAA Earth System Research Laboratory Physical Sciences Laboratory
High-resolution image
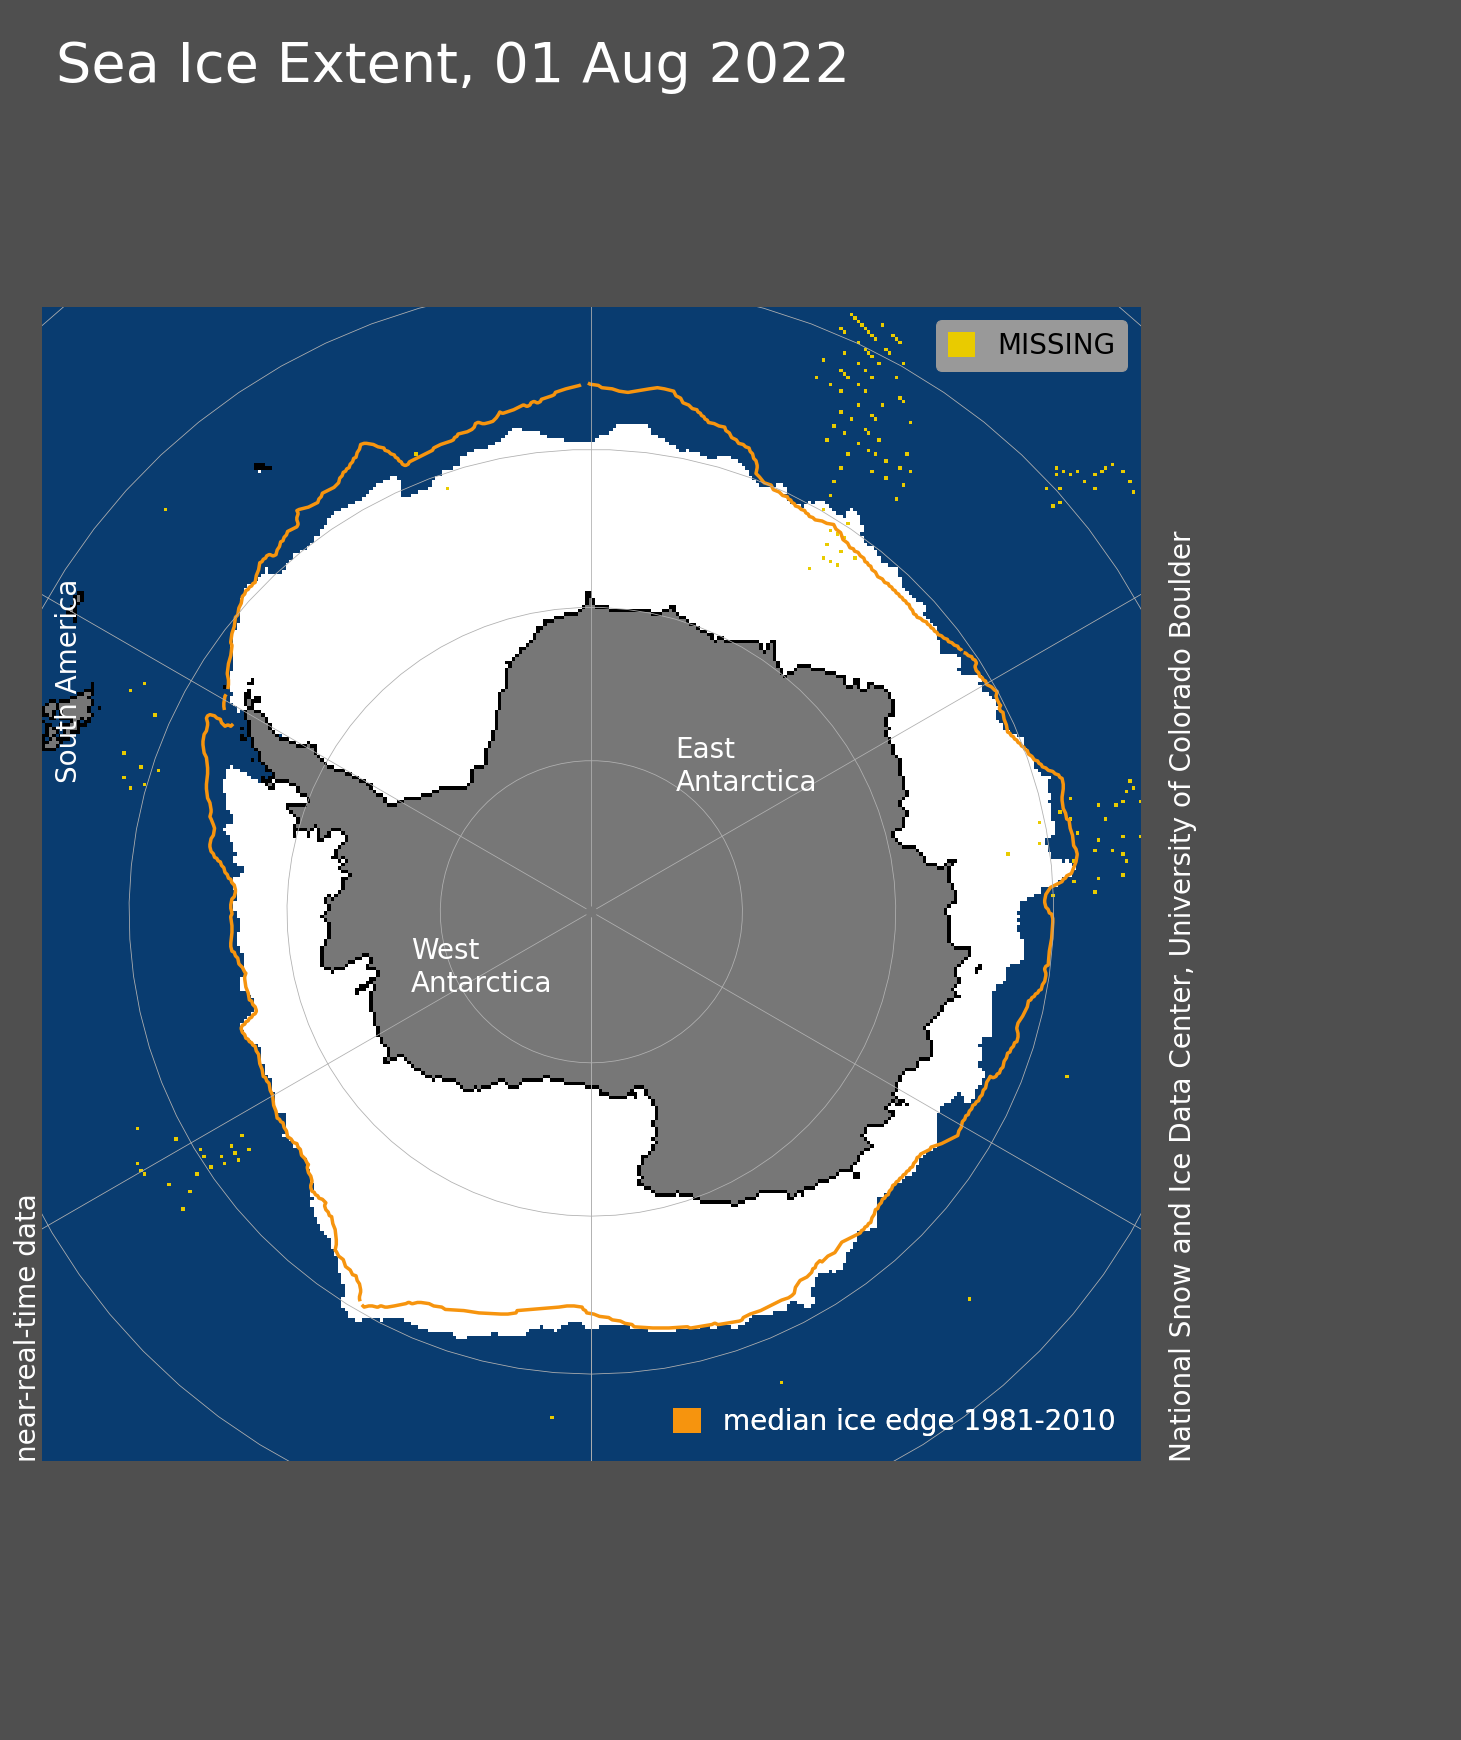
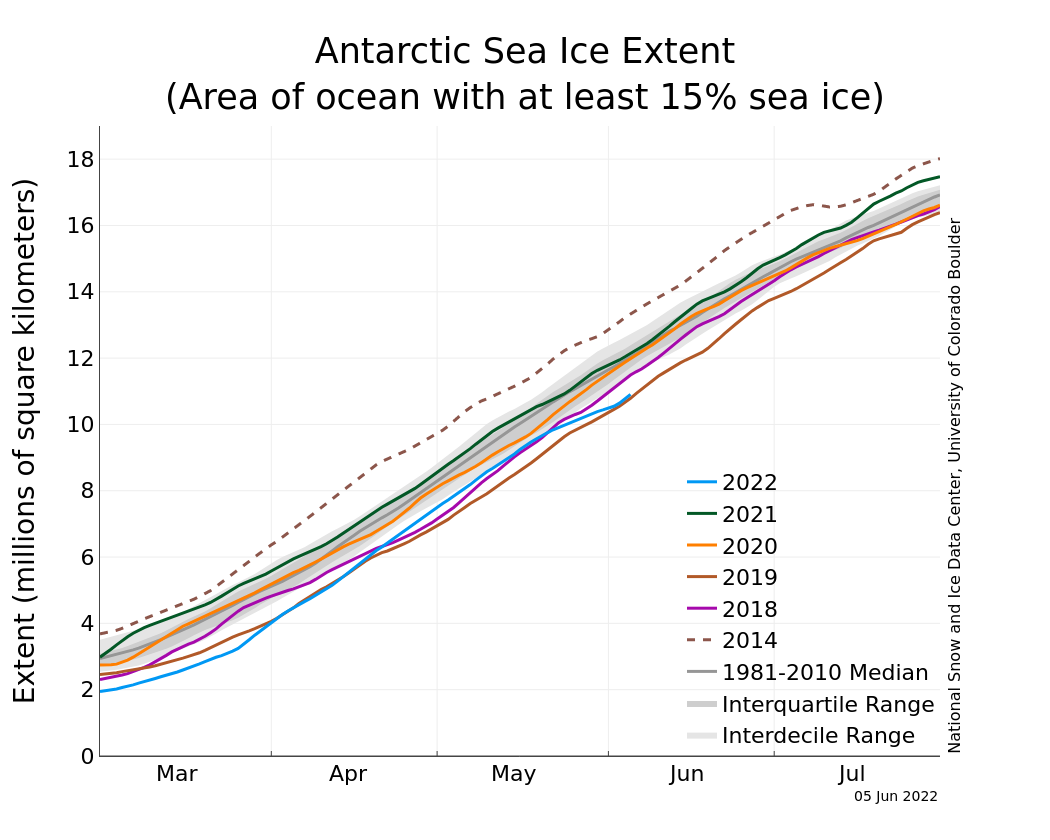
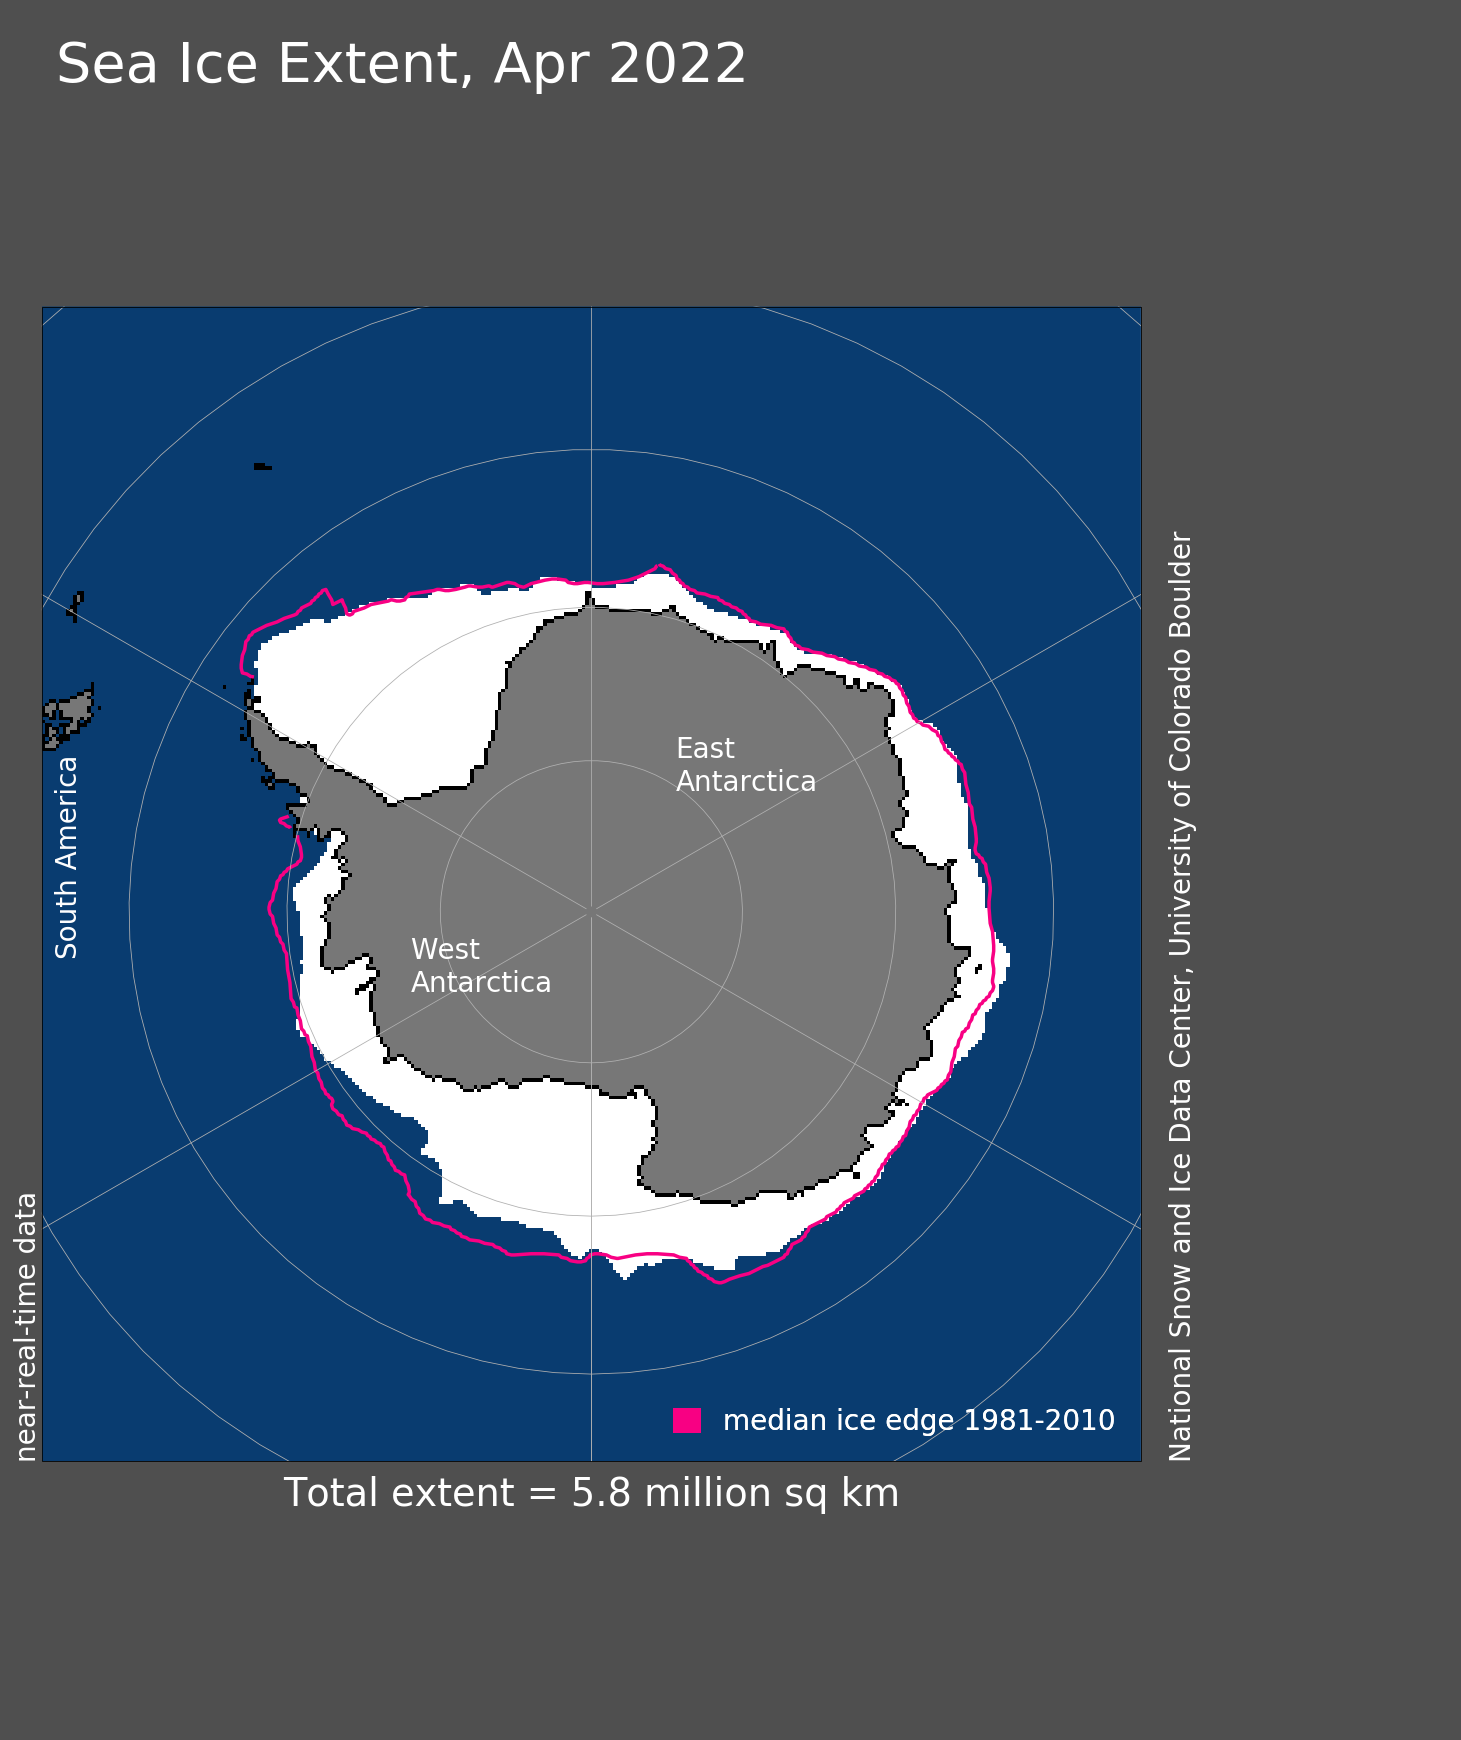
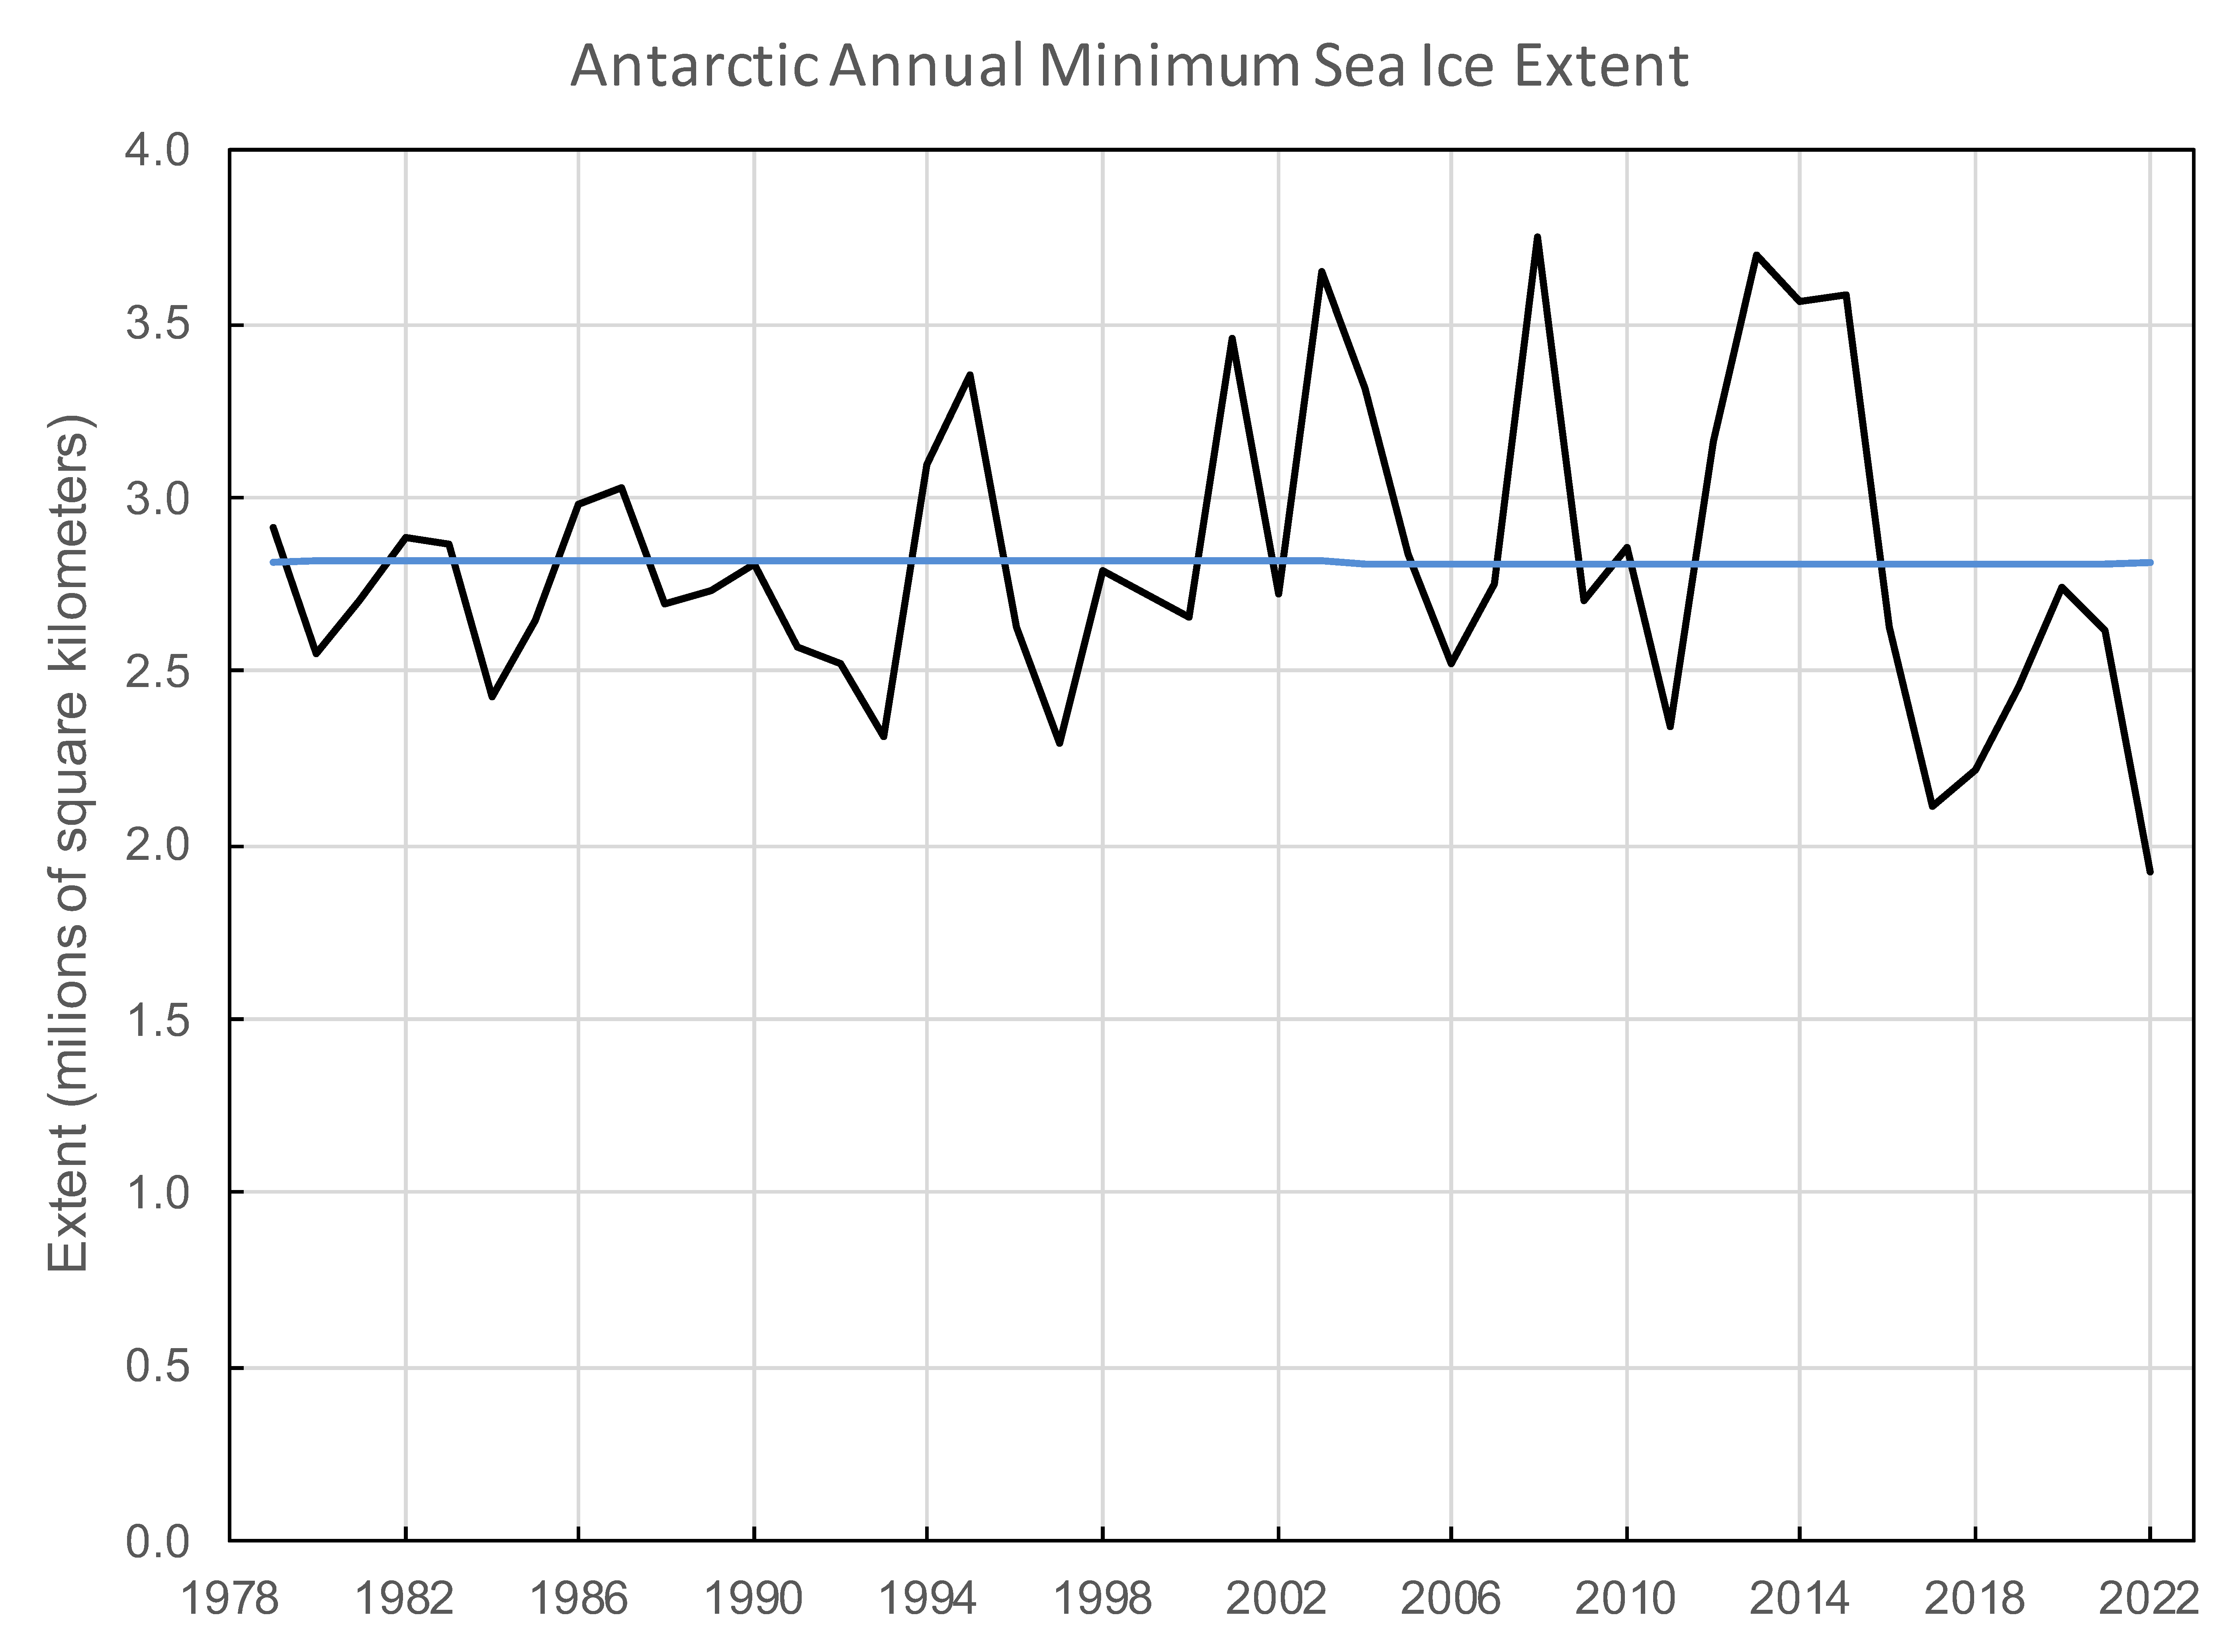
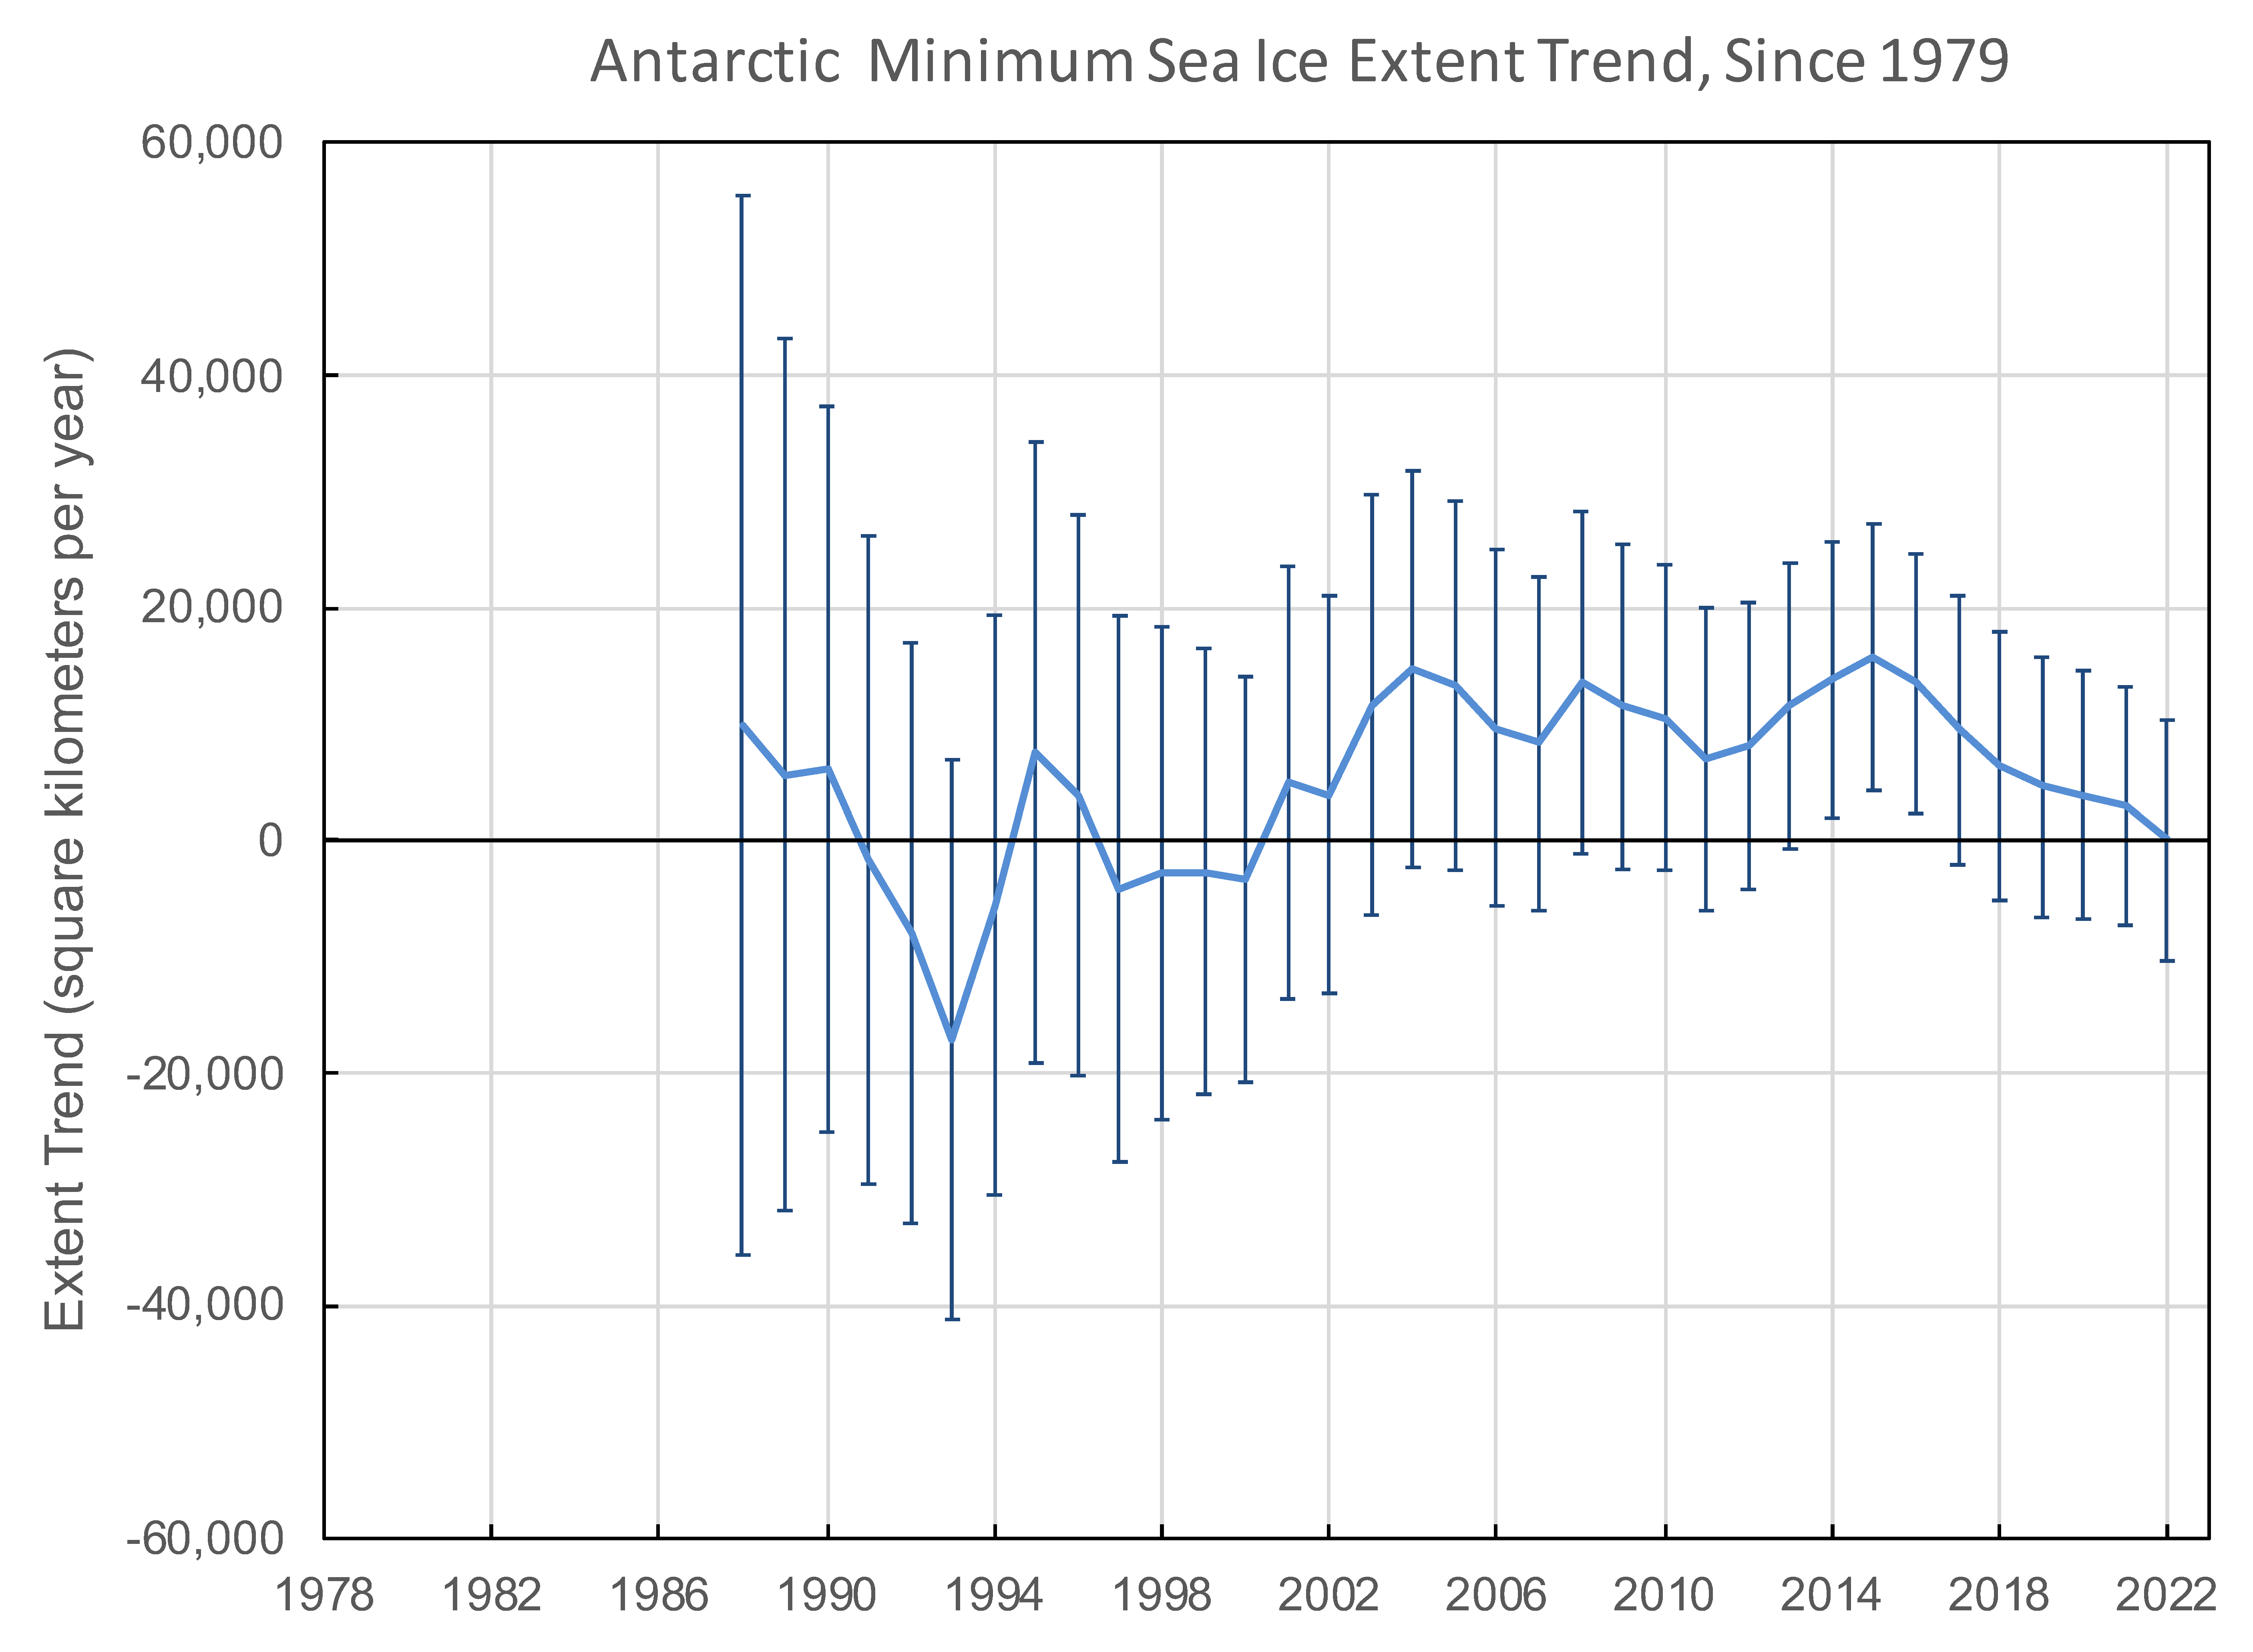
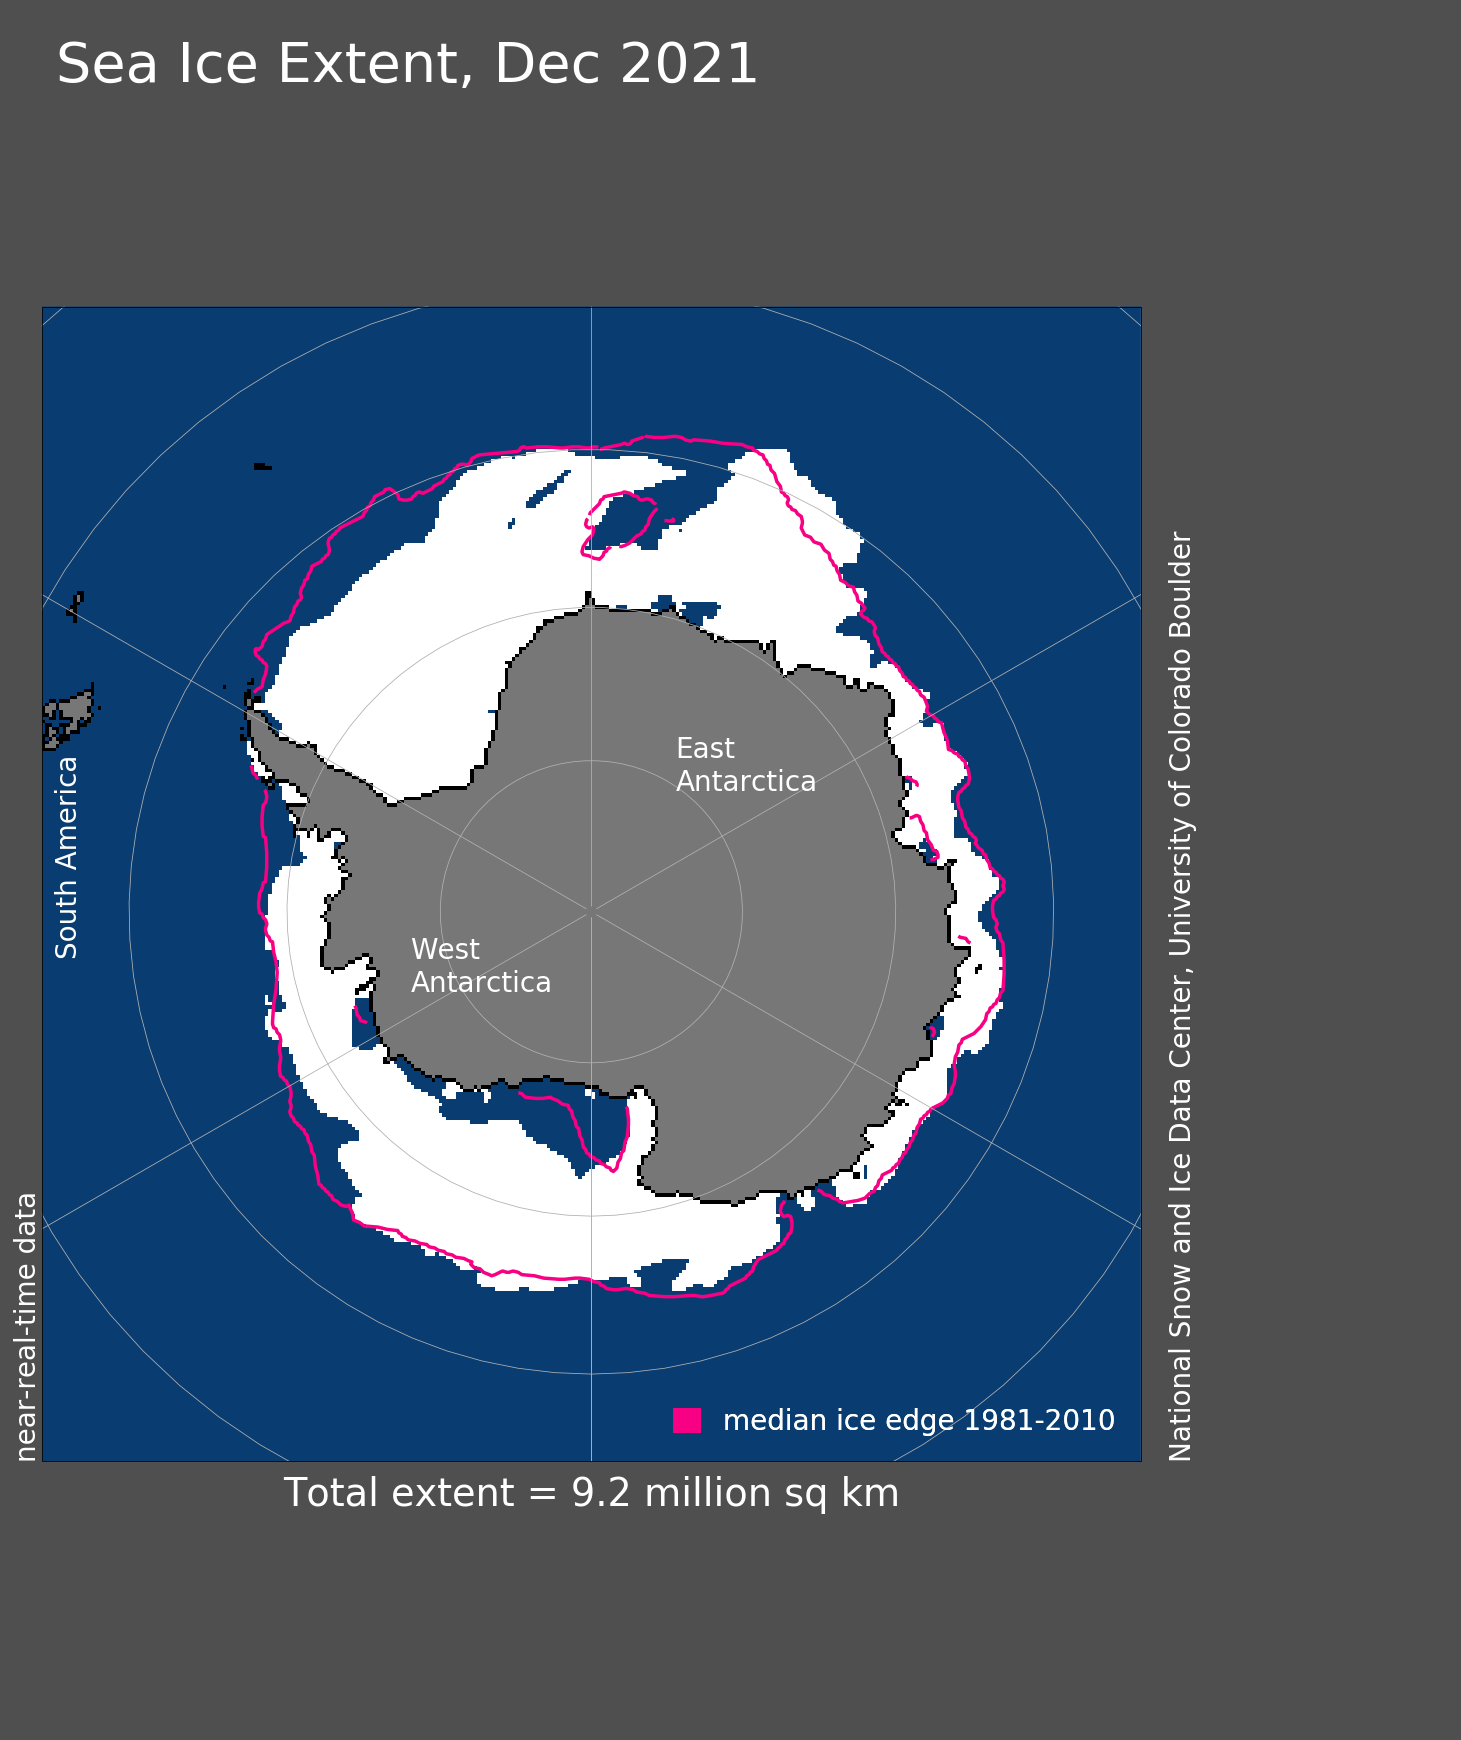
Summer is taking hold in the Southern Hemisphere. While the decline in Antarctic Sea ice extent is always steep at this time of year, it has been unusually rapid this year, and at the end of December, Antarctic sea ice extent stood at the lowest in the 45-year satellite record. Sea ice extent was more than 500,000 square kilometers (193,000 square miles) below the previous record year of 2018; four of the five lowest years for the last half of December have occurred since 2016. As is evident in sea ice maps prepared by colleagues at the University of Bremen from the Japan Aerospace Exploration Agency (JAXA) Advanced Microwave Scanning Radiometer 2 (AMSR2) data, an extremely large polynya now spans the Ross Sea and much of the western Amundsen Sea. Polynyas have also appeared in Pine Island Bay and the southeastern Weddell Sea (Figure 5a). There are also extensive areas of low sea ice concentration in the Weddell Sea that are likely ready to melt out.
Weather-related causes for the unusually low sea ice extent seem to stem from a band of above-average temperatures extending from the Weddell Sea westward to the Ross Sea and eastern Wilkes Land (Figure 5b). Air temperatures at the 925 mb level were more than 1 degree Celsius (2 degrees Fahrenheit) above average over the entire area in November and December, and were more than 2 degrees Celsius (4 degrees Fahrenheit) above average over the Ross Sea. The past two months have seen periods of strong circumpolar winds and below-average air pressure over the continent, leading to strong winds from the west across the Peninsula. This has caused melting along the eastern Peninsula ice, above-average air temperatures over the Weddell Sea, and outflowing winds from the continent, opening the polynyas and hastening ice decline. This wind pattern is summarized by the Southern Annular Mode (SAM) index, a measure of the intensity of the circumpolar winds; this has been in a positive phase for most of 2022 and has been quite strong in the last quarter of the year.