Arctic spring melt has begun. Ice extent declined most substantially in the Bering Sea and the Sea of Okhotsk. Overall decline was slower than average through the month.
Overview of conditions

Figure 1. Arctic sea ice extent for April 2022 was 14.06 million square kilometers (5.43 million square miles). The magenta line shows the 1981 to 2010 average extent for that month. Sea Ice Index data. About the data
Credit: National Snow and Ice Data Center
High-resolution image
Average Arctic sea ice extent for April 2022 was 14.06 million square kilometers (5.43 million square miles) (Figure 1). This was 630,000 square kilometers (243,000 square miles) below the 1981 to 2010 average and ranked eleventh lowest in the 44-year satellite record. Extent declined slowly through the beginning of the month, with only 87,000 square kilometers (33,600 square miles) of ice loss between April 1 and April 10. The decline then proceeded at an average pace for this time of year through the reminder of the month. Reductions in sea ice extent during April occurred primarily in the Bering Sea and the Sea of Okhotsk. Other regions had small losses at most. The southern Barents Sea lost some ice, but the channel of open water north of Novaya Zemlya that persisted for much of the winter closed during April. Overall, the daily sea ice extent tracked just below the interdecile range (below 90 percent of past daily values) for the month.
Conditions in context
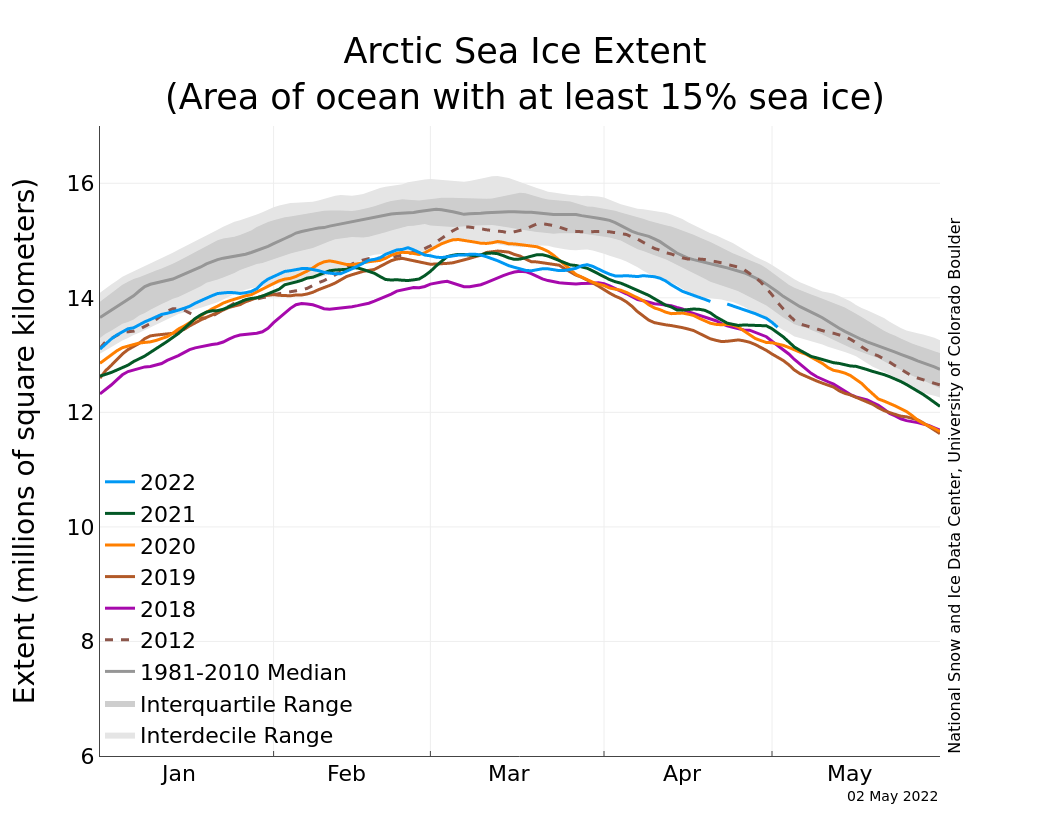
Figure 2a. The graph above shows Arctic sea ice extent as of May 2, 2022, along with daily ice extent data for four previous years and the record low year. 2022 is shown in blue, 2021 in green, 2020 in orange, 2019 in brown, 2018 in magenta, and 2012 in dashed brown. The 1981 to 2010 median is in dark gray. The gray areas around the median line show the interquartile and interdecile ranges of the data. Sea Ice Index data.
Credit: National Snow and Ice Data Center
High-resolution image
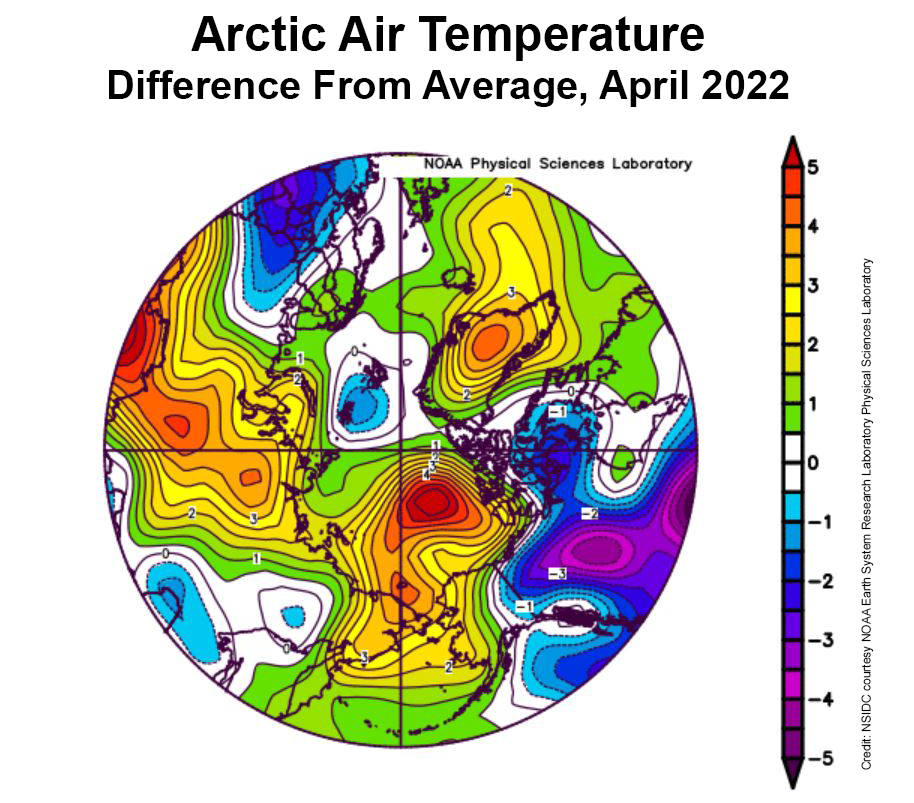
Figure 2b. This plot shows the departure from average air temperature in the Arctic at the 925 hPa level, in degrees Celsius, for April 2022. Yellows and reds indicate higher than average temperatures; blues and purples indicate lower than average temperatures.
Credit: NSIDC courtesy NOAA Earth System Research Laboratory Physical Sciences Laboratory
High-resolution image
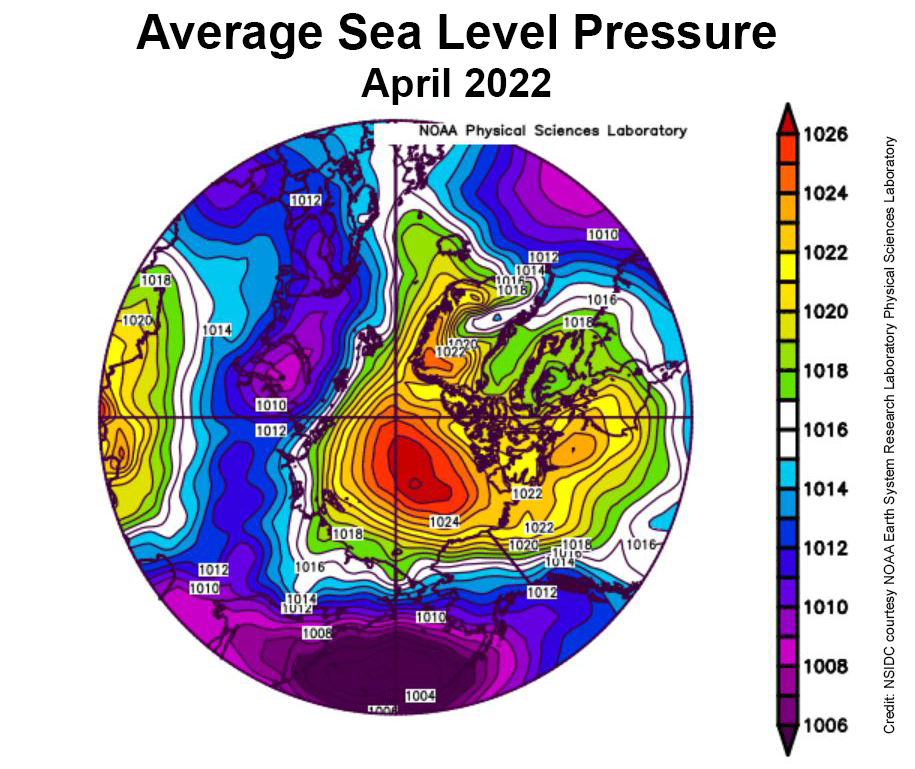
Figure 2c. This plot shows average sea level pressure in the Arctic in millibars for April 2022. Yellows and reds indicate high air pressure; blues and purples indicate low pressure.
Credit: NSIDC courtesy NOAA Earth System Research Laboratory Physical Sciences Laboratory
High-resolution image
Figure 2d. This animation (click to see animation) shows the polynyas, or openings in the ice cover, that formed in the Chukchi Sea from April 12 to 30, 2022. In April, strong offshore winds over the northwest coast of Alaska led to the formation of these polynyas.
Credit: Agnieszka Gautier, National Snow and Ice Data Center
High-resolution image
During April, temperatures at the 925 mb level (about 2,500 feet above the surface) over the Arctic Ocean were above average. Most areas were 2 to 3 degrees Celsius (4 to 5 degrees Fahrenheit) above average, but in the Beaufort Sea, April temperatures were up to 5 to 6 degrees Celsius (9 to 11 degrees Fahrenheit) above average (Figure 2b). This was accompanied by a strong Beaufort High pressure cell through the month (Figure 2c).
Strong offshore winds over the northwest coast of Alaska led to openings in the ice cover, called polynyas. The first pulse of winds began on March 21. At that time, surface air temperatures were still well below freezing, and the water in the coastal polynya quickly refroze. By April 9, the offshore push of the ice ceased and the polynya iced over completely. However, starting on April 12, a second round of offshore wind pushed the ice away from the coast, initiating another polynya. Refreezing began anew in the open water areas, but the ice growth was noticeably slower, reflecting the higher surface air temperatures by the end of the month (Figure 2d).
April 2022 compared to previous years
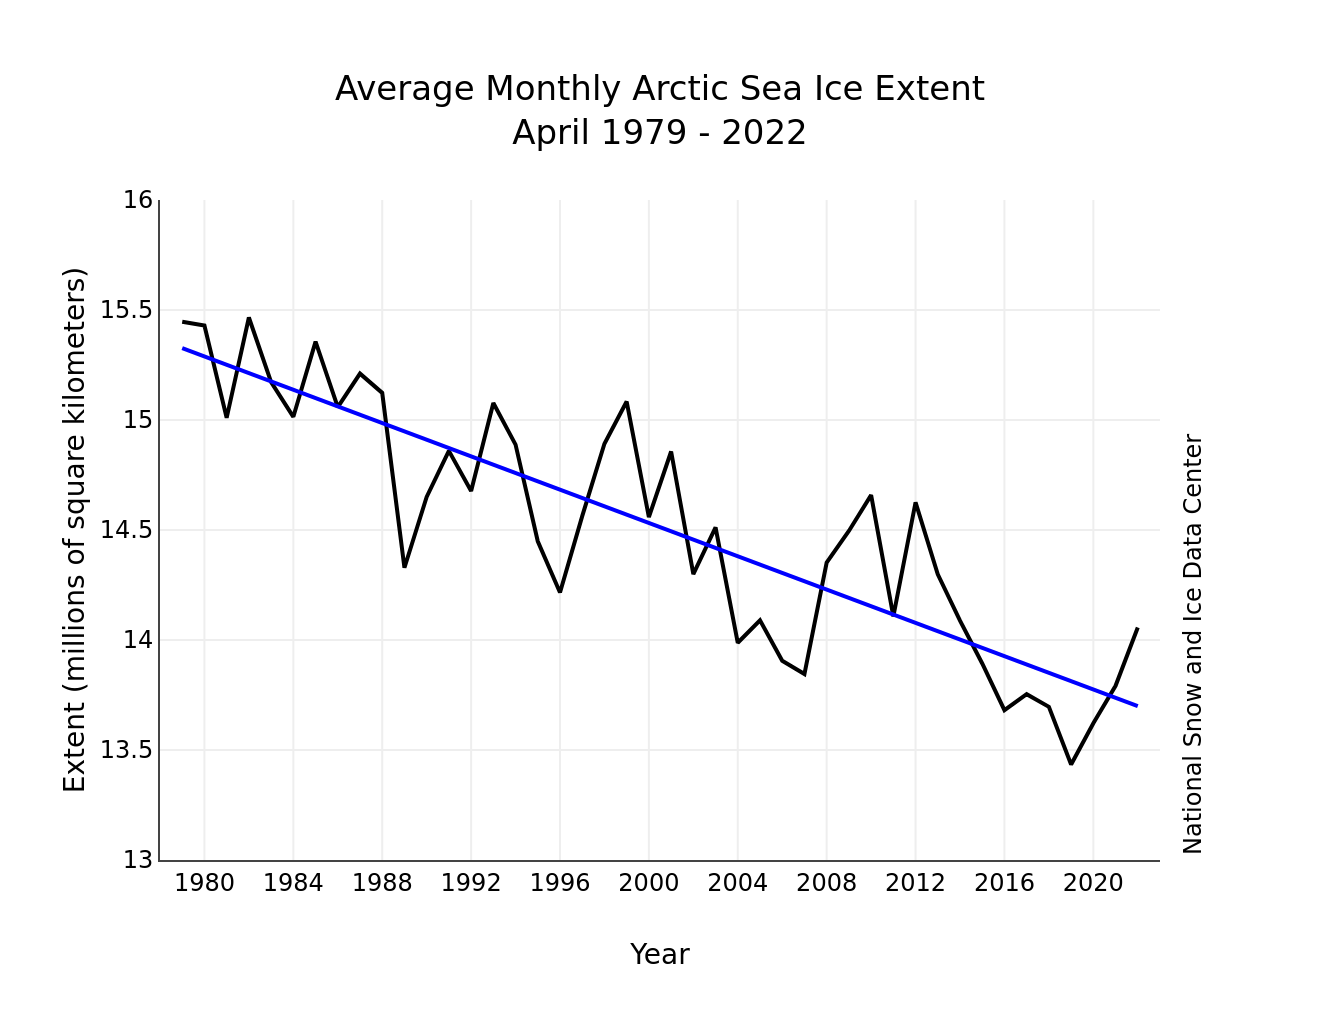
Figure 3. Monthly April ice extent for 1979 to 2022 shows a decline of 2.6 percent per decade.
Credit: National Snow and Ice Data Center
High-resolution image
The downward linear trend in April sea ice extent over the 44-year-satellite record is 37,900 square kilometers (14,600 square miles) per year, or 2.6 percent per decade relative to the 1981 to 2010 average (Figure 3). Based on the linear trend, since 1979, April has lost 1.68 million square kilometers (649,000 square miles) of sea ice. This is equivalent to the size of the state of Alaska.
Sea ice age

Figure 4. This map shows the age of Arctic sea ice for the March 12 to 18 period in (a) 1985 and (b) 2022. The oldest ice, greater than 4 years old, is in red. Plot (c) shows the timeseries from 1985 through 2022 of percent cover of the Arctic Ocean domain (inset, purple region) by different sea ice ages during the March 12 to 18 period.
Credit: M. Tschudi, W. Meier, and Stewart, NASA NSIDC DAAC
High-resolution image
With the onset of spring, it is time again for a check-in on sea ice age—the number of years that a parcel of ice has survived summer melt. As noted in previous posts, ice age provides a qualitative assessment of thickness, as older ice has more chances to thicken through ridging, rafting, and bottom ice growth (accretion) during winter. The coverage of the old, thick ice has a significant control on how much total ice survives the summer melt season—the first-year ice that grows thermodynamically over winter is more easily melted away during summer. That which survives through the summer melt season grows in age by one year. The extent of old ice declines through the winter when it drifts out of the Arctic through the Fram or Nares Strait. At the end of last summer, the extent of the oldest ice (greater than 4 years old) tied with 2012 for the lowest in the satellite record. This spring, we continue to see a dominance of first-year ice (Figure 4). The percentage of the greater than 4-year-old ice, which once comprised over 30 percent of the Arctic Ocean, now makes up only 3.1 percent of the ice cover.
Bering Sea crabs
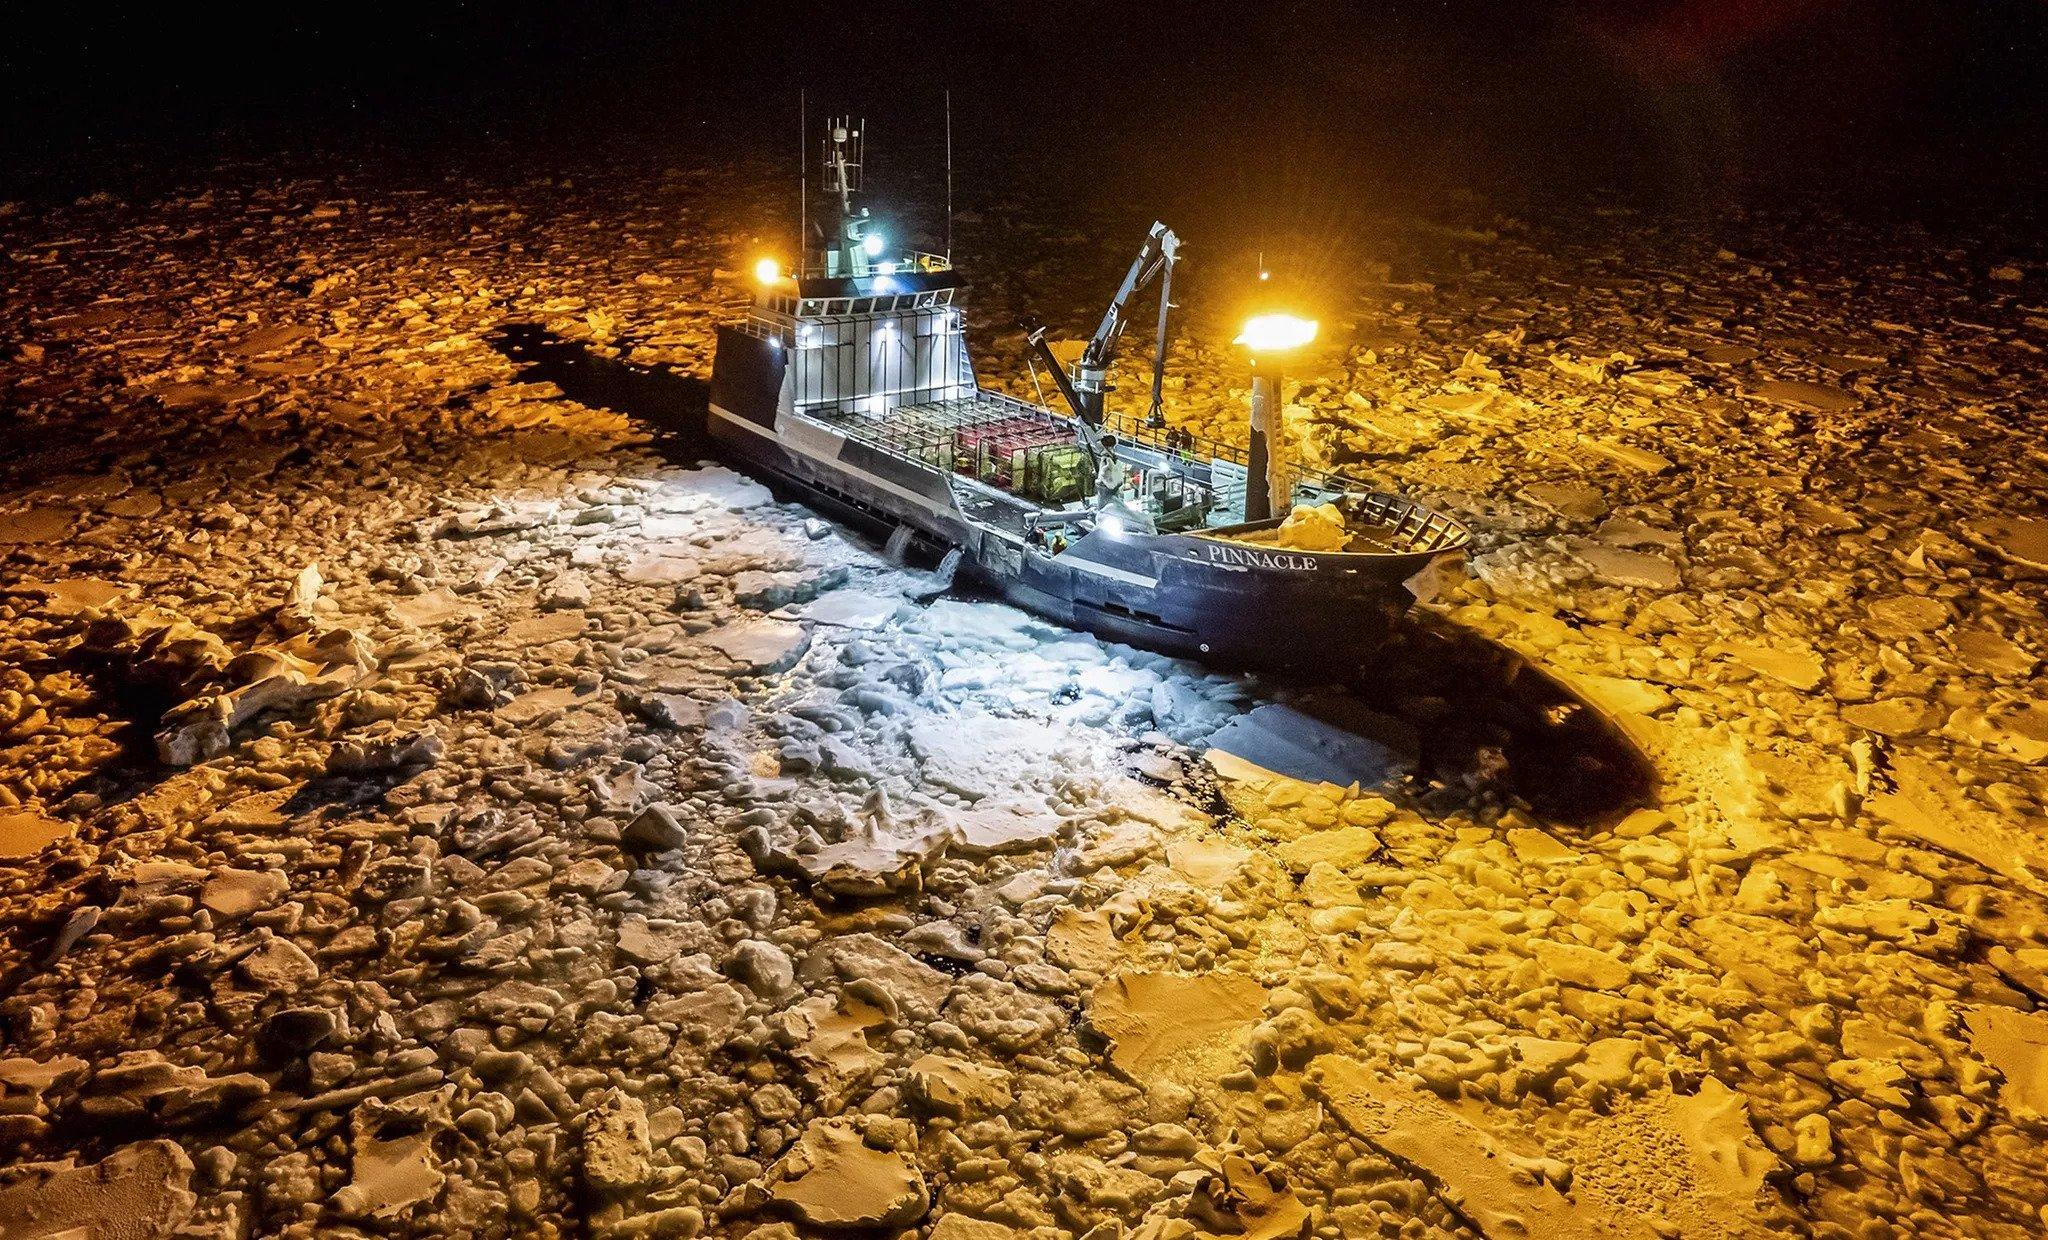
Figure 5. The fishing boat Pinnacle travels through a Bering Sea ice floe on January 25, 2022. Crab fishing is dangerous work due to frequently rough seas, icing, and dense pack ice.
Credit: Loren Holmes/Anchorage Daily News.
High-resolution image
The Bering Sea is an important crab fishery, with several species represented. Crab fishing is dangerous work because of frequently rough seas, icing on the ship’s superstructure, and dense pack ice (Figure 5). This past winter, the population of lucrative snow crabs was down substantially. This decline in crabs appears to be related to low sea ice extent during the 2018 and 2019 winters. Snow crabs prefer cold bottom water that protects the young from predators. The cold-water pool on the Bering Sea floor is caused by winter ice formation where dense, cold, and salty water sinks as the ice grows. However, in 2018 and 2019 there was very little ice. This opened young crabs to more predation, and far fewer survived to maturity.
Antarctica rising
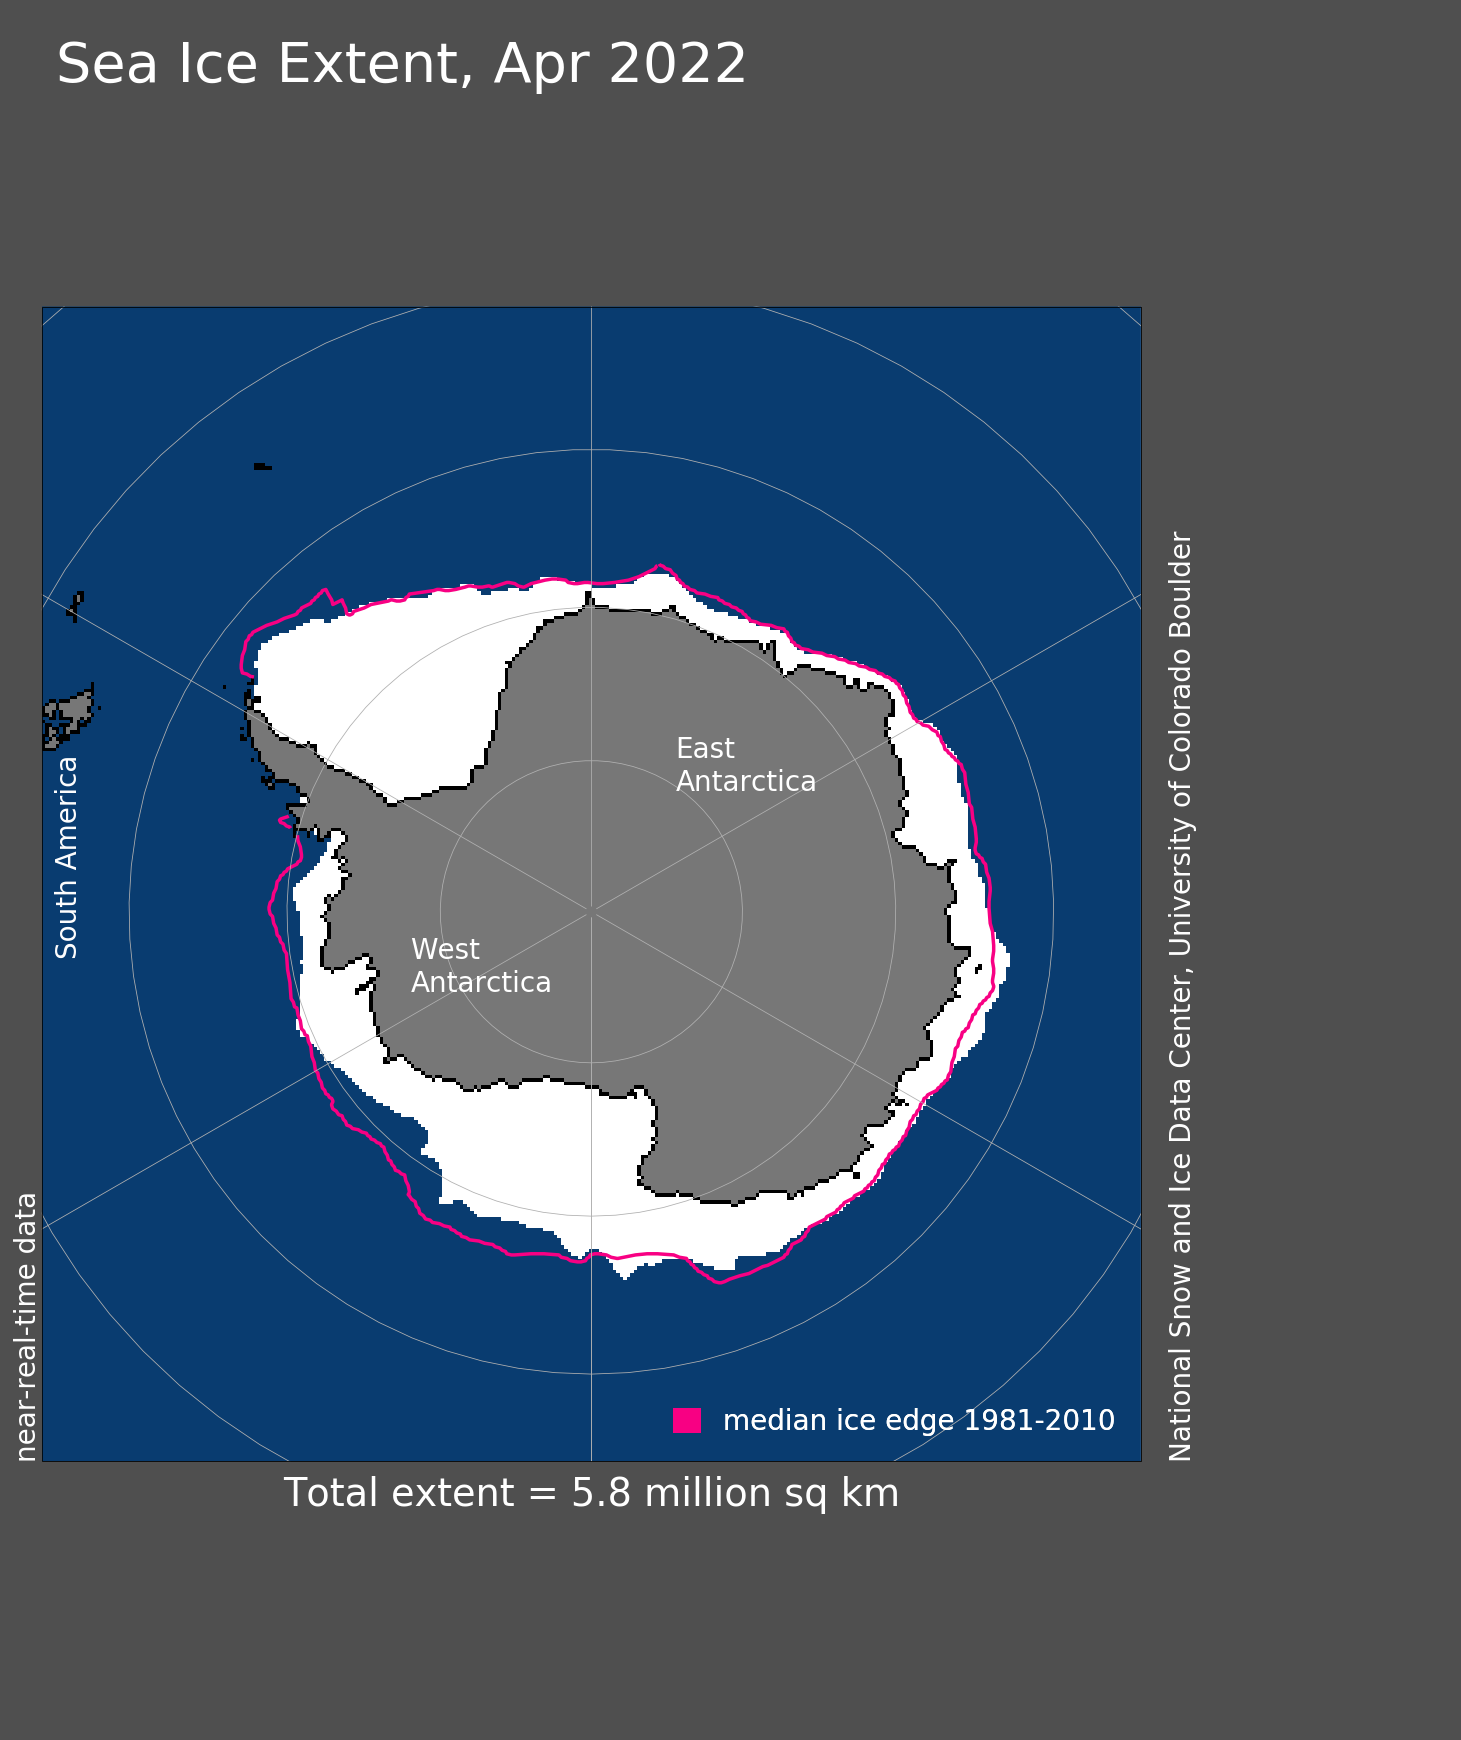
Figure 6. Antarctic sea ice extent for April 2022 was 5.84 million square kilometers (2.25 million square miles). The magenta line shows the 1981 to 2010 average extent for that month. Sea Ice Index data. About the data
Credit: National Snow and Ice Data Center
High-resolution image
After the record low minimum Antarctic sea ice extent at the end of February and the strong heat wave that followed in mid-March, conditions in the Southern Ocean have calmed down. Ice extent remains low for this time of year below the interdecile range, but is above 2017, 2018, and 2019, as well as 1980. Extent remained below average in the Weddell, eastern Ross, and western Amundsen-Bellingshausen regions, but near average around the rest of the continent (Figure 6). Through April, ice extent increases in all regions around the continent, but with relatively slower growth in the Amundsen-Bellingshausen Seas.
First Multidisciplinary Drifting Observatory for the Study of Arctic Climate science team meeting
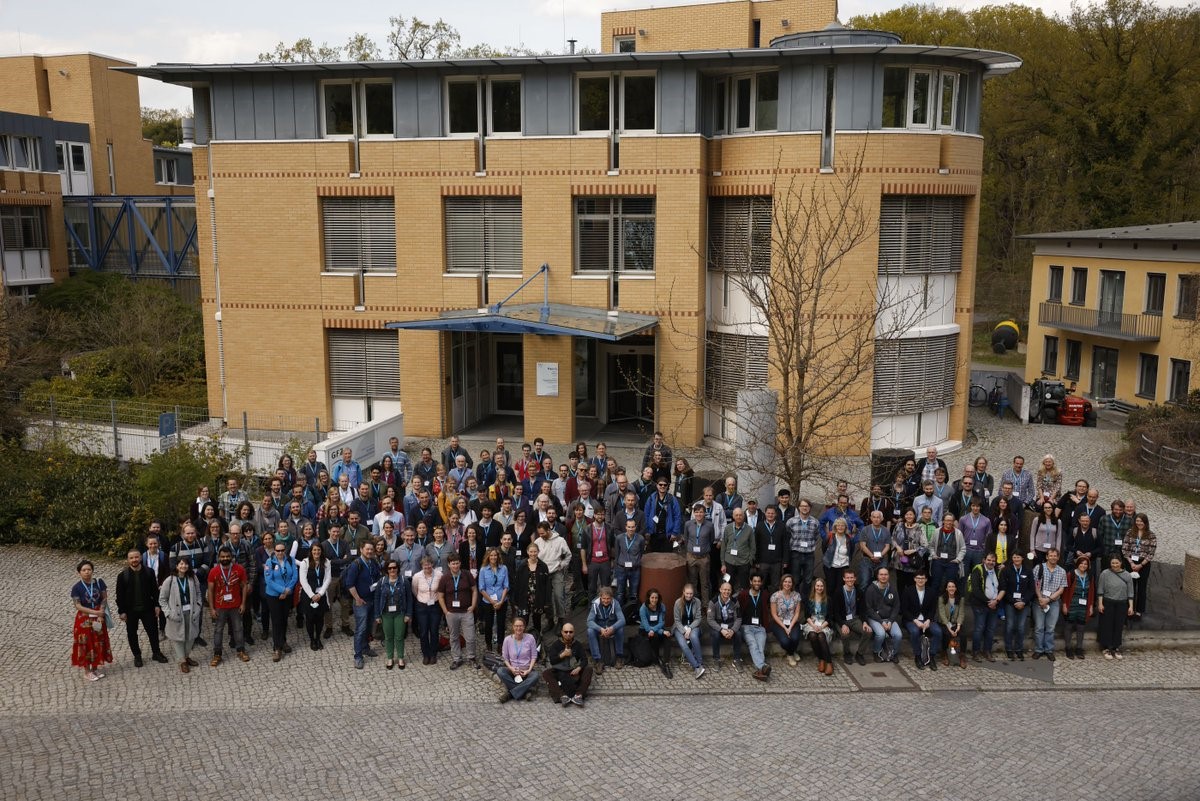
Figure 7. The first in-person Multidisciplinary Drifting Observatory for the Study of Arctic Climate (MOSAiC) science conference was held at the end of April in Potsdam, Germany. This was the first chance to present findings from the year-long expedition and pave the way for future analysis and collaboration.
Credit: Multidisciplinary Drifting Observatory for the Study of Arctic Climate (MOSAiC) Expedition
High-resolution image
The Multidisciplinary Drifting Observatory for the Study of Arctic Climate (MOSAiC) expedition took place during 2019 and 2020 when the German icebreaker, Polarstern, was frozen into the ice and drifted across the Arctic for nearly a year. During the year, numerous observations were taken of the atmosphere, ocean, sea ice, and biogeochemistry. The scientific analysis is ongoing, and exciting results are starting to be reported.
The first in-person MOSAiC science conference was held at the end of April in Potsdam, Germany (Figure 7). This was the first chance to present findings from the year-long expedition and pave the way for future analysis and collaboration. Science teams from each discipline (atmosphere, ocean, sea ice, snow, remote sensing, ecosystem, biogeochemistry) discussed initial research results. Key to the success of MOSAiC is the strong interdisciplinary collaboration of the projects needed to provide a holistic understanding of Arctic Ocean changes and their impacts. NSIDC scientist Julienne Stroeve presented on the impacts of a rain-on-snow event in mid-September and the potential impact this would have on satellite retrievals of sea ice concentration, snow depth, and ice thickness. In January 2023, all MOSAiC data collected will be made available to the wider science community.
David Barber
Figure 8. Polar scientist David Barber of the University of Manitoba passed away on April 15, 2022.
Credit: University of Manitoba
High-resolution image
It is with sadness that we note the passing of one of the world’s pre-eminent polar scientists, David Barber, of the University of Manitoba, who died on April 15, 2022. He was a force in Canadian science, leading several large projects that increased understanding of sea ice and the Arctic.
References
Bernton, H., and L. Holmes. 2022. A crab boat’s quest for snow crab in a Bering Sea upended by climate change. The Seattle Times. https://pulitzercenter.org/stories/crab-boats-quest-snow-crab-bering-sea-upended-climate-change
Rascoe, A. 2022. Snow crabs in the Bering Sea have been hard to find — partially due to climate change. National Public Radio. https://www.npr.org/2022/04/10/1091927681/snow-crabs-in-the-bering-sea-have-been-hard-to-find-partially-due-to-climate-cha.
Thoman, Jr., R. L., U .S. Bhatt, P. A. Bieniek, B. R. Brettschneider, M. Brubaker, S. L. Danielson, Z. Labe, R. Lader, W. N. Meier, G. Sheffield, and J. E. Walsh. 2020. The record low Bering Sea ice extent in 2018: Context, impacts, and an assessment of the role of anthropogenic climate change. Bulletin of the American Meteorological Society. doi:10.1175/BAMS-D-19-0175.1.
University of Manitoba. 2022. Mourning the loss of visionary Arctic researcher, Dr. David Barber. UM Today News. https://news.umanitoba.ca/mourning-the-loss-of-visionary-arctic-researcher-dr-david-barber/.
Sea ice age data sets from the NSIDC DAAC: Quicklook Arctic Weekly EASE-Grid Sea Ice Age, Version 1 and EASE-Grid Sea Ice Age, Version 4.

