Arctic sea ice extent continued its summer decline. Extent is below average but not as low as in recent summers. In the Antarctic, sea ice extent is currently at record low levels for this time of year.
Overview of conditions
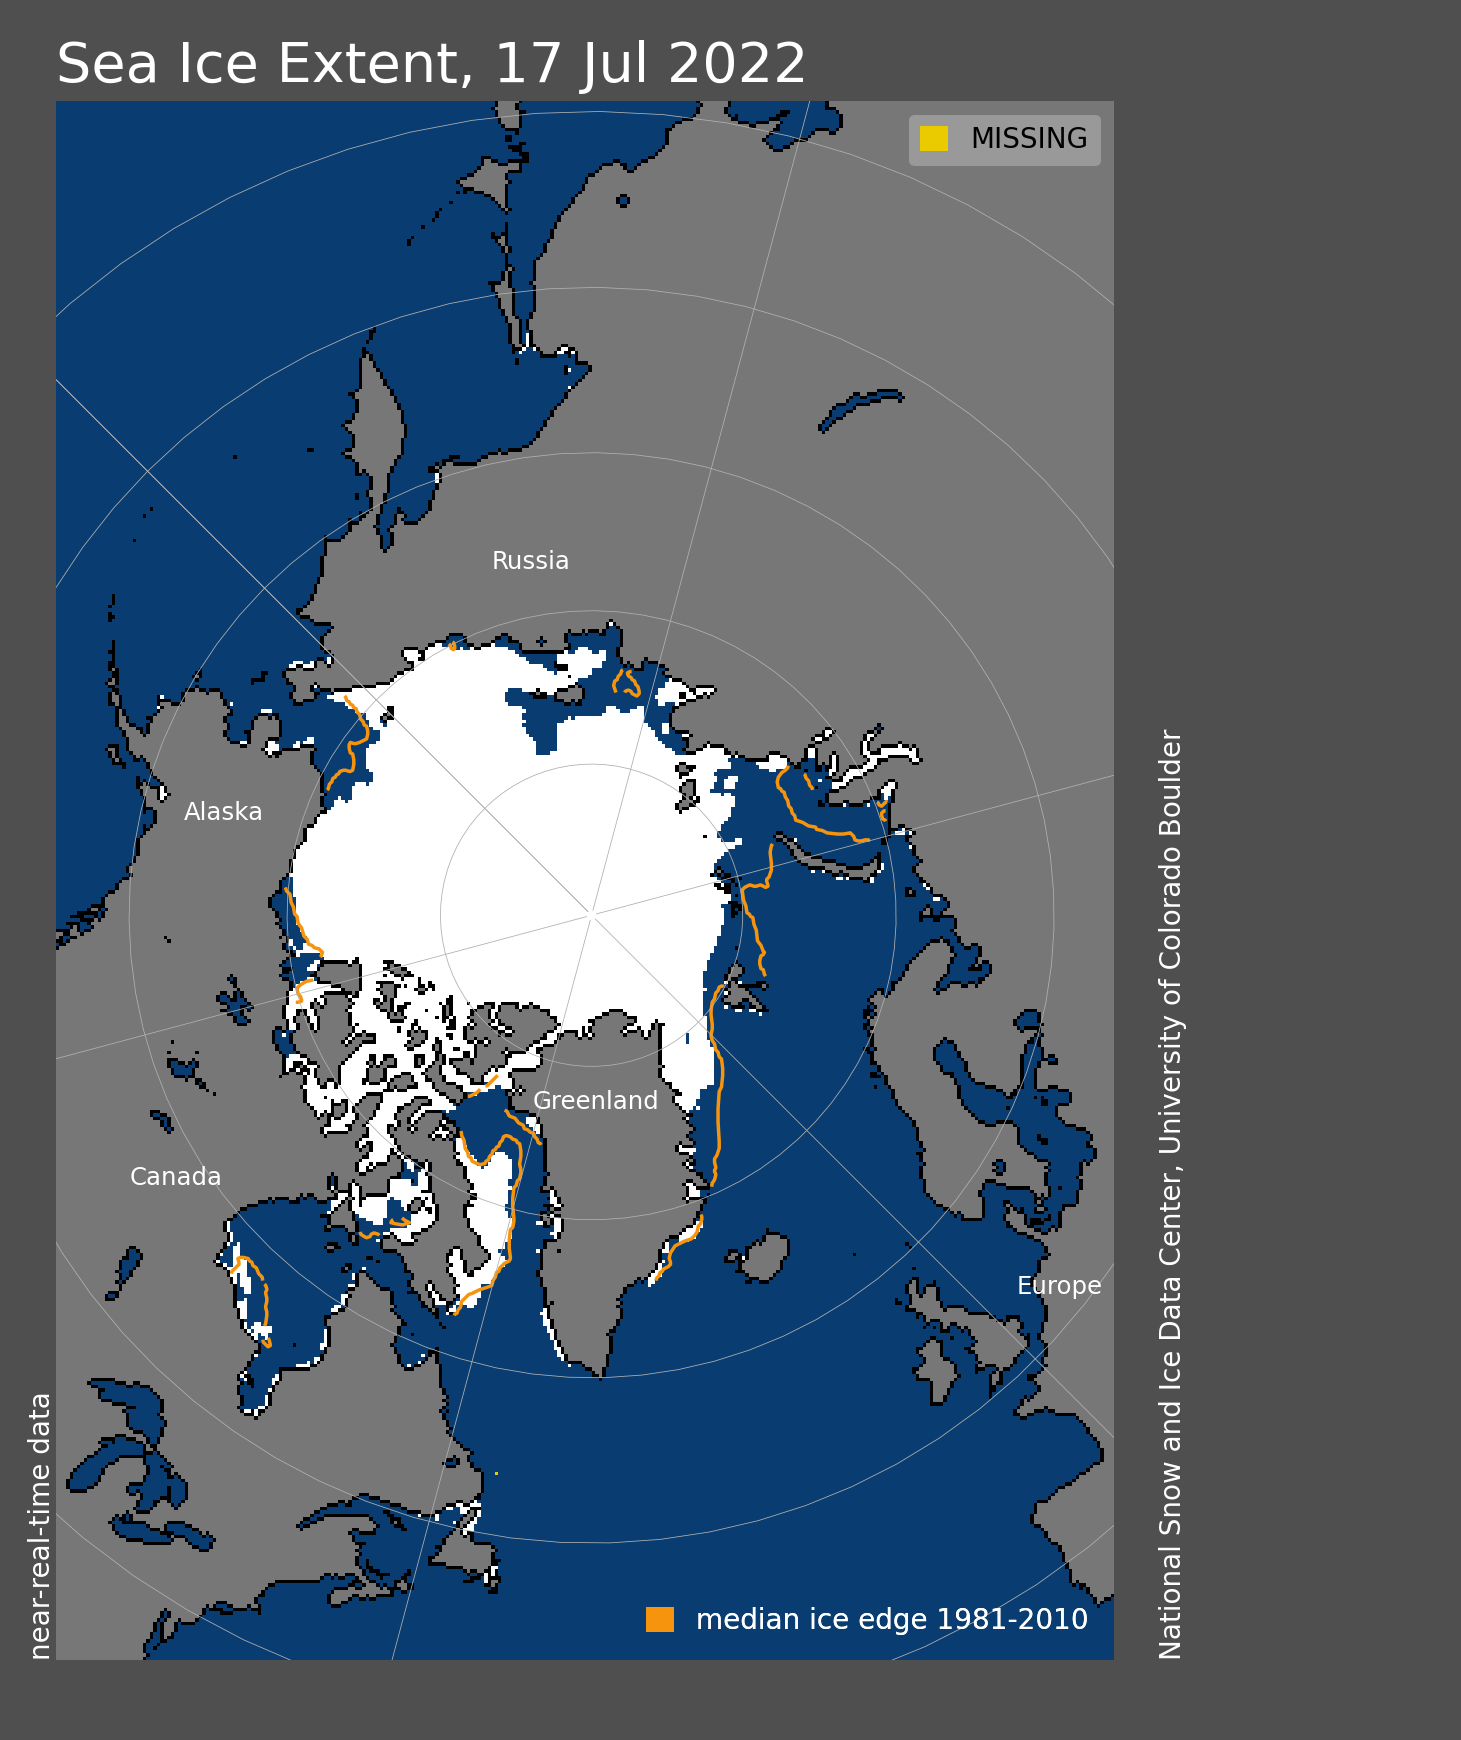
Figure 1a. Arctic sea ice extent for July 17, 2022, was 8.42 million square kilometers (3.25 million square miles). The orange line shows the 1981 to 2010 average extent for that day. Sea Ice Index data. About the data
Credit: National Snow and Ice Data Center
High-resolution image
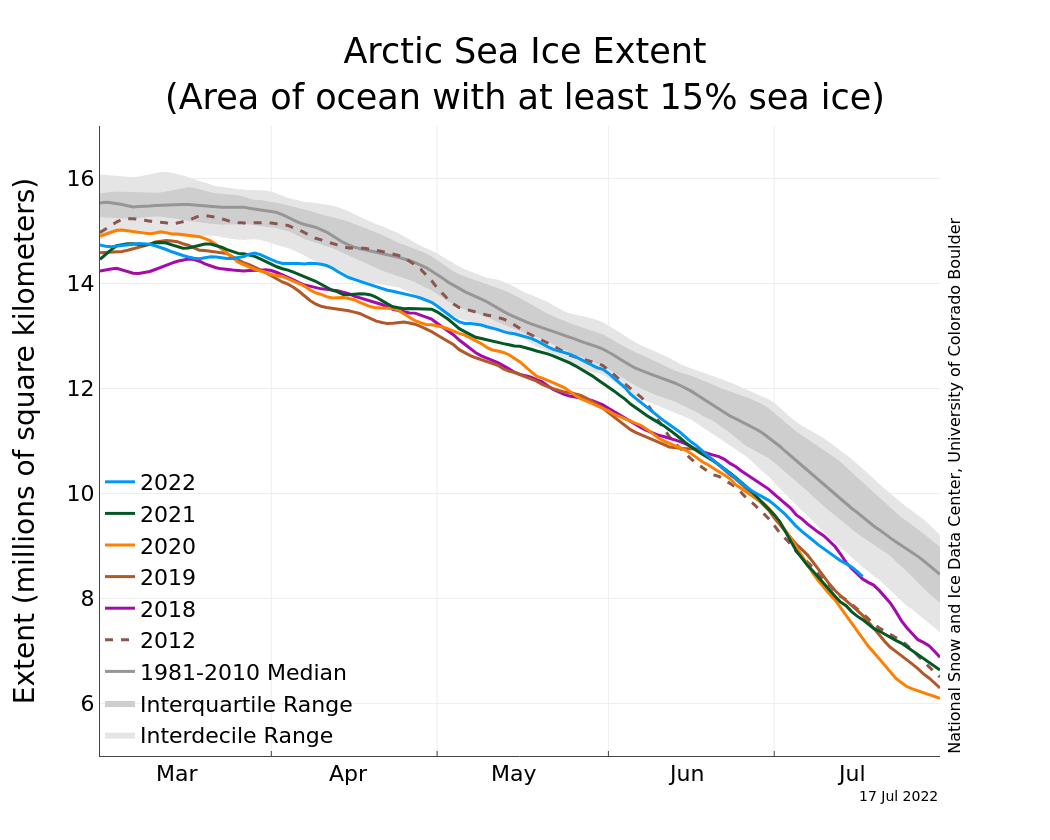
Figure 1b. The graph above shows Arctic sea ice extent as of July 17, 2022, along with daily ice extent data for four previous years and the record low year. 2022 is shown in blue, 2021 in green, 2020 in orange, 2019 in brown, 2018 in magenta, and 2012 in dashed brown. The 1981 to 2010 median is in dark gray. The gray areas around the median line show the interquartile and interdecile ranges of the data. Sea Ice Index data.
Credit: National Snow and Ice Data Center
High-resolution image
As of the middle of the Arctic summer, on July 17, sea ice extent was 8.42 million square kilometers (3.25 million square miles) (Figure 1a). The decline rate of the extent through the first half of July was near the 1981 to 2010 average. Extent on July 17 was the highest since 2015 and overall was thirteenth lowest in the satellite record (Figure 1b).
The most notable area of ice loss so far is in the Laptev Sea. This is similar to the pattern of the last two years, but much less extreme than observed in 2020 and 2021 when the Laptev Sea ice extent was at or near record low levels in June and July. Extent continues to be below average in the Barents Sea.
Conditions in context
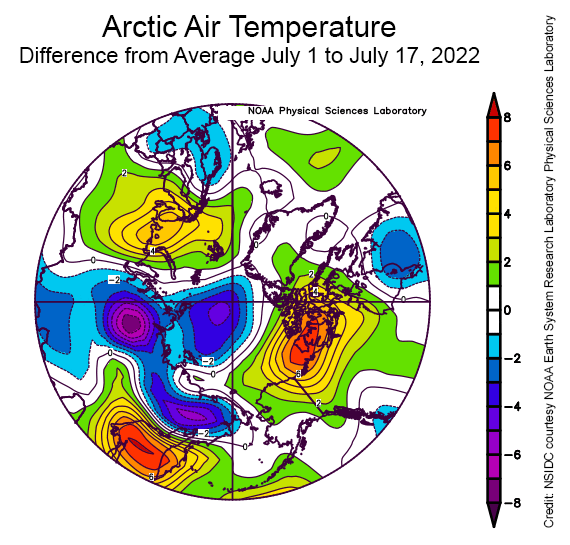
Figure 2a. This plot shows the departure from average air temperature, relative to the 1981 to 2020 reference period, in the Arctic at the 925 hPa level, in degrees Celsius, from July 1 to July 17, 2022. Yellows and reds indicate higher than average temperatures; blues and purples indicate lower than average temperatures.
Credit: NSIDC courtesy NOAA Earth System Research Laboratory Physical Sciences Laboratory
High-resolution image
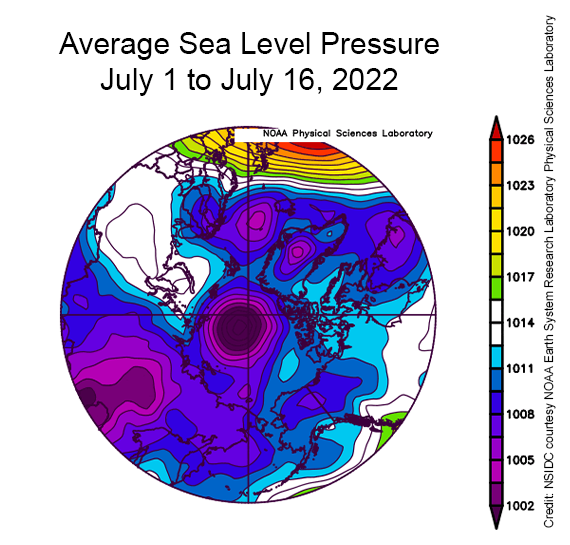
Figure 2b. This plot shows average sea level pressure in the Arctic in millibars from July 1 to July 16, 2022. Yellows and reds indicate high air pressure; blues and purples indicate low pressure.
Credit: NSIDC courtesy NOAA Earth System Research Laboratory Physical Sciences Laboratory
High-resolution image
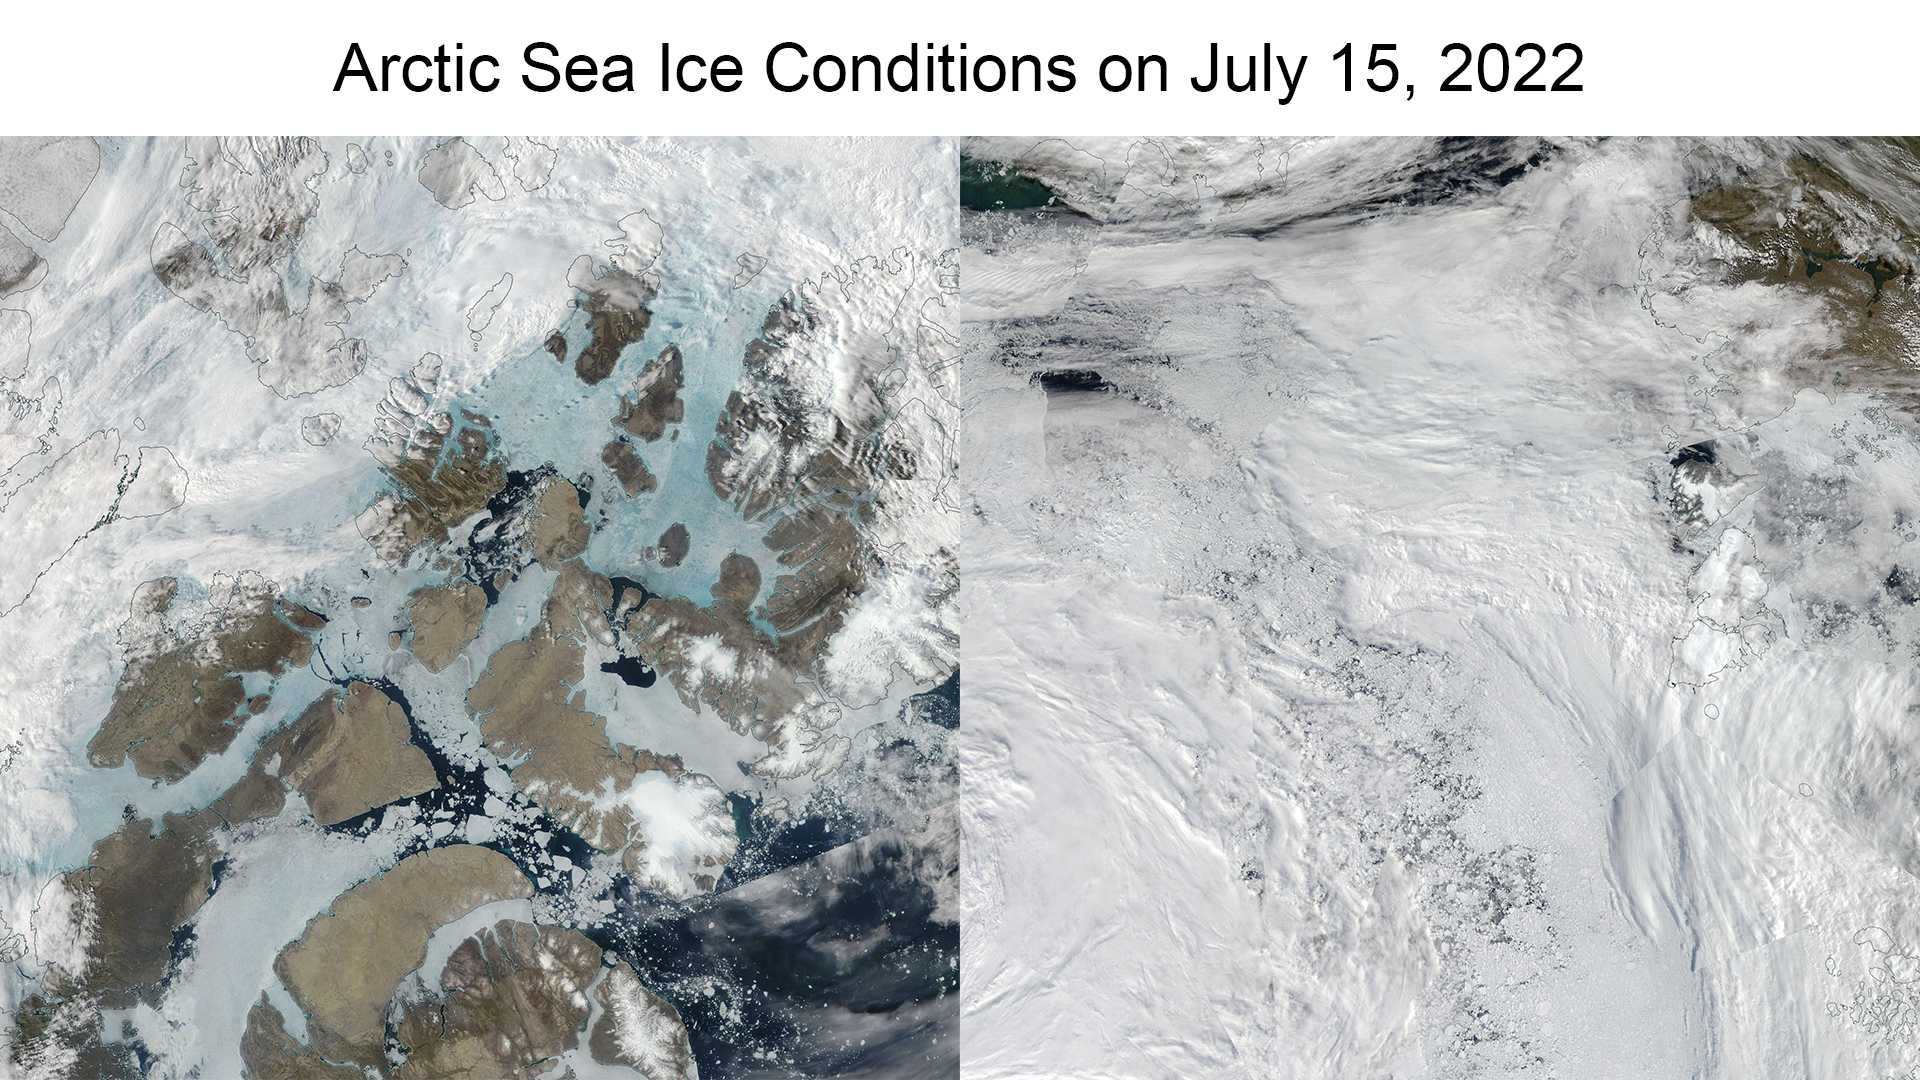
Figure 2c. These two NASA WorldView True Color images from the Moderate Resolution Imaging Spectroradiometer (MODIS) sensor show sea ice conditions in two regions of the Arctic on July 15, 2022. The left image shows melt ponds over sea ice, as seen in light blue-green, in the Canadian Arctic Archipelago. The right image shows the low sea ice concentration in the Laptev and Kara Seas towards the North Pole.
Credit: NASA Worldview
High-resolution image
In terms of air temperature, the first half of July 2022 was a tale of regional contrasts (Figure 2a). On the Eurasian side of the Arctic, particularly in the Laptev and Barents Seas, extending toward the North Pole, air temperatures at the 925 mb level (about 2,500 feet about the surface) were 3 to 6 degrees Celsius (5 to 11 degrees Fahrenheit) below average. On the North American side of the Arctic, air temperatures were as much as 8 degrees Celsius (14 degrees Fahrenheit) above average, notably in the southeast Beaufort Sea and the western Canadian Arctic Archipelago. The sea level pressure pattern was dominated by low pressure over the Laptev Sea sector, centered near the North Pole (Figure 2b).
Warm conditions in the Canadian Arctic Archipelago have enhanced melt pond formation and evolution (Figure 2c, left). Also of note is a region of low concentration ice near the North Pole in the Laptev and Kara Seas sector (Figure 2c, right). Low pressure, such as has been centered over the region in early July, often results in divergence of the ice cover and likely helped form the low concentration area.
Low snow and heat waves

Figure 3. This graph shows snow cover extent as a difference from average in the Northern Hemisphere for June from 1967 to 2022. The anomaly is relative to the 1981 to 2010 average.
Credit: National Snow and Ice Data Center, courtesy Rutgers University Global Snow Lab
High-resolution image
By June, snow usually remains only in the high north above the Arctic Circle or at high elevations. June 2022 shows particularly low Northern-Hemisphere snow extent, indicating that the snow melt occurred faster than average. According to Rutgers Snow Lab data, the June 2022 Northern Hemisphere snow extent was third lowest in the record dating back to 1967; only 2012 and 2015 had lower June snow extent (Figure 3).
A recent paper by Rousi et al. found that changes in the jet stream are an important factor in promoting European heatwaves. A possible factor in the jet stream changes is the increasing coastal temperature contrast between the rapidly warming land surface and the more slowly warming ocean/sea ice surface. An early loss of snow contributes to the warming land surface because the loss of high albedo snow allows earlier and more rapid absorption of solar energy. Other studies have also linked early snow loss to summer mid-latitude heatwaves (e.g., Zhang et al., and Connolly et al.).
NASA summer airborne sea ice campaign
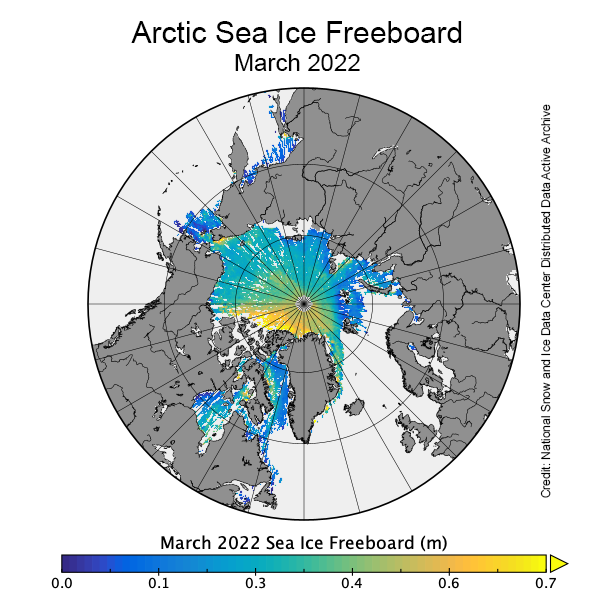
Figure 4. This map shows estimates of sea ice freeboard, or the height of sea ice above the waterline, for March 2022. Data are from the NASA Ice, Cloud, and land Elevation Satellite-2 (ICESat-2).
Credit: NASA National Snow and Ice Data Center Distributed Active Archive Center (NSIDC DAAC)
High-resolution image
NASA’s Ice, Cloud and land Elevation Satellite-2 (ICESat-2) laser altimeter, which launched in 2018, continues to perform well and is providing elevation data of vegetation, clouds, lakes, glaciers, ice sheets, and sea ice. The NASA Snow and Ice DAAC at NSIDC archives and distributes its data. ICESat-2 provides estimates of sea ice freeboard (height above the waterline) and thickness (Figure 4). During summer, when the ice surface is melting, the sea ice data from ICESat-2 have larger errors. NASA scientists are currently in the Arctic conducting an airborne campaign to collect a myriad of validation data that they hope will help improve the ICESat-2 estimates during summer.
Antarctic sea ice extent
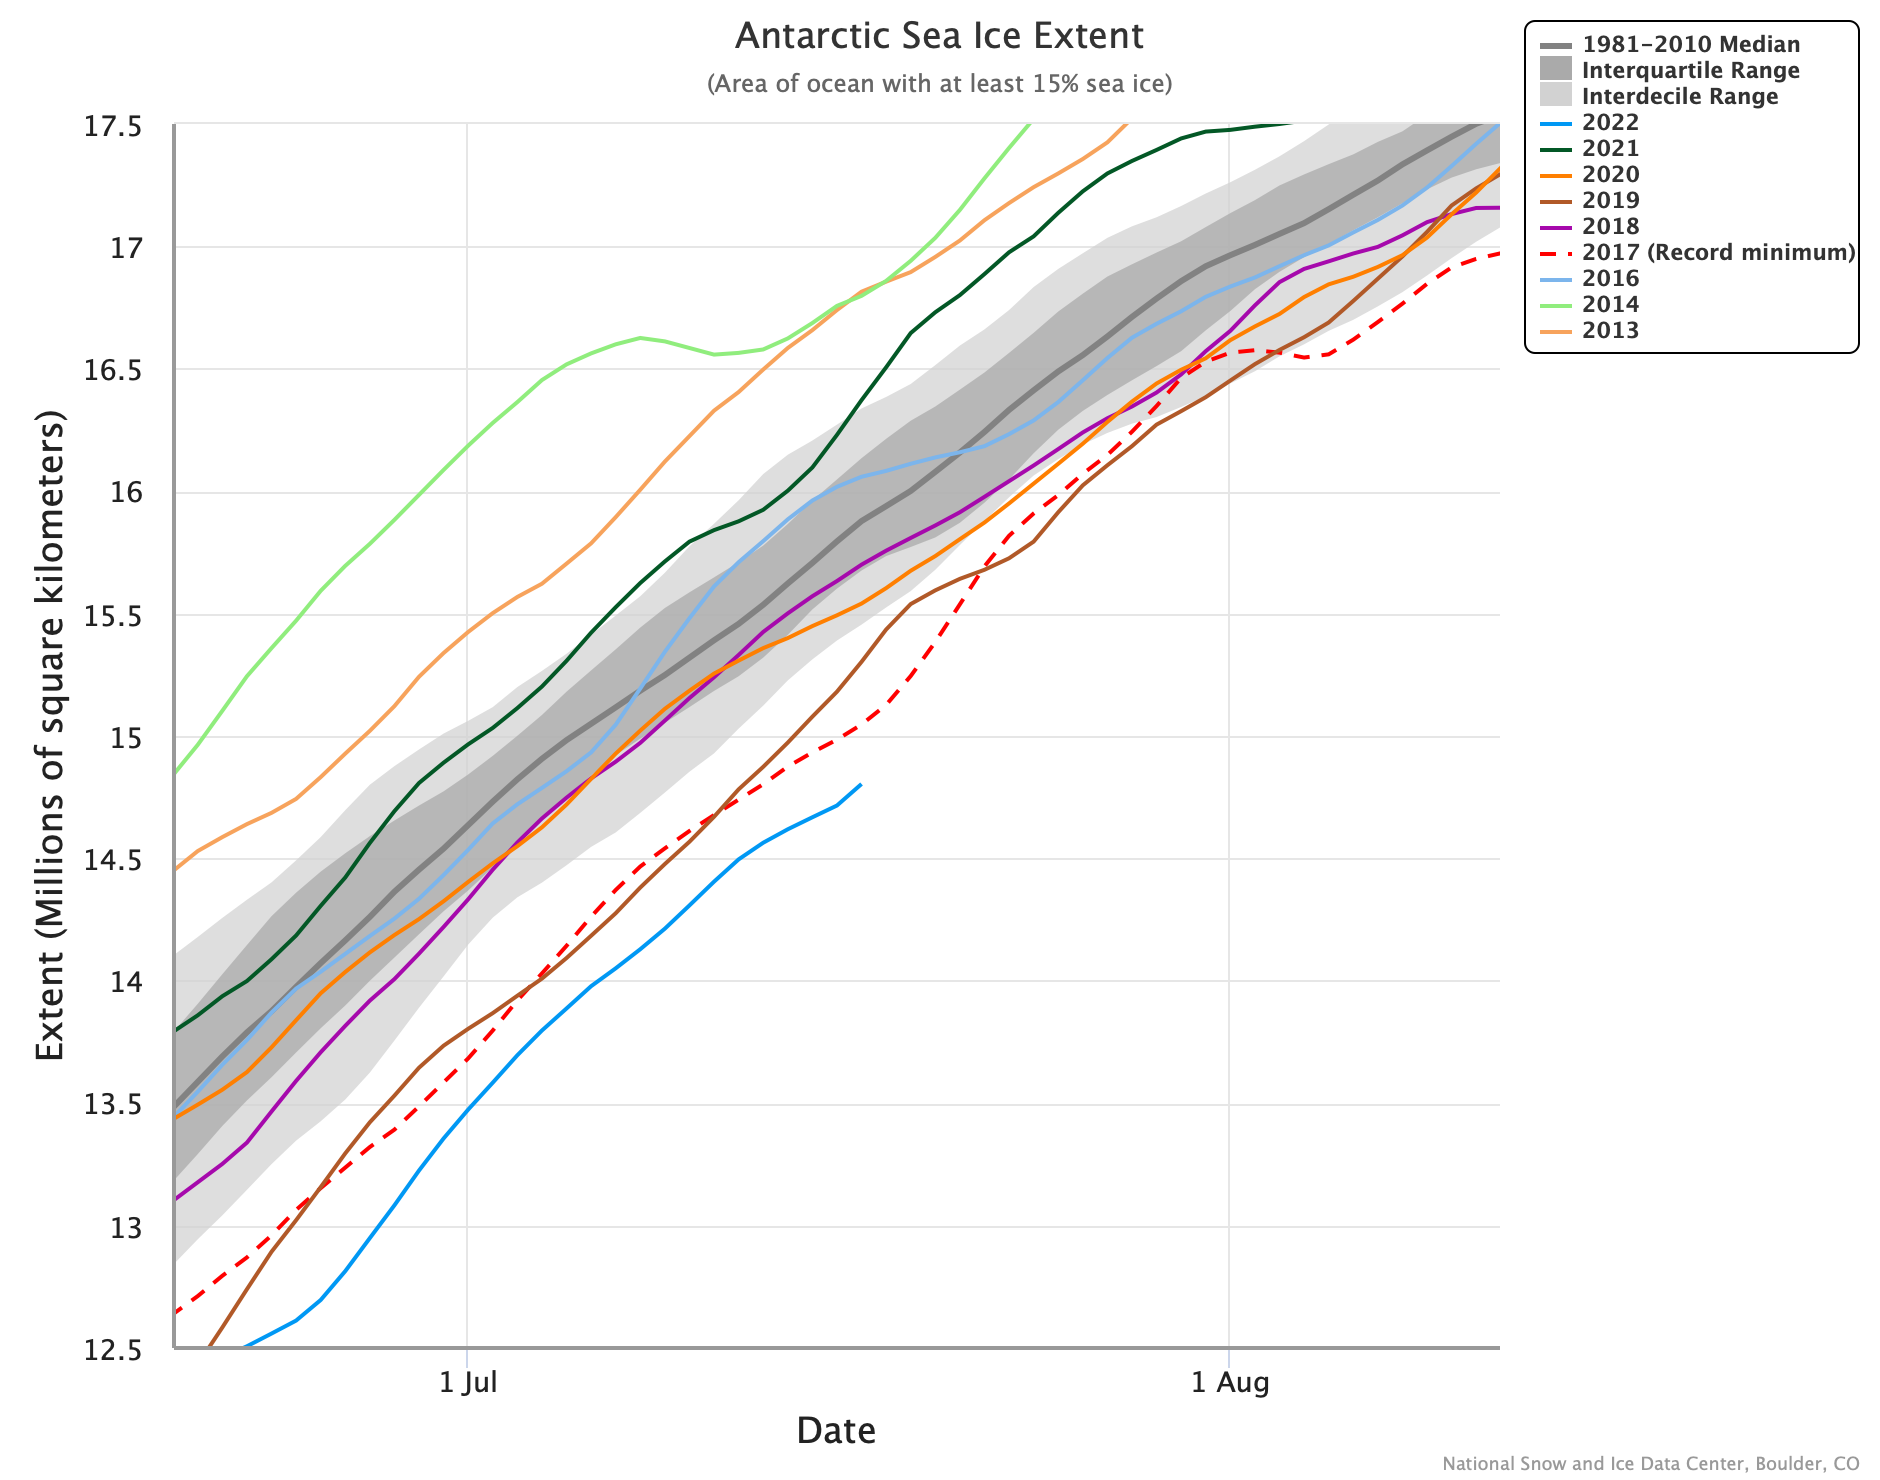
Figure 5. The graph above shows Antarctic sea ice extent as of July 17, 2022, along with daily ice extent data for seven previous years and the 2017 record low year. 2022 is shown in blue, 2021 in green, 2020 in orange, 2019 in brown, 2018 in magenta, 2016 in light blue, 2014 in light green, 2013 in light orange, and 2017 in dashed red. The 1981 to 2010 median is in dark gray. The gray areas around the median line show the interquartile and interdecile ranges of the data. Sea Ice Index data.
Credit: National Snow and Ice Data Center
High-resolution image
As of July 17, Antarctic sea ice extent was 14.80 million square kilometers (5.71 million square miles), roughly 240,000 square kilometers (92,700 square miles) below the previous record daily low set in 2017 and 1.14 million square kilometers (440,000 square miles) below the 1981 to 2010 average extent for July 17 (Figure 5). Nearly all regions of coastal Antarctica were below the average extent for mid-July, with the Amundsen and Bellingshausen Seas showing the largest deficits. Ice extent along the northern edge of the Weddell and Dronning Maud sectors, and the region near the Amery Ice Shelf, was also far below average. The polynya that appears in some years in the Cosmonaut Sea has returned. A few areas of the Ross Sea and Wilkes Land have near or slightly above average extent in the satellite record. Temperatures at the 925 millibar level are 3 to 6 degrees Celsius (5 to 11 degrees Fahrenheit) above average for a wide swath of the Antarctic Peninsula and West Antarctic coast, and the Weddell Sea ice edge region is 2 to 3 degrees Celsius (4 to 5 degrees Fahrenheit) above average, with the remaining coast near-average or slightly below.
References
Connolly, R., M. Connolly, W. Soon, D. R. Legates, R. G. Cionco, V. M. Velasco Herrera. 2019. Northern Hemisphere Snow-Cover Trends (1967–2018): A Comparison between Climate Models and Observations. Geosciences. 9(3):135. doi:10.3390/geosciences9030135.
Petty, A. A., R. Kwok, M. Bagnardi, A. Ivanoff, N. Kurtz, J. Lee, J. Wimert, and D. Hancock. 2021. ATLAS/ICESat-2 L3B Daily and Monthly Gridded Sea Ice Freeboard, Version 3. [March 2022]. Boulder, Colorado USA. NASA National Snow and Ice Data Center Distributed Active Archive Center. doi:10.5067/ATLAS/ATL20.003. [Accessed 14 Jul 2022].
Rousi, E., K. Kornhuber, G. Beobide-Arsuaga, and others. 2022. Accelerated western European heatwave trends linked to more-persistent double jets over Eurasia. Nature Communications. 13, 3851. doi:10.1038/s41467-022-31432-y.
Zhang, R., C. Sun, J. Zhu, R. Zhang, and W. Li. 2020. Increased European heat waves in recent decades in response to shrinking Arctic sea ice and Eurasian snow cover. Nature Partner Journals: Climate & Atmospheric Science. 3, 7. doi:10.1038/s41612-020-0110-8.

