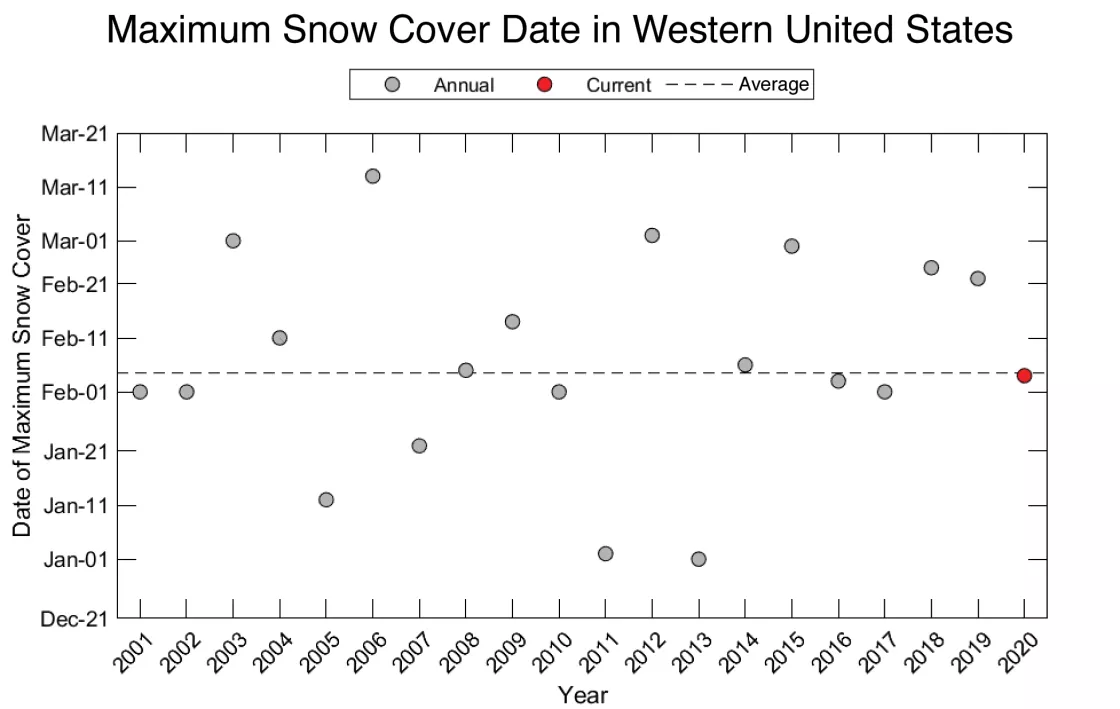
- The typical date for annual maximum snow cover has passed.
- Barring a major change in snowstorm activity, the snow cover across the West will continue to decline with the seasonal warming.
- February continued to see a trend of below average snow cover across the Western United States.
- Late January and early February storms replenished snow cover in some areas, but drought continues to impact California.
- February 2020 had the sixth lowest snow cover for the month in the 20-year satellite record.
- Despite below average snow cover, the Snow Water Equivalent (SWE) remains near average or above average for many locations across the West, outside of California, Arizona, southern Oregon, and south/central Idaho.
Overview of conditions
| Snow-Covered Area | Square Kilometers | Square Miles | Rank |
|---|---|---|---|
| 2020 | 715,000 | 276,00 | 15 |
| 2001 to 2019, Average | 795,000 | 307,000 | -- |
| 2001, Highest | 1,159,000 | 447,000 | 1 |
| 2015, Lowest | 457,000 | 176,000 | 20 |
| 2019 | 1,143,000 | 441,000 | 2 |
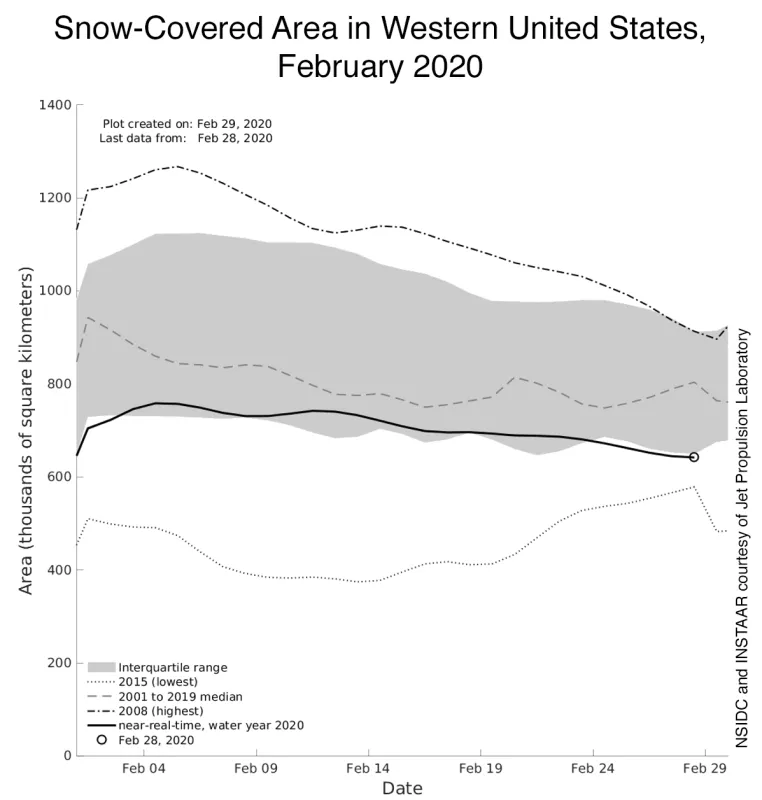
As averaged for February 2020, snow-covered area for the Western United States was 715,000 square kilometers (276,000 square miles) (Table 1). This was the sixth lowest (or fifteenth highest) snow cover in February in the 20-year satellite record. For comparison, there was 80,000 square kilometers (31,000 square miles) less snow-covered area in February 2020 than the average computed over the 2001 to 2019 reference period. The February with the greatest snow cover since 2001 was in 2001, when an average of 1.16 million square kilometers (448,000 square miles) blanketed western North America, 444,000 square kilometers (171,000 square miles) more than in 2020. The February with the least snow cover since 2001 occurred in 2015, when snow covered an average of only 457,000 square kilometers (176,000 square miles), 259,000 square kilometers (100,000 square miles) less than 2020. Comparing February to the same month a year ago, there was 428,000 square kilometers (165,000 square miles) less snow cover in February 2020 than in 2019. Through February 2020, the lowest daily snow coverage was 636,000 square kilometers (246,000 square miles) occurring on February 29, 2020, while the highest daily snow coverage was 765,000 square kilometers (295,000 square miles) occurring on February 4, 2020. As of this post, the annual maximum snow cover in 2020 also occurred on February 4.
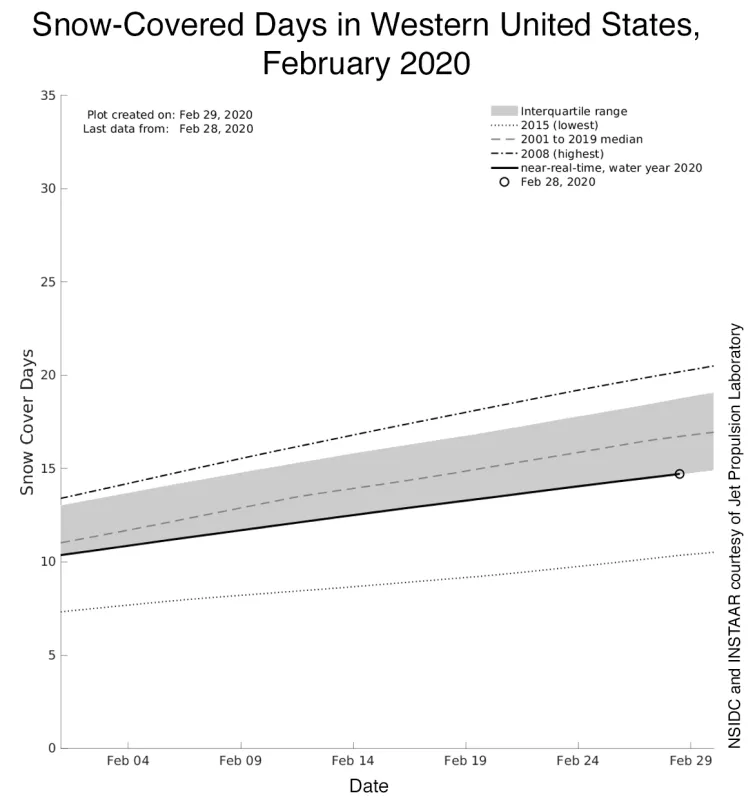
Between October 1, 2019, the start of the water year, and February 29, 2020, there were 15 snow-covered days when averaged over elevations greater than 1200 meters (3,900 feet) in the Western United States (Figure 1b). Over that domain, there were 10.5 snow-covered days at the start of February 2020, 0.6 fewer days than the 2001 to 2019 average at the start of February. By the end of February 2020, there were 1.9 fewer snow-covered days than the 2001 to 2019 average. From the start to the end of February, the current year had a smaller increase in snow-covered days, relative to more average years (Figure 1b).
Conditions in context
Snow cover in the Western US peaked in early February 2020 and has been generally declining since then (Figure 1a). In the West, snow-covered area typically peaks in early February, but the timing of the peak varies annually between early January and early March depending on snow accumulation amounts and temperatures. Analysis of the last 20 years shows the timing of maximum snow cover in 2020, as of this post, fell almost exactly on the average date (Figure 2).
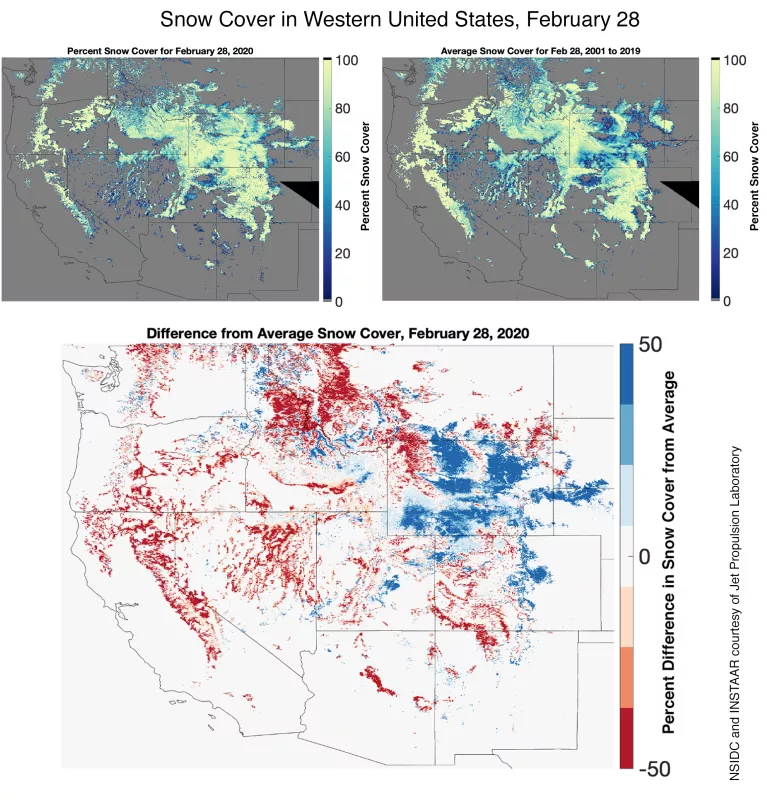
Comparing snow cover at the end of February 2020 to the average for 2001 to 2019, less snow cover topped the lower elevation areas surrounding major mountain ranges like the Sierra Nevada and Cascades. Less continuous snow cover was also present in areas like Arizona, western Montana, and northern Idaho (Figure 3). The lack of snow cover in many of these regions resulted in 2020 being the sixth lowest February snow cover in the 20-year satellite record for the Western United States (Table 1). Although the storm frequency was comparable to previous Februaries in areas like California, northern Montana, and Idaho, the storms were not as intense, notably in California. Throughout February, the drought in California intensified and expanded north in the state. However, frequent storms in Utah, Colorado, Wyoming, and southern Montana led to above average snow cover and Snow Water Equivalent (SWE) conditions in those states. Among these states, Wyoming ended February with notably higher snow cover than average (Figure 3).
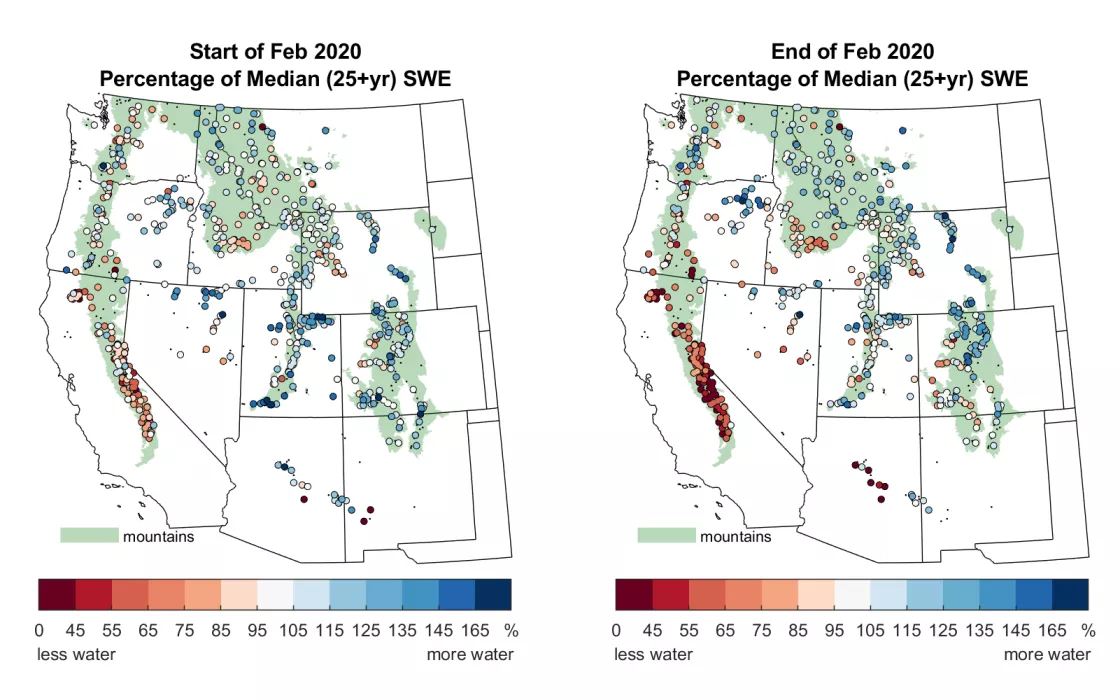
In contrast to the timing of maximum snow cover in early February, SWE tends to reach its maximum value at mountain sites between March and May in the Western United States. However, SWE patterns in February hint at a preview of what the snowpack may look like during the time of typical maximum accumulation, unless there are major storms in the coming weeks. February 2020 started with slightly above average SWE conditions in nearly all states except California (Figure 4, left). That trend prevailed through the end of February with most regions remaining at or above average (Figure 4, right). California’s drought spread northward through the Sierra Nevada and into parts of the southern Oregon Cascades, with portions of the most southern mountains in Idaho showing slightly drier conditions as well. Sites in central Arizona started at near average conditions at the beginning of February but ended the month at 50 percent or below average. Colorado fared slightly better than Utah across the month as did eastern Oregon and northern Wyoming.
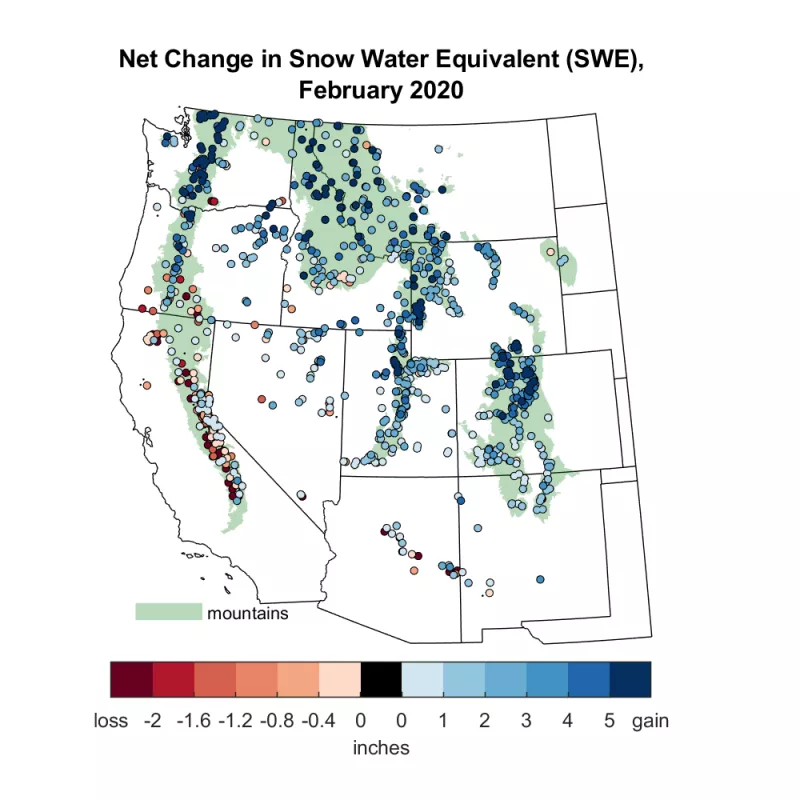
The winter snowpack continued to build in many areas with SWE in February increasing over 5 inches at many stations (Figure 5). The Pacific Northwest, northern Colorado and Utah, western Wyoming, and the Idaho-Montana border had several stations with large increases in SWE. Lower elevation stations in California had a loss of SWE as much as 2 inches, because of the combination of melt and little new accumulation. Higher elevation stations in California gained only an inch of water.
Figure 5. This map shows the change in Snow Water Equivalent (SWE) in inches during February. There were larger increases in the Pacific Northwest compared to the southern mountain ranges in California, Utah, southern Colorado, New Mexico, and Arizona. The green shading delineates mountainous areas as represented in Environmental Protection Agency (EPA) data.
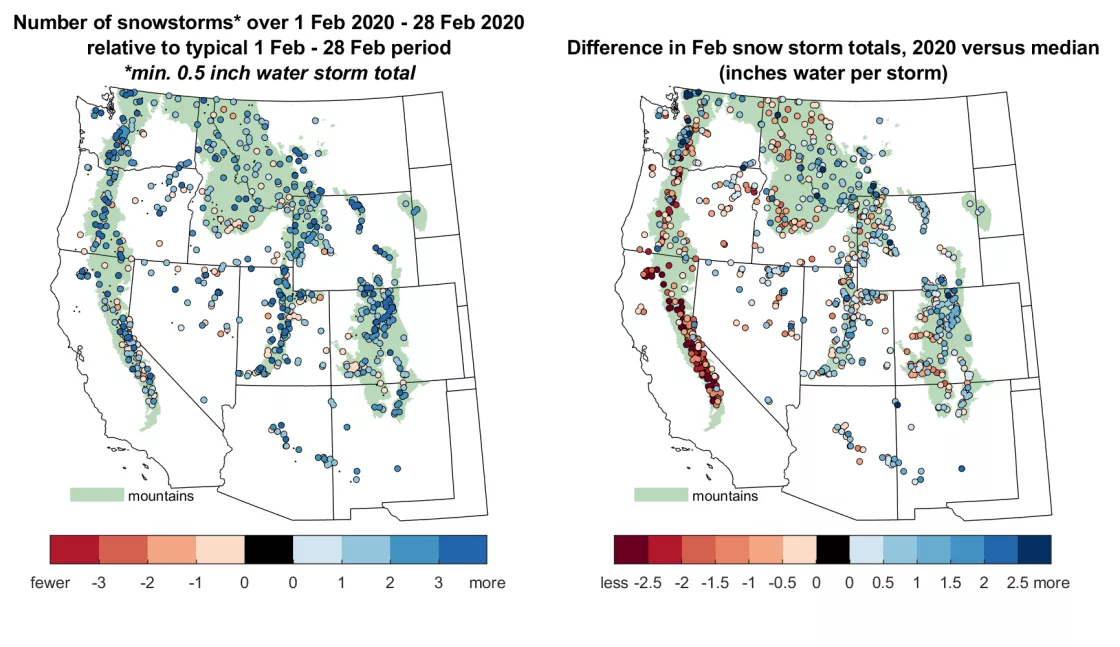
To understand the changes in SWE through February the following were analyzed: the number of snowstorms, the average amount of water delivered across the storms, and the amount of snowmelt. A higher than average number of February storms (Figure 6, left) brought snow cover back to slightly within 50 percent of the historical average (Figure 1). However, the storms delivered less water on average (Figure 6, right) in most of California, northern Idaho, western Montana, and parts of the Pacific Northwest.
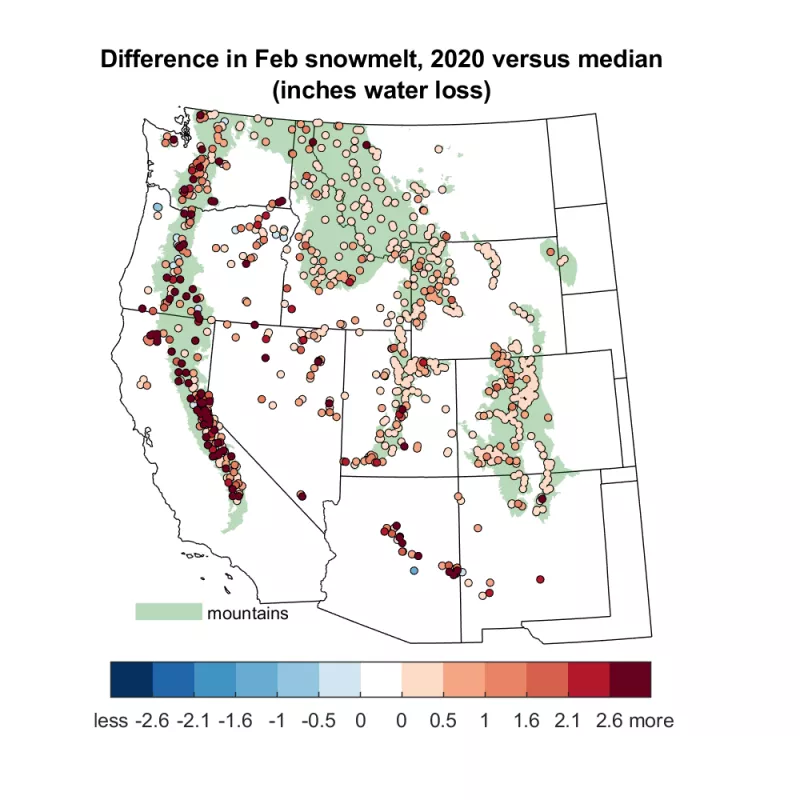
In February, some melt occurred in all regions of the Western US (Figure 7) with the highest melt relative to average in California, the Pacific Northwest, New Mexico, and Arizona. Locations in the Rocky Mountain states (Colorado, Utah, Wyoming, Idaho, and Montana) had the least snowmelt relative to the average. In some areas like California, the melt occurred in tandem with weak snowstorms (Figure 6, right) to deliver low SWE conditions. In other areas like central Arizona, the melt (Figure 7) appears to have been greater than the gains from new snowstorms, leading to the drastic change from near-average SWE to very low SWE. Changes in SWE (Figure 5) in the Pacific Northwest were buffered from elevated melt rates (Figure 7) by larger snowfall amounts from new storms (Figure 4).
NASA SnowEx 2020 update: Snow water equivalent and snow-covered area
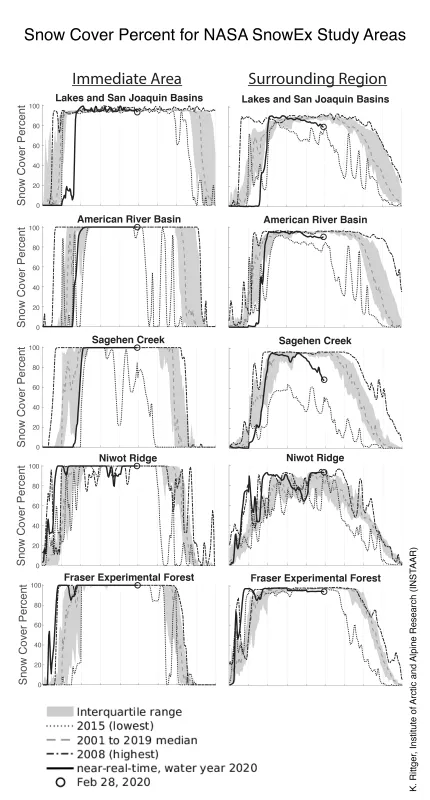
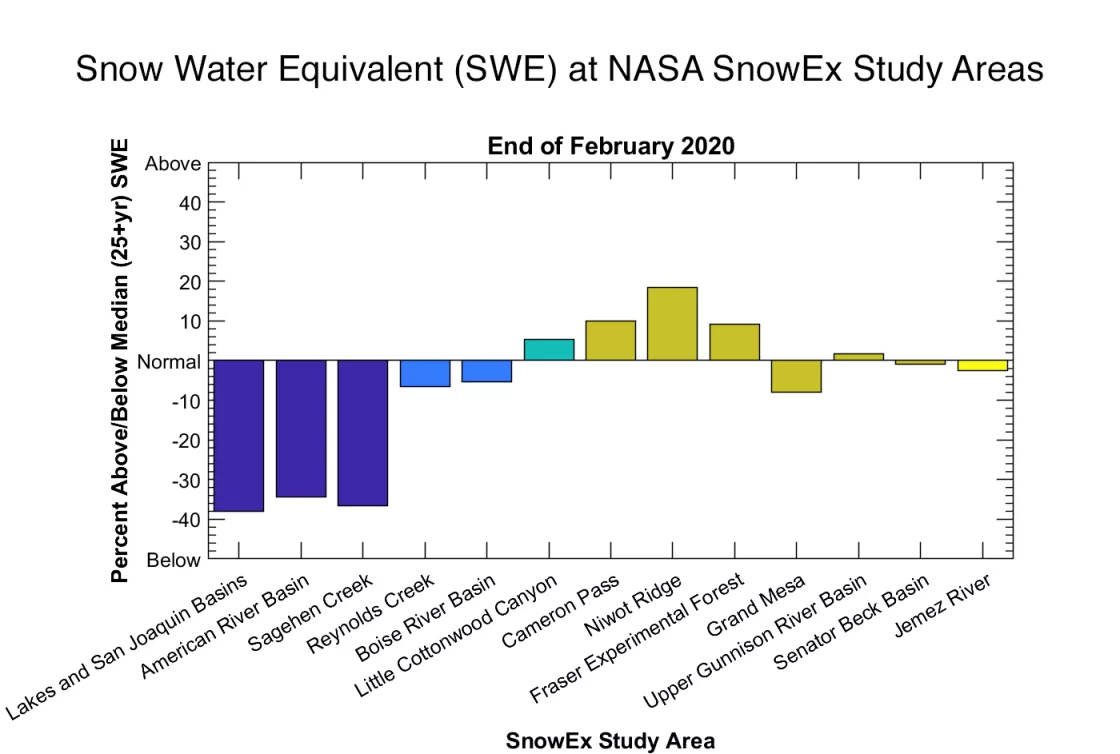
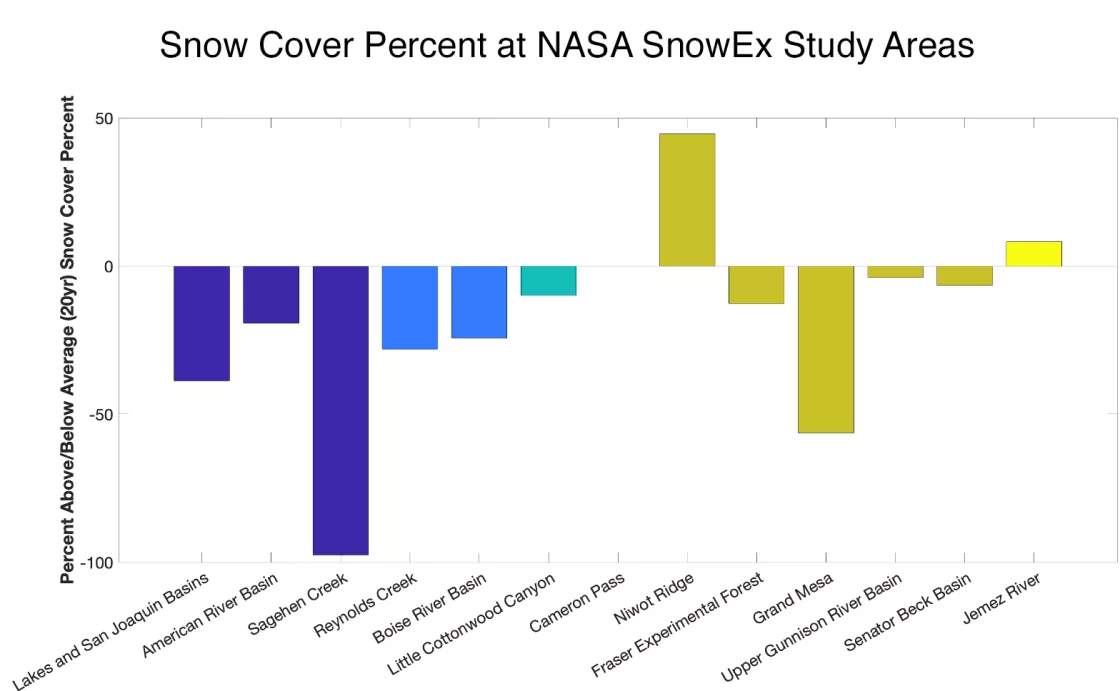
The relationship between snow cover and SWE has long been a topic of interest and research to help estimate the water stored in snow. Relationships between snow cover and SWE can be used to understand regional or basin wide patterns and averages but are not always transferable and do not provide information on the spatial distribution of SWE, a goal of the NASA SnowEx campaign. This month’s SnowEx update examines the variability of snow cover in regions around each SnowEx study site (Figure 8) and compares historical snow cover and SWE (Figure 9).
Many of the SnowEx sites are in regions that are consistently snow covered for the entire snow season. Satellite data for the immediate region (Figure 8, left column) surrounding each study site at 2 square kilometers (.77 square mile) show little variability because of this site characteristic. For example, the Lakes and San Joaquin Basins, American River Basin, and Sagehen Creek—all located in California—show little sign of the drought in the Sierra Nevada that is clear in the regional analysis (Figure 3 and Figure 4). By analyzing snow cover from the surrounding region (Figure 8, right column) including the nearest 360 square kilometers (139 square miles), snow cover across different elevations and topographic characteristics are included, and the variability between years becomes clearer as does the regional drought in California. These data can provide insights into areas with below average snow, like in California, but is less informative in area with above average snow, like in Niwot Ridge and Fraser Forest in Colorado. This is because snow cover surrounding those areas is already at or near the maximum coverage (Figure 8) for both the immediate and surrounding regions.
Snow water equivalent analysis
SWE at SnowEx sites in California went from approximately 15 percent below average in January (see previous post) to over 30 percent below average in February (Figure 9a). The Idaho sites had SWE shifting from slightly above average in January to slightly below average in February. The five Colorado sites had a mix of above and below average SWE in January and February. For example, Senator Beck went from well above average to below while Niwot went from above average to higher. Cameron Pass and Grand Mesa lost SWE as did Jemez River.
The snow cover differences from average in the surrounding (Figure 8, right column) regions around each SnowEx study site appears to be somewhat indicative of SWE (Figure 9a). The regions immediately coincident with the sites (Figure 8, left column) did not show similar relationships. In general, the snow cover seems to be well correlated, but Little Cottonwood and Jemez River are exceptions.
Snow Today will continue to provide updates on snow conditions at the SnowEx sites as the 2020 winter evolves. While it is unlikely that snow cover will increase, higher values of SWE may occur especially in high elevations. Measurements are planned until early May. Knowing both the historical average and current conditions provides useful context for scientists collecting and analyzing data in these intensive field campaigns.
References
Rittger, K., M. S. Raleigh, J. Dozier, A. F. Hill, J. A. Lutz, and T. H. Painter. 2019. Canopy Adjustment and Improved Cloud Detection for Remotely Sensed Snow Cover Mapping. Water Resources Research 24 August 2019. doi:10.1029/2019WR024914.
