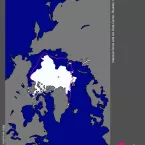
Our Research
As climate changes, how do Earth's frozen areas affect our planet and impact society?
In this section
Related News & Stories
Filter by:
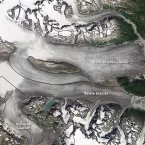
Feature Story
All the data in the world does little good if scientists cannot access it. For more than twenty-five years, NSIDC has provided open access data, data that are freely and publicly distributed from its Web site, from various remote sensing and field missions.

Spotlight
Concerned about the experience of searching for data, NSIDC staff asked its User Working Group for input.
Ice Sheet Analysis
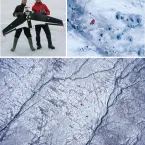
Melting on the surface of the Greenland Ice Sheet in June and July 2014 has been well above the 1981 to 2010 average in most areas, but after a fast start in May, the southern region and the southeastern coast have seen lower-than-average melt.

Ice Sheet Analysis
Surface melting on the Greenland Ice Sheet in May 2014 proceeded quickly, despite cool conditions over wide areas. We continue to explore recent evidence of lower snow reflectivity, and note its likely impact on snow melt during Greenland's summer season.
Ice Sheet Analysis
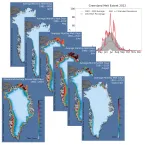
The Greenland Ice Sheet had a far more typical melt extent and intensity in 2013 than in 2012, when summer surface melting set a record, compared to satellite observations since 1978.
