Our Research
As climate changes, how do Earth's frozen areas affect our planet and impact society?
In this section
Related News & Stories
Filter by:

Analysis - Snow Today
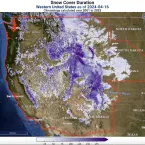
Snow-covered area in May 2024 across the western United States was 56 percent above average (Table 1), at 156,000 square kilometers (60,000 square miles) of snow cover, ranking third highest in the 24-year satellite record. May snowfall brightened the snow cover in some areas while others darkened from lack of snowfall.

Analysis - Sea Ice Today
The sea ice cover in May 2024 was marked by an unusually early opening of eastern Hudson Bay. Overall, the rate of decline in the Arctic was near average for the month.

Analysis - Snow Today
Snow-covered area was 203 percent of average for April, ranking second highest in the 24-year satellite record. Despite a snowy April, snow cover days were below average because of a widespread slow start to the snow season. States in the north reported below-average snow water equivalent, while the opposite was true for states in the south.

Analysis - Sea Ice Today
April sea ice loss in the Arctic proceeded at a near-average rate overall, with the majority of ice losses in the Bering Sea and Sea of Okhotsk. In the Antarctic, sea ice grew faster than average, roughly evenly around the entire continent.

Analysis - Sea Ice Today
Following the 2024 maximum sea ice extent on March 14, Arctic ice extent has declined slowly such that 2024 March average is the fifteenth lowest in the passive microwave satellite record.

Analysis - Ice Sheets Today
In late February and early March, two record melt events for that time of year occurred on the Antarctic Peninsula. Overall, however, the 2023 to 2024 melt season was slightly below the 45-year average because of low melt regions outside of the Antarctic Peninsula.