By Audrey Payne
Each day, the NASA Terra satellite, which launched in December 1999, orbits the Earth, passing north to south across Earth's equator in the morning. The Aqua satellite, which launched in May 2002, also circles the planet simultaneously, crossing the equator from south to north in the afternoon. The orbits of these satellites are sun-synchronous, meaning they pass over the same spot of the Earth at about the same local time each day. Each satellite is equipped with a Moderate Resolution Imaging Spectroradiometer (MODIS), a remote sensing instrument designed to collect atmospheric, land, and ocean imaging in a single device. The instruments image the same area of Earth three hours apart, and in combination, they view the entire Earth’s surface every one to two days. While the satellites were initially intended to last six years, they are still in orbit and collecting data to this day.
Because these satellites have polar orbits, the information they gather helps to track changes occurring to the cryosphere, or the frozen parts of the planet, and they provide a continuous global record since the Aqua satellite launched. This includes collecting information about snow.
The NASA National Snow and Ice Data Center Distributed Active Archive Center (NSIDC DAAC) manages a range of MODIS data, making a suite of snow cover and sea ice data products freely accessible to the public. These data can be used to investigate how snow and ice cover have changed over time, to study Earth’s energy balance, and to feed global and polar climate models. Recently, the NSIDC DAAC published a new MODIS data set, MODIS/Terra Global Annual 0.01Deg CMG Snow Cover Climatology, Version 1.
This data set focuses on global snow cover climatology from 2001 to 2023 using data from the Terra satellite and presents information using global maps. Parameters include:
- Snow cover duration
- Snow cover duration climatology
- Core snow season length
- Core snow season length climatology
- Full snow season length
- Snow persistence
- Snow persistence climatology
- Snow season persistence
- Snow season persistence climatology
- MODIS snow cover seasonality classification
- Snow seasonality class climatology.
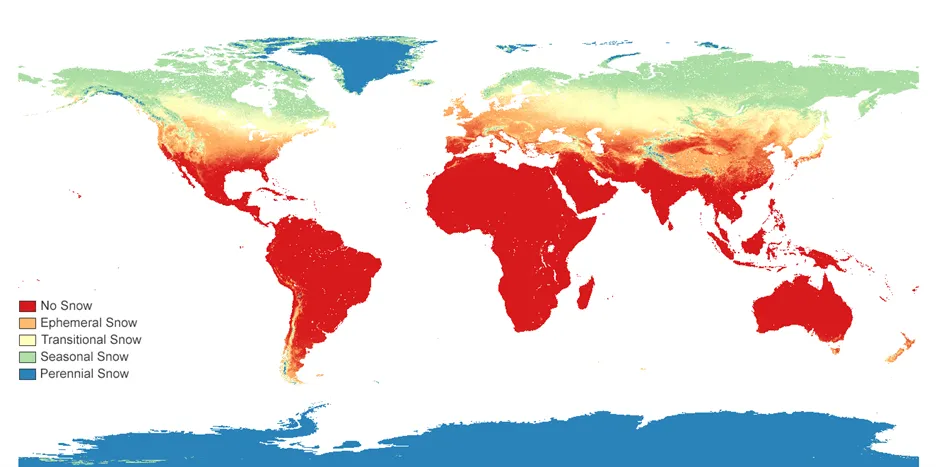
One parameter that users may find particularly interesting is snow class climatology, which shows how much snow different areas of Earth have during the snow year. The snow year spans from October through the following September. The map, which comes with a default color scheme that can be changed to reflect individual needs like emphasizing specific data points or trends, increasing accessibility, and making visualizations more user-friendly, classifies areas as having:
- (0) No Snow
- (1) Ephemeral Snow
- (2) Transitional Snow
- (3) Seasonal Snow
- (4) Perennial Snow.
It can be used to find out where snow is sometimes, always, or never. It can also be used to view the changes in snow over time. This information is valuable for water managers, policymakers, and scientists for a myriad of reasons. For example, because snow is white in color, it is highly reflective. The majority of the sun’s energy that hits snow is reflected back into space, helping to keep the planet cool. In addition, snow is a major water source for communities around the world. As the snowpack changes because of global warming, water managers need to be aware and ready with mitigation strategies.
These data can be downloaded from the NSIDC DAAC and explored using various analysis or visualization tools such as Panoply or QGIS. With these two applications, users can zoom in or out, changing their focus from regional to global, alter the color schemes of the maps, and change the time period covered. They can also be used to compare each snow year from 2001 to 2023 to the average. Several tools can be used (e.g., software programs such as Python or R) to explore and analyze these data.
Access data through the NSIDC DAAC
Users looking to work with NSIDC data are invited to explore our help articles, data tools, documentation, training, and on-demand support.
Johnston, J.M., J.M. Jacobs, and E. Cho. 2024. MODIS/Terra Global Annual 0.01Deg CMG Snow Cover Climatology, Version 1. [Indicate subset used]. Boulder, Colorado USA. NASA National Snow and Ice Data Center Distributed Active Archive Center. https://doi.org/10.5067/9R1AM6NNZLTV.

