By Agnieszka Gautier
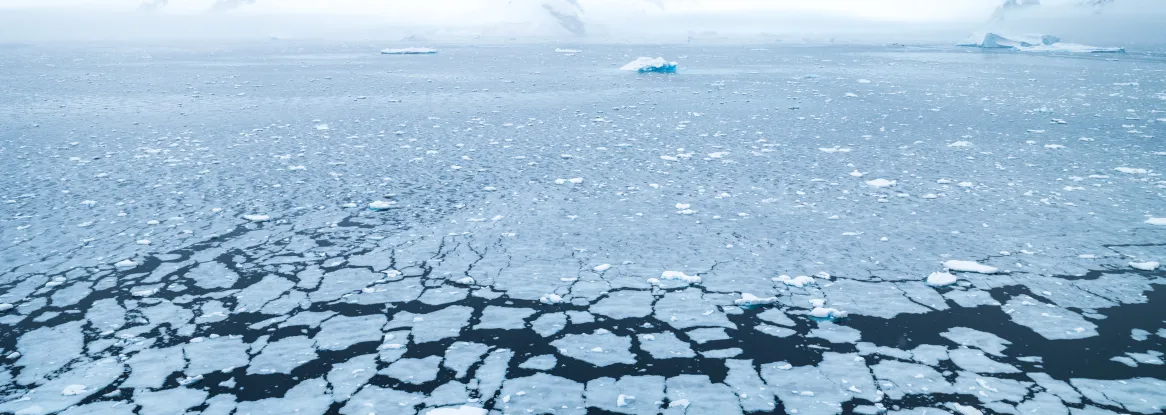
During the coldest and darkest months in the Southern Hemisphere, Antarctic sea ice—uninhibited by nearby landmasses—stretches up to 2,000 kilometers (1,200 miles) away from the continent. Its total maximum extent, typically reached in early October, averages about 18.71 million square kilometers (7.22 million square miles), or about twice the size of Canada.
After decades of watching Arctic sea ice extent drop as climate warms, scientists have yet to see Antarctic sea ice set a definitive trend. “Antarctic sea ice has always been a puzzle,” said Sharon Stammerjohn, senior researcher at the Institute of Arctic and Alpine Research (INSTAAR) at the University of Colorado Boulder. Its extents have waxed and waned from lows to highs within a year.
But what happened in the winter of 2023 still shocked scientists.
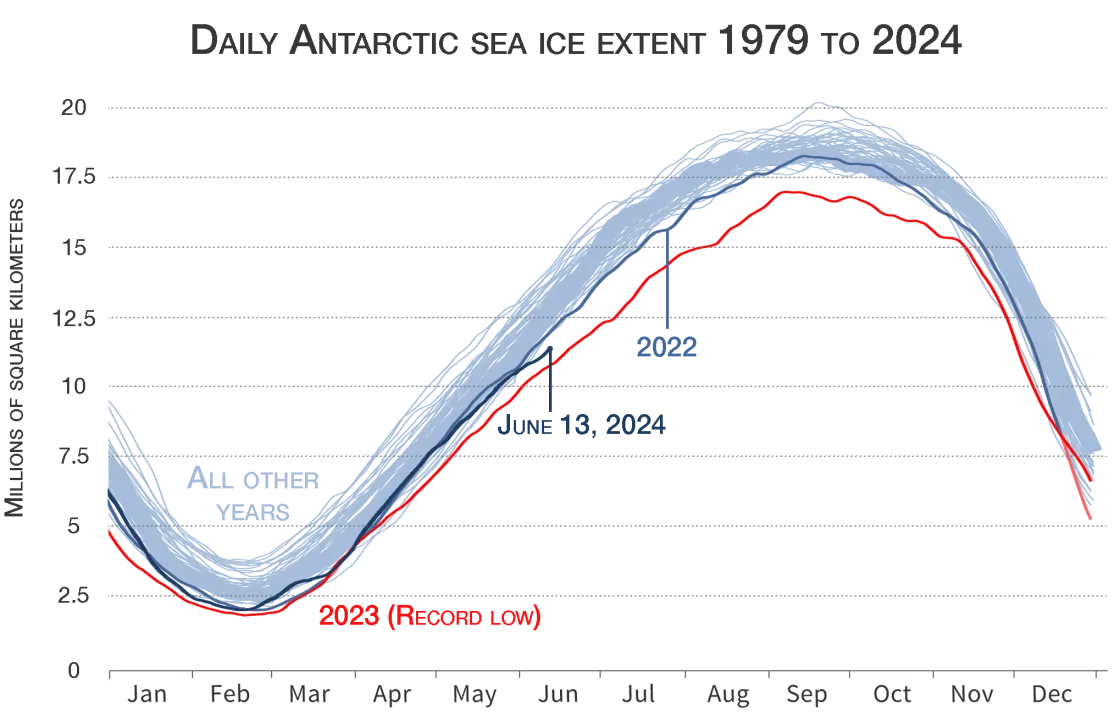
“It was completely off the rails,” said Ted Scambos, senior researcher with the Cooperative Institute for Research in Environmental Sciences (CIRES). Throughout the 2023 austral winter, sea ice was far below any previous winter extent in the 45-year satellite record. On September 10, 2023, Antarctic sea ice bottomed out at 1.75 million square kilometers (676,000 square miles) below the 1981 to 2010 average. Sea ice extent also hit a record low in the summer of 2023 for a second year in a row. In fact, 2017, 2018, and 2022 all hit record lows.
Now scientists are eager to know if climate change has finally caught up with Antarctic sea ice. Several recent studies explore that idea using statistical analysis of sea ice extent data from the NASA NSIDC Distributed Active Archive Center (DAAC). Their analyses may also have found the culprit behind the dramatic changes taking place in the Southern Hemisphere: ocean temperatures. The consequences of a warming ocean may stretch far beyond the Antarctic Ice Sheet, which holds enough land ice to sink low-lying coastlines around the world.
Polar opposites
The Arctic Ocean differs from the Southern Ocean surrounding Antarctica in several ways. Land masses fringe the Arctic Ocean, with broad, shallow continental shelves resembling an estuarial system in some locations. Locked in by land masses, Arctic sea ice has limited exchange with the Atlantic and Pacific Oceans. Thick multiyear ice pads its deeper center, but that has been shifting since the 1990s with much thinner ice dominating the Arctic Ocean now. “Arctic sea ice is behaving as we have come to expect,” Stammerjohn said. Sea ice has been steadily receding in step with polar amplification, where the Arctic is warming two to four times the rate of other regions on Earth.
“That is not the case in the Southern Ocean,” Stammerjohn said. “Climate change is still acting on that system, but the expansive and deep Southern Ocean responds much more slowly to temperature changes.”
Declining Antarctic sea ice concerns scientists, because like sea ice in the Arctic, it helps cool the planet by reflecting solar heat off its white surface back into space. But unlike the Arctic, sea ice in the Southern Hemisphere also helps stabilize a massive glacial mass, the Antarctic Ice Sheet, from entering the ocean and amplifying sea level rise. “Sea ice, in various forms, has a connection to the mass balance of the Antarctic Ice Sheet,” Scambos said. “For instance, loose, drifting sea ice snuffs out ocean waves that can flex and fracture the ice edges floating off the ice sheet. Whereas, smooth continuous sea ice that is attached to the coast, called fast ice, stabilizes ice shelves and glaciers.” Ice shelves are extensions of land ice that float onto the ocean, but if they collapse, the brakes lift on keeping land ice on land.
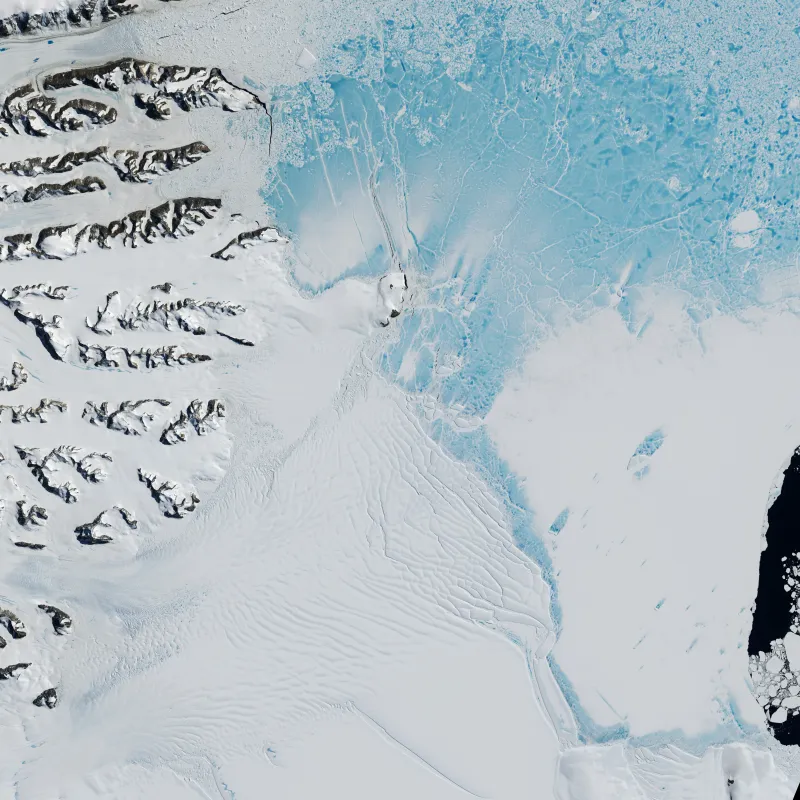
A 2018 study investigated the role of sea ice behind the collapse of the 2002 Larsen B and the 2008 Wilkins Ice Shelves located on the Antarctic Peninsula, which has been warming five times faster than the global average. The study pointed to the loss of sea ice as the cause behind boosting wave action that triggers the collapse of ice shelves.
A process known as hydrofracturing is part of that process and has been a significant contributor to the rapid disintegration of several major ice shelves in the Antarctic Peninsula. “During the melt season, melt water can pool on top of the ice shelves,” Scambos said. “Waves shake the ice shelves, like a rug but on a much smaller amplitude, cracking its surface. Water then seeps inside and deepens the cracks that eventually can cause the ice shelves to shatter.” Consequently, the Antarctic Ice Sheet, which covers an area larger than the United States and Mexico combined, dumps more land ice into the ocean and increases sea levels globally. From 2000 to 2023, sea levels rose about 3 inches (7.6 centimeters) with a third of that contribution coming from the Greenland and Antarctic Ice Sheets. So, anything that holds back the ice sheet, like ice shelves and sea ice, is an asset, but now, there is less of it.
Shifty sea ice
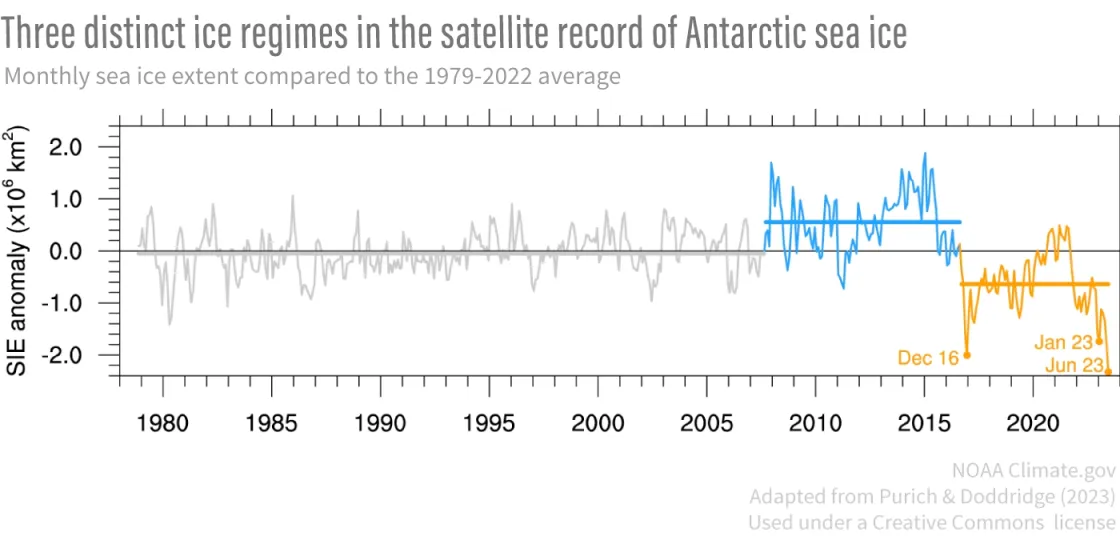
Variability has been the norm for sea ice in the Southern Hemisphere, but beginning in September 2007, things began to take a noticeable shift, according to Stammerjohn, who pointed to a 2023 paper by colleagues Ariaan Purich and Edward Doddrige from Australia, which used data archived at the National Oceanic and Atmospheric Administration at NSIDC (NOAA@NSIDC). The scientists used mathematical calculations of satellite sea ice measurements to gauge variability in sea ice extent. Using standard deviation, a measure of how far the data spread above or below the average, the scientists identified three distinct periods from 1978, when the satellite record began, to 2023. The first period, from November 1978 to August 2007, maintained a consistent degree of variability between highs and lows. Then in September 2007, variability intensified, leaning toward record highs, and by September 2016, variability continued to deviate toward intense record lows.
“Not only was there a dramatic increase in variability after 2007, but the differences from average lasted longer,” Stammerjohn said. So, lows stayed low longer, and highs stayed high longer. Atmospheric conditions have predominantly pushed sea ice levels one way or another. But large-scale climate drivers like the Southern Annular Mode or the El Niño Southern Oscillation did not explain these broad deviations.
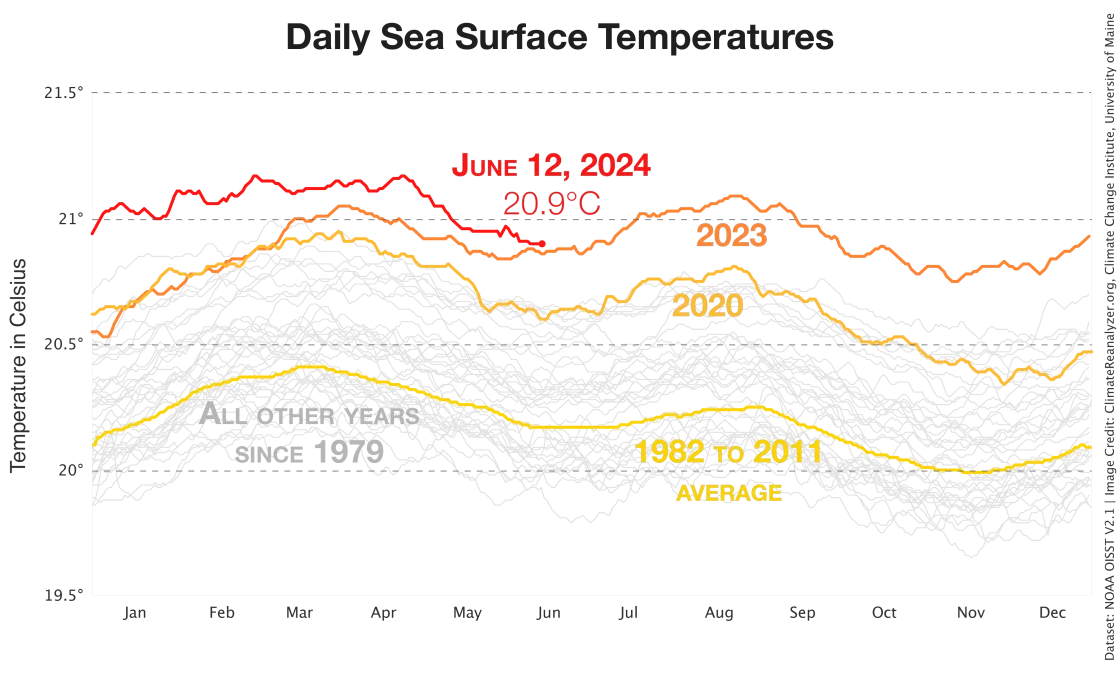
One component, however, stood out. The most recent period of record lows correlates with warming in the Southern Ocean. In 2023, the global ocean’s average surface temperature hit above 1 degree Celsius (1.8 degrees Fahrenheit) for the first time. It has remained there with no indication that the temperature is going down.
Keeping the planet cool
The oceans absorb more than 90 percent of atmospheric heat, and the Southern Ocean is a major buffer against climate change. It absorbs as much as 75 percent of heat and 40 percent of human-generated carbon dioxide of global oceans. “It’s remarkable to me that it absorbs so much heat,” Stammerjohn said. “Imagine if it didn’t. We wouldn’t be here. The oceans are doing us a big favor.” Without the ocean’s role as a carbon sink, atmospheric temperatures would be considerably higher.
The way oceans absorb heat involves varying temperature, salinity, and density layers. Sea ice is a critical component in forming these layers. As the top layer of the ocean freezes, it pushes out most of the salt within its crystal ice structure. That salt, denser than fresh water, sinks deep into the Southern Ocean, driving global ocean circulation and allowing the Southern Ocean to take up heat. The coldest, saltiest water in the ocean is the densest. To drive the conveyor belt of ocean circulation, known as the thermohaline cycle (thermo meaning heat; haline meaning salt), the ocean surrounding Antarctica relies on heavy density sinking. “That cycle in the Southern Ocean is a heartbeat that drives global climate,” said Stammerjohn.
With further sea ice melt and glacial advancement into the Southern Ocean, its surface is freshening, creating a lighter water mass and disrupting the thermohaline cycle. Though it takes 1,600 years to come full circle, disruption of the thermohaline cycle will have a dramatic downstream effect hundreds of years down the line. “We wouldn’t see that now,” Stammerjohn said, “but we are seeing warming oceans less able to take up more carbon.”
Their ability to stave off atmospheric heat only decreases with rapid ocean warming, which currently is about triple the historical rate, could lead to the collapse of the West Antarctic Ice Sheet. This will release 17.4 feet (5.3 meters) of equivalent sea level rise. So, anything that holds back the ice sheet, like sea ice, is an asset.
“What we really need now is more field observations,” Stammerjohn said. The top portion of the Southern Ocean is extremely cold, at near-freezing temperatures. So how does this warmer layer of ocean water eat away at Antarctic sea ice? And are the recent lows just a weather phenomenon or a sign that things have really shifted?
Sounding the alarms
Unlike the Arctic, instrumentation on Antarctic ice shelves, sea ice, and even land ice and nunataks, does not survive the continent’s brutal, bitter winters and high winds. For that reason, little on-the-ground data exists to analyze what is happening to Antarctica’s ice its surrounding ocean. But scientists are working to change that. “It’s difficult to find autonomous instrumentation to help fill the gaps between ship and station-based observation,” Stammerjohn said. “But statistically there is every indication that the Antarctic has gone through an abrupt critical condition, pointing to a regime shift.”
For now, statistical analyses based on sea ice extent records, which are drawn from satellite data, are best at indicating a shift. “The record from NSIDC is the golden standard for most studies,” said Scambos, referring to NASA team algorithm products that are housed at the NSIDC DAAC, of which there are three (see information on three below). The one most often used is the Sea Ice Concentrations from Nimbus-7 SSMR and DMSP SSM/I-SSMIS Passive Microwave Data, Version 2 that is then ingested into the NOAA Sea Ice Index Viewer.
On point with statistical analyses of standard deviation come two studies, from 2021 and 2023, that look at regional behavior of sea ice. In the past, as overall variability was expected, so was variability in regional ice growth and melt. However, that has also shifted. Low sea ice extent once dominated certain areas, especially near the Antarctic Peninsula, but now all sectors surrounding Antarctica are responding together. Referred to as spatial coherence, this is yet another sign that something is shifting for Antarctic sea ice, not just in some areas, not just in some years, but on larger scales and for longer periods. “These Antarctic-wide sea ice changes, together with their greater variability and persistence, are three main factors that indicate a regime shift.”
In addition to this regime shift, Antarctic sea ice is also taking longer to recover from its low extents. And Stammerjohn suspects that this “recovered” ice is thinner than decades earlier, but again, better instrumentation and satellite data is required to measure sea ice thickness.
“Conceptually, I just see this wall of heat knocking at the door in the Southern Ocean and it’s starting to find ways to come in,” Stammerjohn said. “There’s no doubt about that. We must figure out how that’s happening, but it’s happening. Sea ice is just this really sensitive indicator, but it is the ice sheet that we really need to be worried about.”
Data used for sea ice analysis
NSIDC archives a variety of data sets on behalf of NASA and the National Oceanic and Atmospheric Administration (NOAA). Sea ice extent values are derived from NASA NSIDC DAAC data (DiGirolamo and Meier) and then published in the NOAA Sea Ice Index Product (Fetterer).
DiGirolamo, N., Parkinson, C. L., Cavalieri, D. J., Gloersen, P. & Zwally, H. J. 2022. Sea Ice Concentrations from Nimbus-7 SMMR and DMSP SSM/I-SSMIS Passive Microwave Data, Version 2 [Data Set]. Boulder, Colorado USA. NASA National Snow and Ice Data Center Distributed Active Archive Center, doi:10.5067/MPYG15WAA4WX.
Fogt, R., M. N. Raphael, and M. S. Handcock. 2023. Seasonal Antarctic Sea Ice Extent Reconstructions, 1905-2020, Version 1 [Data Set]. Boulder, Colorado USA. National Snow and Ice Data Center, doi:10.7265/55x7-we68.
Fetterer, F., Knowles, K., Meier, W.N., Savoie, M. & Windnagel, A.K. 2017. Sea Ice Index, Version 3 [Data Set]. Boulder, Colorado USA. National Snow and Ice Data Center, doi:10.7265/N5K072F8.
Meier, W. N., Stewart, J. S., Wilcox, H., Hardman, M. A. & Scott, D. J. 2021. Near-Real-Time DMSP SSMIS Daily Polar Gridded Sea Ice Concentrations, Version 2 [Data Set]. Boulder, Colorado USA. NASA National Snow and Ice Data Center Distributed Active Archive Center, doi:10.5067/YTTHO2FJQ97K.
Eayrs, C., X. Li, M. N. Raphael, et al. 2021. Rapid decline in Antarctic sea ice in recent years hints at future change. 2021. Nature Geoscience. 14, 460–464 (2021), doi:10.1038/s41561-021-00768-3.
Fogt, R., A. M. Sleinkofer, M. N. Raphael, and M. S. Handcock. 2022. A regime shift in seasonal total Antarctic sea ice extent in the twentieth century. Nature Climate Change. 12, 54–62, doi:10.1038/s41558-021-01254-9.
Hobbs, W. R., C. Roach, T. Roy, J.-B. Sallée, and N. Bindoff. 2021. Anthropogenic Temperature and Salinity Changes in the Southern Ocean. Journal of Climate. 34, 215–228, doi:10.1175/JCLI-D-20-0454.1.
Hobbs, W., P. Spence, A. Meyer, S. Schroeter, A. D. Fraser, P. Reid, T. R. Tian, Z. Wang, G. Liniger, E. W. Doddridge, and P. W. Boyd. 2024. Observational Evidence for a Regime Shift in Summer Antarctic Sea Ice. Journal of Climate. 37 (7), 2263-2275, doi:10.1175/JCLI-D-23-0479.1
Kopp, R. E, A. C. Kemp, K. Bittermann, B. P. Horton, J. P. Donnelly, W. R. Gehrels, C. C. Hay, J. X. Mitrovica, E. D. Morrow, and S. Rahmstorf. 2016. Temperature-driven global sea-level variability in the Common Era. Proceedings of the National Academy of Sciences, Vol. 13, No. 11, doi:10.1073/pnas.1517056113.
Massom, R. A., T. A. Scambos, L. G. Bennetts, P. Reid, V. A. Squire, and S. Stammerjohn. 2018. Antarctic ice shelf disintegration triggered by sea ice loss and ocean swell. Nature, doi:10.1038/s41586-018-0212-1.
Naughten, K. A., P. R. Holland, and J. De Rydt. 2023. Unavoidable future increase in West Antarctic iceshelf melting over the twenty-first century. Nature Climate Change. 13, 1222–1228, doi:10.1038/s41558-023-01818-x.
Purich, A., and E. W. Doddridge. 2023. Record low Antarctic sea ice coverage indicates a new sea ice state. Communications Earth & Environment, 4(1), doi:10.1038/s43247-023-00961-9.
Reid, P. A., and R. A. Massom. 2022. Change and variability in Antarctic coastal exposure, 1979–2020. Nature Communications 13, 1164, doi:10.1038/s41467-022-28676-z.
Schroeter, S., T. J. O'Kane, P. A. and Sandery. 2023. Antarctic sea ice regime shift associated with decreasing zonal symmetry in the Southern Annular Mode, The Cryosphere, 17, 701–717, doi:10.5194/tc-17-701-2023.
