What are the differences between NSIDC-0032 and NSIDC-0630 Version 1?
The main differences between the DMSP SSM/I-SSMIS Pathfinder Daily EASE-Grid Brightness Temperatures, Version 2 (NSIDC-0032) and the MEaSUREs Calibrated Enhanced-Resolution Passive Microwave Daily EASE-Grid 2.0 Brightness Temperature ESDR, Version 1 (NSIDC-0630) data sets are described in Table 1.
Table 1. Differences between NSIDC-0032 and NSIDC-0630 V1
| NSIDC-0032 | NSIDC-0630 V1 | |
|---|---|---|
| File Format | Binary | NetCDF-CF |
| Input Source | RSS SSMI/SSMIS data | CSU SSMI(S) Brightness Temperature data |
| Projections | Northern Hemisphere Southern Hemisphere Global | Northern Hemisphere Southern Hemisphere Temperate |
| Grid | EASE-Grid | EASE-Grid 2.0 |
| Resolutions | 25 km 12.5 km | 25 km 12.5 km 6.25 km 3.125 km |
| Gridding Method | Backus-Gilbert (prior to DMSP-F17) Inverse Distance Squared method (after DMSP-F17) | "Drop-in-the-Bucket" gridding algorithm (25 km grids only) Radiometer version of the Scatterometer Image Reconstruction (rSIR) algorithm (12.5, 6.25, and 3.125 resolutions) |
| Available Satellites | Uses inputs from one satellite at a time, except for short periods of sensor overlap:
| Uses all available satellites (see Table 2 for more details) |
| Daily Gridding Division | Ascending/descending | Northern & Southern Hemisphere grids: morning/evening by local time of day (LTOD) Temperate grids: ascending/descending |
| Diurnal Range in Each File | Ascending/descending UTC day | Temperate grids: ascending/descending UTC day Northern/Southern Hemisphere grids: satellite-dependent 12-hour blocks, centered on local time of day |
| Parameters Included in File | Brightness temperature (Tb) Time | Brightness temperature (Tb) Number of observations Standard deviation Incidence angle Time |
Table 2. Temporal coverage by sensor for NSIDC-0630
Sensor | Platform | Begin Coverage | End Coverage |
|---|---|---|---|
AMSR-E | AQUA | 01 June 2002 | 04 October 2011 |
SSM/I | F08 F10 F11 F13 F14 F15 | 07 September 1987 08 December 1990 03 December 1991 03 May 1995 07 May 1997 23 February 2000 | 31 December 1991 14 November 1997 16 May 2000 19 November 2009 23 August 2008 01 January 2020 |
SSMIS | F16 F17 F18 F19 | 01 November 2005 01 March 2008 08 March 2010 27 November 2014 | 01 January 2020 01 January 2020 01 January 2020 09 February 2016 |
SMMR | Nimbus | 25 October 1978 | 20 August 1987 |
Other important differences
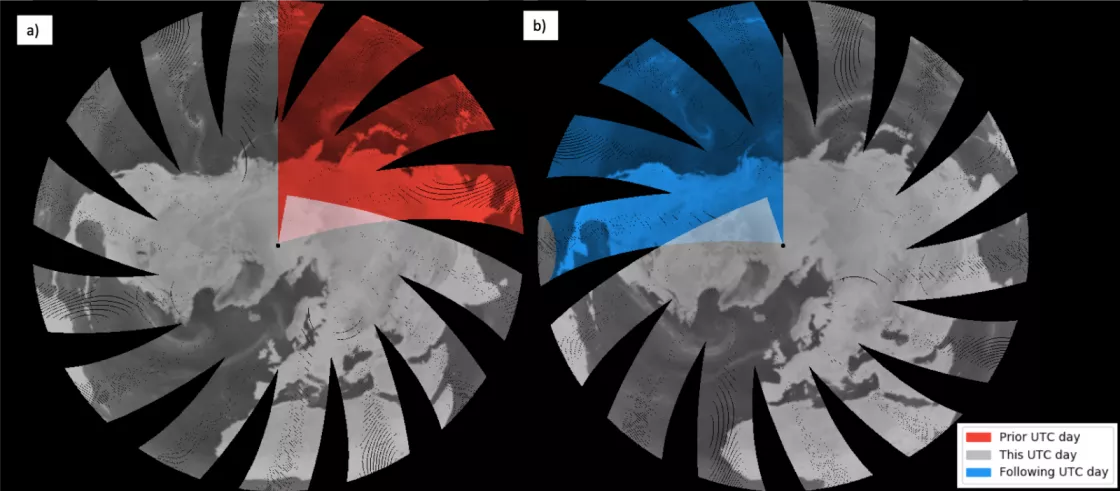
One of the biggest differences between NSIDC-0032 and NSIDC-0630 is how they divide input data.
- NSIDC-0032 divides input data into ascending/descending swaths.
- NSIDC-0630 divides input data into morning/evening files based on the local time of day of measurements.
This means that some input swaths with a UTC time from the previous day may be incorporated into morning files, and some input files with a UTC time from the following day may be incorporated into evening files. The image below demonstrates how this swath division affects an average day in a Northern Hemisphere 25 km grid. A more complete description of how NSIDC-0630 divides input swaths is captured in the NSIDC-0630 user guide.
In addition to dividing input files different, NSIDC-0032 and NSIDC-0630 also interpret input file quality flags differently. Compared to NSIDC-0032, NSIDC-0630 requires a higher quality threshold in order to calculate Tb values from input data. This threshold particular impacts the DMPS-F17 37V channel; after April 2016, Tb from this instrument and channel may have all 0 K or NaN values.
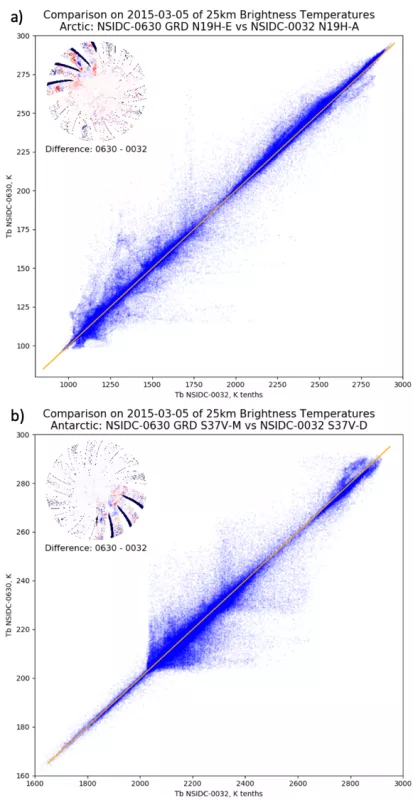
Lastly, the figure below demonstrates how different input files and production processes create unique brightness temperature profiles in NSIDC-0032 and NSIDC-0630. As the small figures in the upper left-hand corners of plot a and b show, the data sets correlate best where they draw from the same UTC day and deviate more dramatically where NSIDC-0630 uses input data from a different UTC day.

