How to use OpenAltimetry for ICESat/GLAS data products
OpenAltimetry (OA) is a freely accessible map-based data visualization and discovery tool for exploring satellite laser altimeter data. With OA, you can see how surface heights change across the Earth over time. Using OA, you can easily visualize data, and download the data in various formats directly from the website. You do not need any special software to access OA data; all you need is a web browser.
Data available through OA
Note: This information is time-sensitive and subject to change.
OA offers access to GLAH06 Global Elevation Data from the Ice, Cloud, and land Elevation / Geoscience Laser Altimeter System (ICESat) mission. ICESat is the predecessor to ICESat-2. ICESat collected data from 2003 through early 2010. This guide will focus on how to work with ICESat data.
OA also offers access to seven altimetry data products from the NASA Ice, Cloud, and land Elevation Satellite-2 (ICESat-2) mission. These products cover distinct types of elevation profiles from late 2018 to present:
- ATL03: Global Geolocated Photon Data
- ATL06: Land Ice Height
- ATL07: Sea Ice Height
- ATL08: Land and Vegetation Height
- ATL10: Sea Ice Freeboard
- ATL12: Ocean Surface Height
- ATL13: Inland Water Surface Data
To learn how to work with ICESat-2 data in OA, read this help article.
Differences between ICESat and ICESat-2 data visualizations
Although the OA interfaces for ICESat and ICESat-2 data are generally similar, they have significant differences.
Data offerings:
- ICESat data include one data set, GLAH06 Global Elevation Data with observations from 2003 to 2010.
- ICESat-2 data include seven data sets with observations spanning 2018 to present.
Instrument capabilities:
- ICESat used one beam.
- ICESat-2 uses six beams.
Temporal displays:
- ICESat data show multiple dates.
- ICESat-2 data show one day at a time.
Tool options:
- When the map interface loads for ICESat, the vertical toolbar on the left side of the screen allows you to zoom in and out of the map and reset your selection.
- When the map interface loads for ICESat-2, the vertical toolbar on the left side of the screen offers additional tools, such as the option to load MODIS cloud cover imagery for the selected date.
ICESat data source
The ICESat data visualized in OA come from the Geoscience Laser Altimeter System (GLAS) instrument that flew on NASA's Ice, Cloud, and land Elevation Satellite (ICESat) from 2003 to early 2010. ICESat was the first in a series of planned missions to measure changes in ice sheet elevation, and heights of clouds and aerosols. Subsequent missions examining elevations of glaciers and ice sheets include Operation IceBridge and ICESat-2.
By combining surface lidar with cloud and aerosol lidar, the GLAS instrument precisely measured surface heights of ice masses, and heights within Earth’s atmosphere. The data from ICESat come from one photon beam and the data points displayed on the map represent different dates of orbits.
The underlying data products are also freely accessible from the NASA National Snow and Ice Data Center Distributed Active Archive Center (NSIDC DAAC) in the ICESat collection.
Overview of OA tools for ICESat data
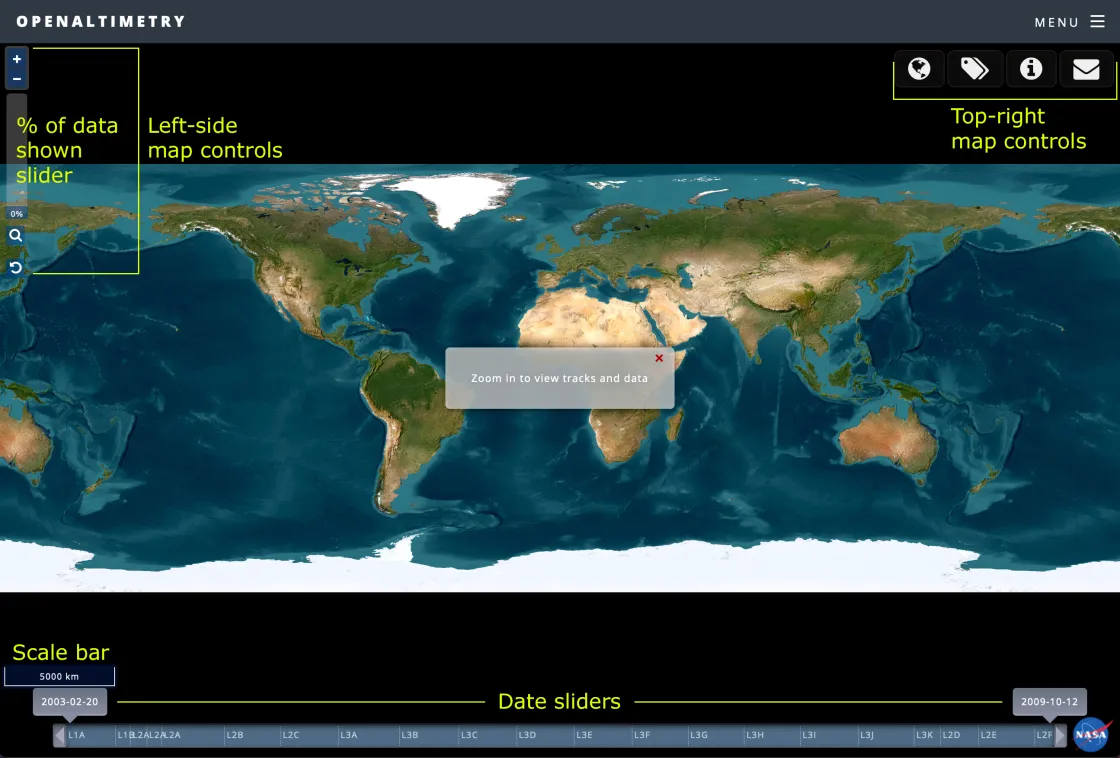
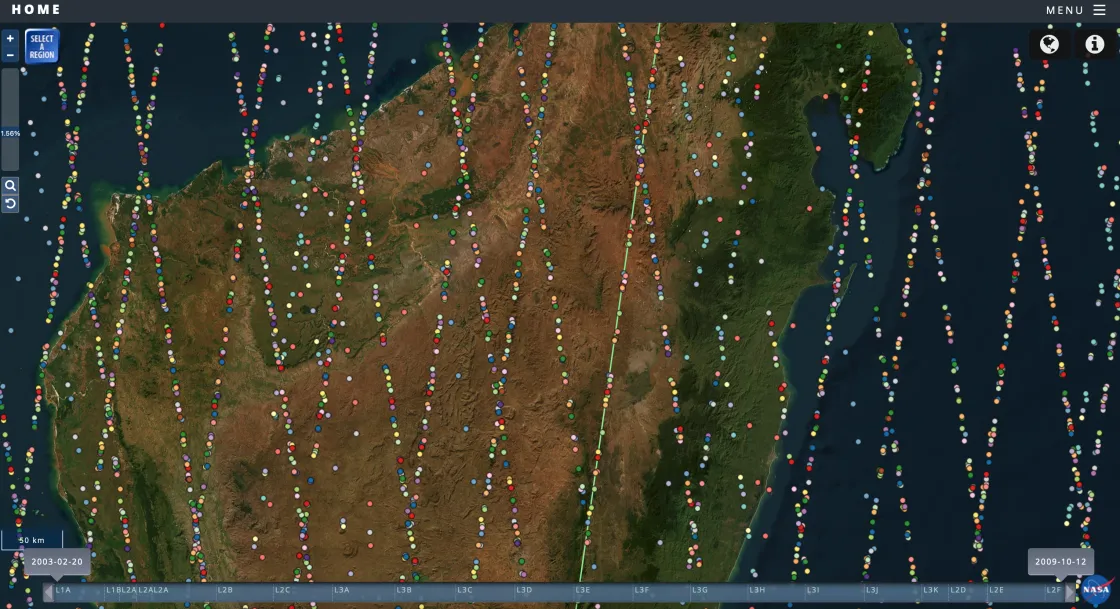
The OA opening screen for ICESat data looks something like this:
A vertical toolbar appears on the left side of the screen, and a horizontal toolbar appears in the upper right corner of the screen. Hovering over any of the icons displays a description of the tool name.
The left-side map tools include buttons to zoom in or out and reset the default map display.
From left to right, the top-right map tools include:
- A globe icon that allows you to choose the map projection: Geographic (global), Arctic, and Antarctic
- A tags icon that allows you to annotate the map (This requires you to be logged in to your Earthdata account.)
- An i(nformation) icon that allows you to select from a variety of map base layers and/or contact the OA team with questions or comments
An interactive data slider bar on the bottom of the screen shows the full date range for ICESat data. To adjust the date range, click on the date rectangle located at each end of the bar and drag it across the slider.
The Select a Region button allows you to select multiple data-observation points at a time. From the resulting popup window, you can download data as a comma-separated values (CSV) file.
Accessing ICESat data recommended steps
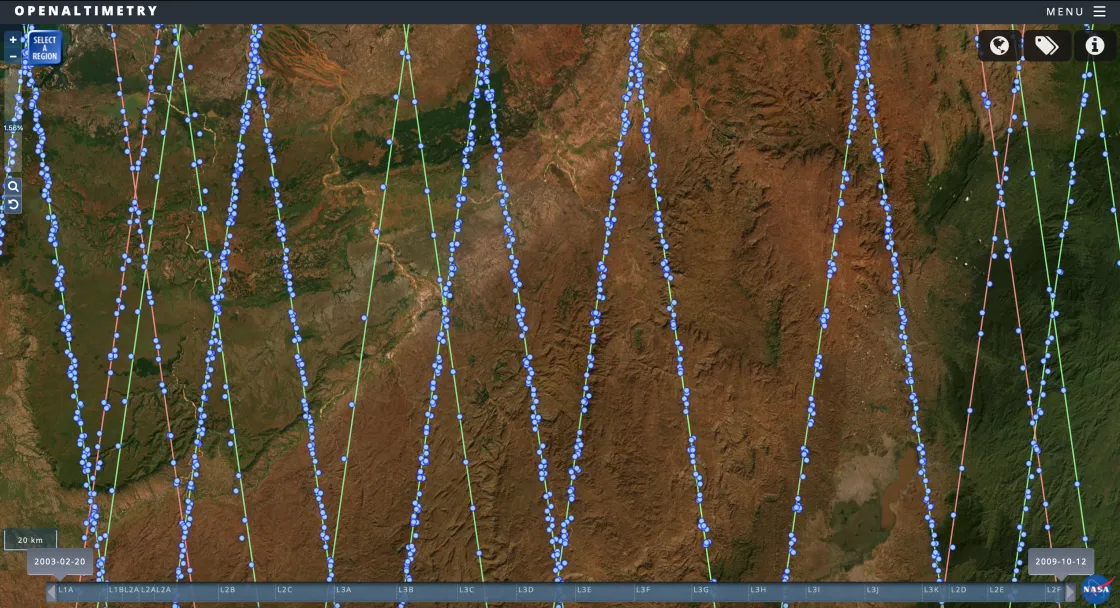
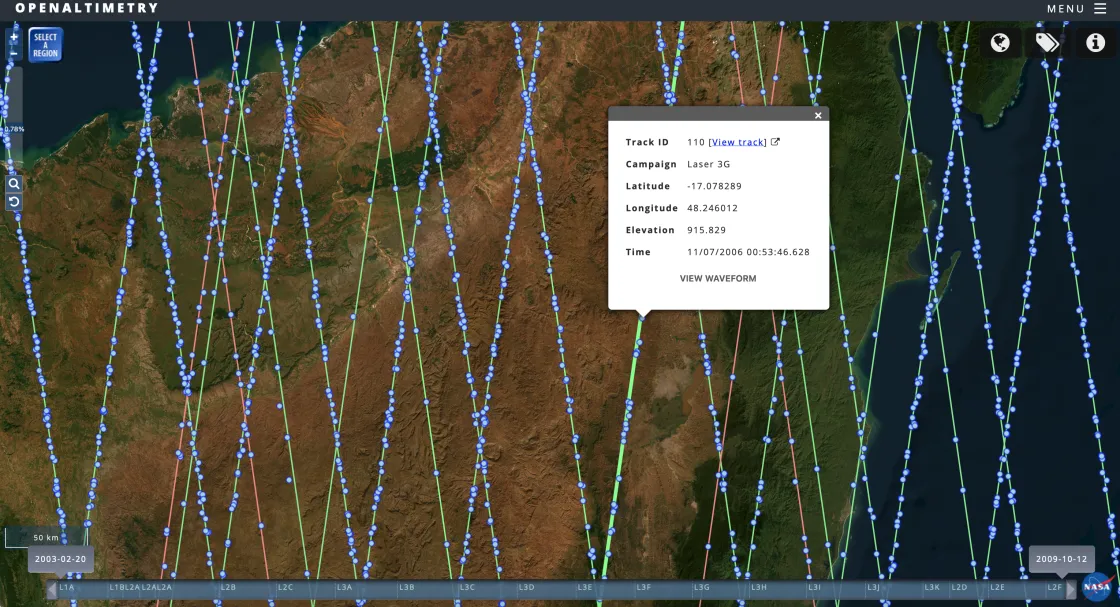
The map for ICESat data will first load with just the Earth displayed and no altimetry data showing. To load data, you must first zoom in on the map until the satellite tracks (peach and green lines) and data-acquisition points (blue dots) appear.
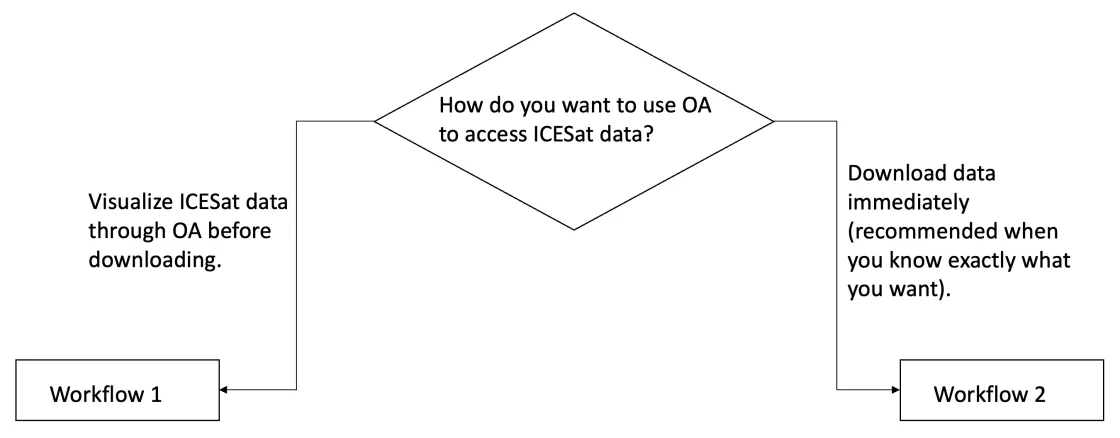
OpenAltimetry offers multiple pathways to visualizing and downloading data. This how-to guide offers a selection of options, based on common choices a user might make.
Workflow 1: Visualization through OA
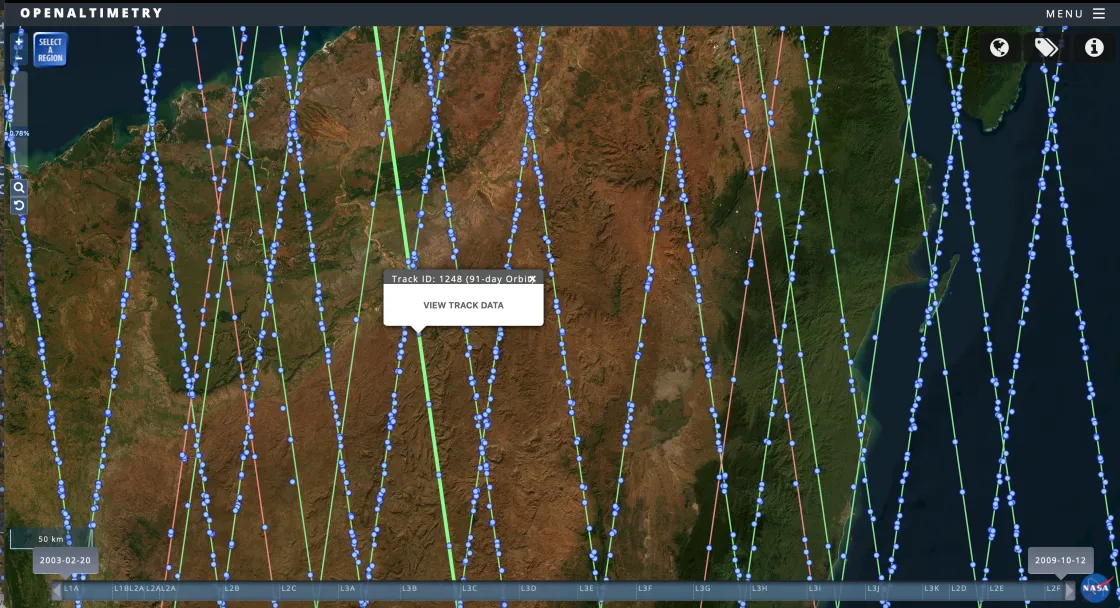
1. View track data. Click on a track to open a popup window offering access to track data.
Note: Within this workflow, you have the option of viewing the waveform for the selected region before downloading data, or instead of downloading data. Click on a data-acquisition dot, avoiding the track line, to open a popup window offering access to both track data and the waveform.
2. Click the View Track Data link in the popup window. This will open a new window with color-coded data-acquisition dots. Note: You can access a color key for these dots by clicking the i(nformation) icon in the upper right corner of the screen.
3. Click the Select a Region button.
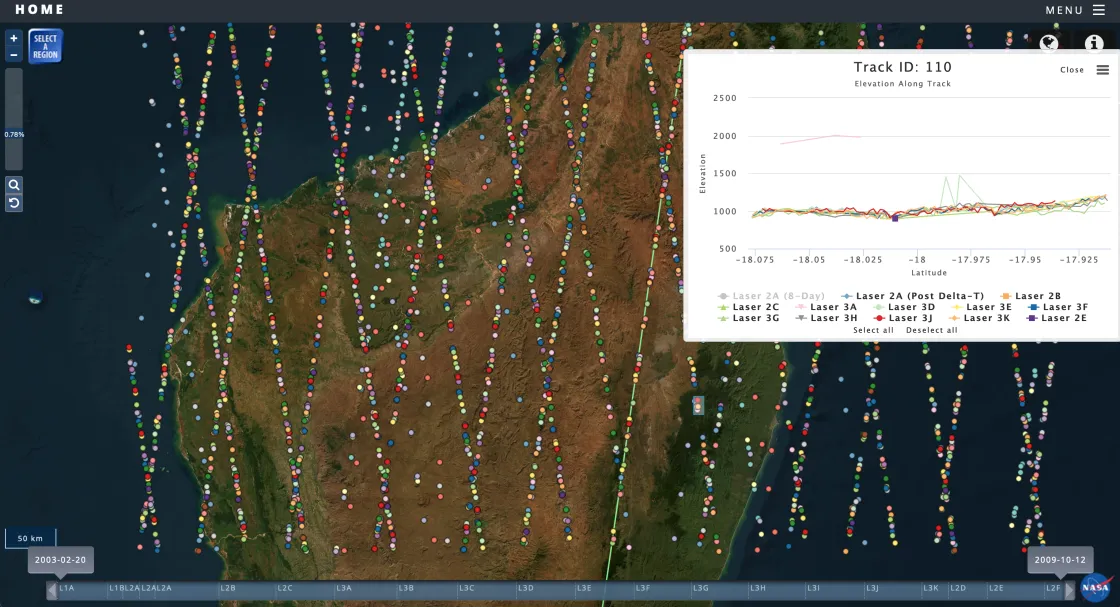
4. Click and drag over the desired area. This opens a popup window with a graphical display of data for along-track elevations.
Workflow 2: Quicker data download
1. In the OpenAltimetry window, zoomed in enough to see satellite tracks and data-acquisition points, click the Select a Region button.
2. Click and drag over the desired region. This opens a popup window with the download option.
3. Choose the CSV data format.
Note: Within this workflow, you have the option of viewing the waveform for the selected region before, or in place of, downloading data. After selecting a region, click a data-acquisition point to open a popup window.
Tips for working with ICESat elevation profiles
- Viewing a Waveform (accessible via the hamburger menu) is only available for a single campaign with no more than 20 data-acquisition points at a time.
- Moving the cursor over the graph opens popup windows with detailed statistics such as the specific latitude and longitude, beam, and observed height.
- Along the bottom of any graph, you can toggle on or off the display of specific beams. You can also select or deselect all. OpenAltimetry’s default setting is to select and display all.
- Clicking and dragging over a portion of the graph zooms in to those observations, and you can reset the zoom after doing so.
- The three-line hamburger menu in the upper right of each graph offers multiple options for printing or downloading the graph, or for viewing or downloading the underlying data.
NASA Earthdata account user capabilities
You can use the OpenAltimetry interface without logging in to the NASA Earthdata system, but logging in makes additional features available, including access to full data sets and annotations. You can add private annotations for your own use and/or search publicly available annotations. Adding public annotations requires privileges granted by the OpenAltimetry team.
To log in: From the menu in the upper right, choose My OpenAltimetry. From the resulting screen, you can log in with your Earthdata login credentials. NASA Earthdata accounts are free and provide many benefits to NASA data users, learn more about how to register for an account.
Additional resources and tutorials
- How to cite OpenAltimetry
- Known issues & updates
- NASA ICESat-2 technical specifications
- OpenAltimetry Tutorial (from 2019; some features have changed)
- Open Altimetry: Advanced Discovery, Processing & Visualization Services for ICESat & ICESat-2 Data (from 2021)
About OpenAltimetry
The creation of OpenAltimetry was a collaboration between the National Snow and Ice Data Center (NSIDC), University NAVSTAR Consortium (UNAVCO), the Scripps Institution of Oceanography, and the San Diego Supercomputer Center at the University of California San Diego. Starting in 2023, OpenAltimetry became a NASA application maintained and supported by the NASA National Snow and Ice Data Center Distributed Active Archive Center (NSIDC DAAC).
