Browse Image Subset Tool (BIST)
How to Use BIST
The Browse Image Spreadsheet Tool (BIST) allows you to look at an array of browse images, and to manipulate the parameters controlling each axis of the array with a spreadsheet-like interface. This allows you to control the particular data set on display in each column and row of the image spreadsheet. To get started:
- Choose a data set to work with from the dropdown menu at the top of the BIST tool. Then click Go.
- Use the Control Panel to format all the images on the page. Certain options can be hidden by toggling the Hide/Show Panel checkbox and then clicking Refresh.
- The column header options control images in the entire column. Likewise, the row header options control the images in the rows. Click Refresh to see your changes.
The BIST viewer does some additional formatting to the images in the FTP archive. When viewing images using BIST, choose Legend to toggle the color bar legend or annotations off or on. You can also choose the Scale of the image size. Right click directly on one of the spreadsheet images to see (and download) the version stored on our FTP server.
The examples below will give you an idea what you can do with the BIST.
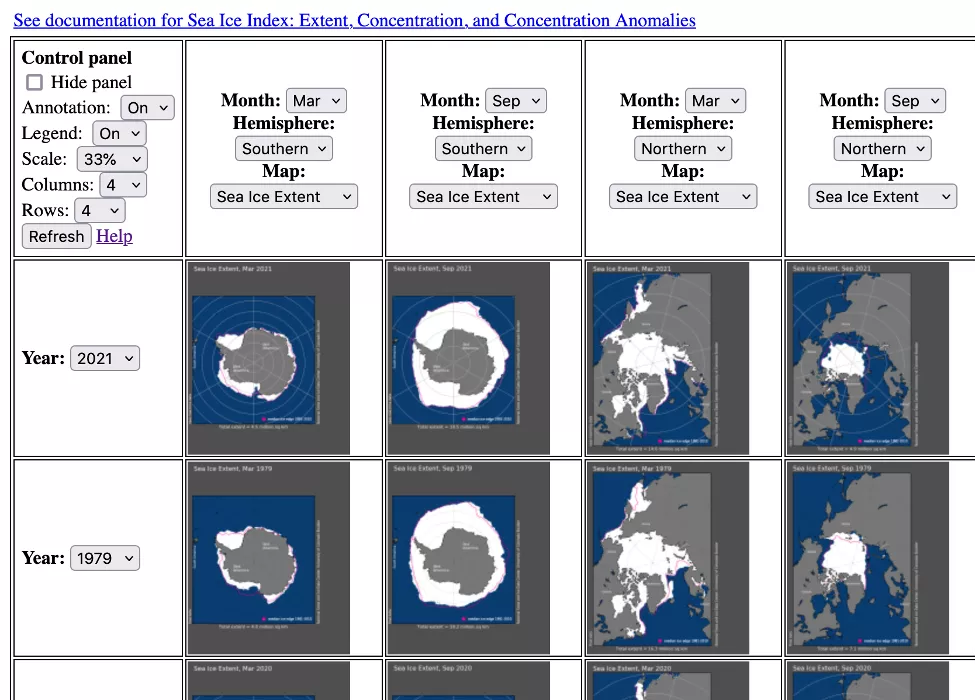
Comparison of sea ice extent maps across time
The BIST is handy for displaying Sea Ice Index maps, like those below. Up to 12 columns of months can be displayed with as many rows as there are years in the data set.
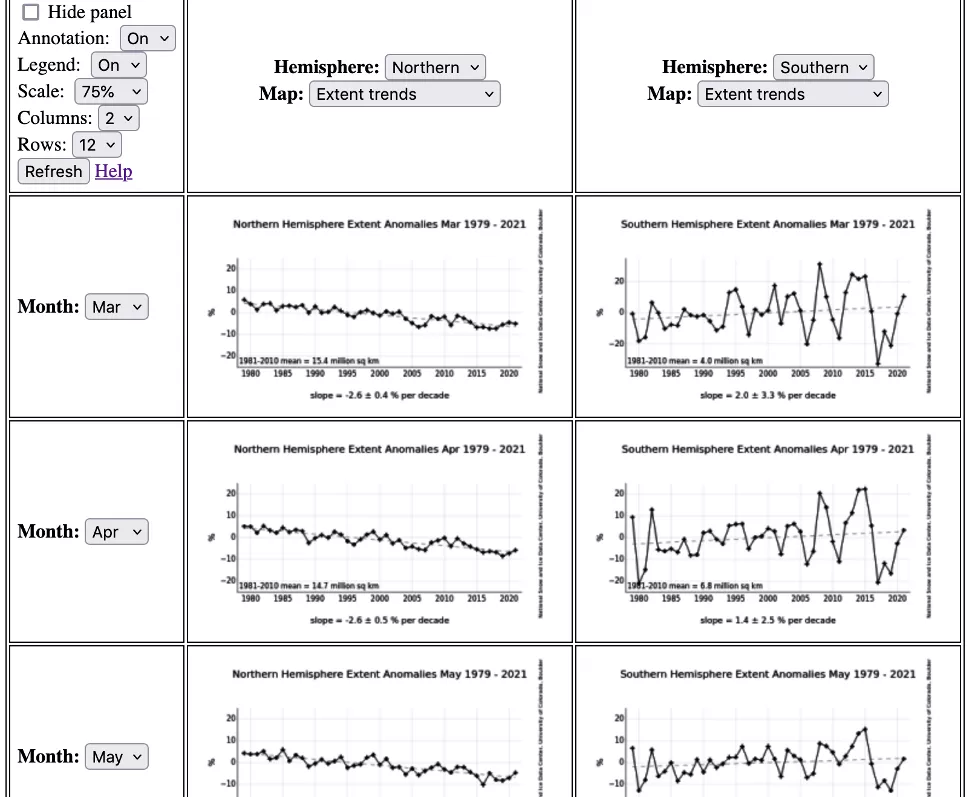
Monthly trends in sea ice extent
The BIST can display Sea Ice Index trends in ice extent as line plots, and trends in ice concentration as map images. This allows one to see the difference between northern and southern hemisphere sea ice extent variability and trends.
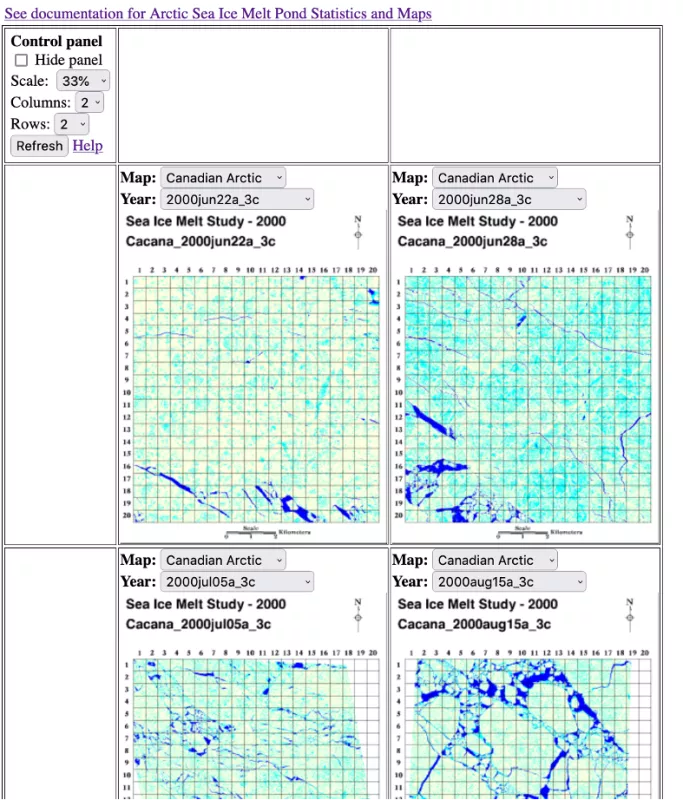
Melt pond data north of Canada
The browse images below show the evolution of melt ponds over the summer months at a site north of Canada, in high resolution visible band imagery from the Arctic Sea Ice Melt Pond Statistics and Maps data set. Cyan is pond, darker blue is open water, and white is ice.
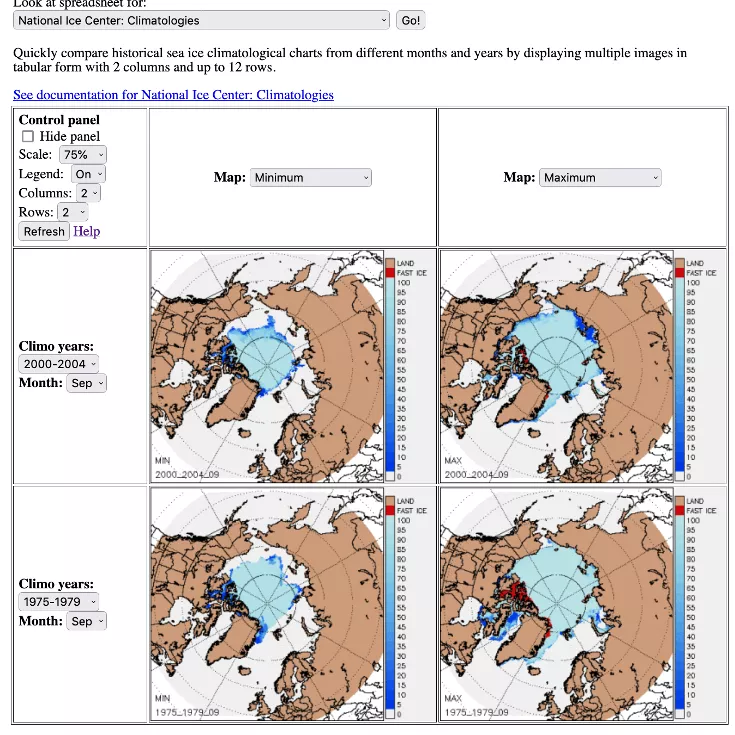
Historical ice extents from hand-drawn ice charts
Below, the BIST is used to see the first and last 5-year average minimum and maximum ice extent in the U.S. National Ice Center Arctic Sea Ice Charts and Climatologies in Gridded Format, 1972 – 2007 data set. We hope to enable the updated version of this data set, U.S. National Ice Center Arctic and Antarctic Sea Ice Concentration and Climatologies in Gridded Format, to work with the BIST as well.


