May 2023 snow summary
- Snow-covered area for the western United States was 106 percent of average in May with above average snow cover at the beginning of the month, but the month ended with below average snow cover.
- After reaching a record in April, snow cover days continued to rise.
- Snow albedo averaged across the western United States was at or below average with lower values in the north.
- By the end of May, the snowpack melted out at over half of the stations that measure snow water equivalent (SWE).
- At stations with remaining SWE, values were well above average toward the southwest and below average toward the northeast.
- The substantial loss of snow cover and SWE in May was primarily explained by above-average snowmelt rates, in addition to a lack of late season precipitation in the majority of large river basins.
Overview of conditions
Table 1. May 2023 Snow Cover in the Western United States, Relative to the 23-year Satellite Record
| Snow-Covered Area | Square Kilometers | Square Miles | Rank |
|---|---|---|---|
| May 2023 | 168,000 | 65,000 | 8 |
| 2001 to 2022, Average | 159,000 | 61,000 | -- |
| 2011, Highest | 287,000 | 111,000 | 1 |
| 2015, Lowest | 100,000 | 39,000 | 23 |
| 2022, Last Year | 173,000 | 67,000 | 7 |
Despite a record-breaking snowpack this winter, in May 2023 snow-covered area for the western United States was only 106 precent of average, ranking eighth in the 23-year-satellite record (Table 1). May 2023 snow-covered area was 59 percent of 2011, the year with the most snow cover and 168 percent of the lowest year, 2015. Snow-covered area in May 2023 was 5,000 square kilometers (1,900 square miles) less than in 2022, which was the seventh largest snow year in the satellite record.
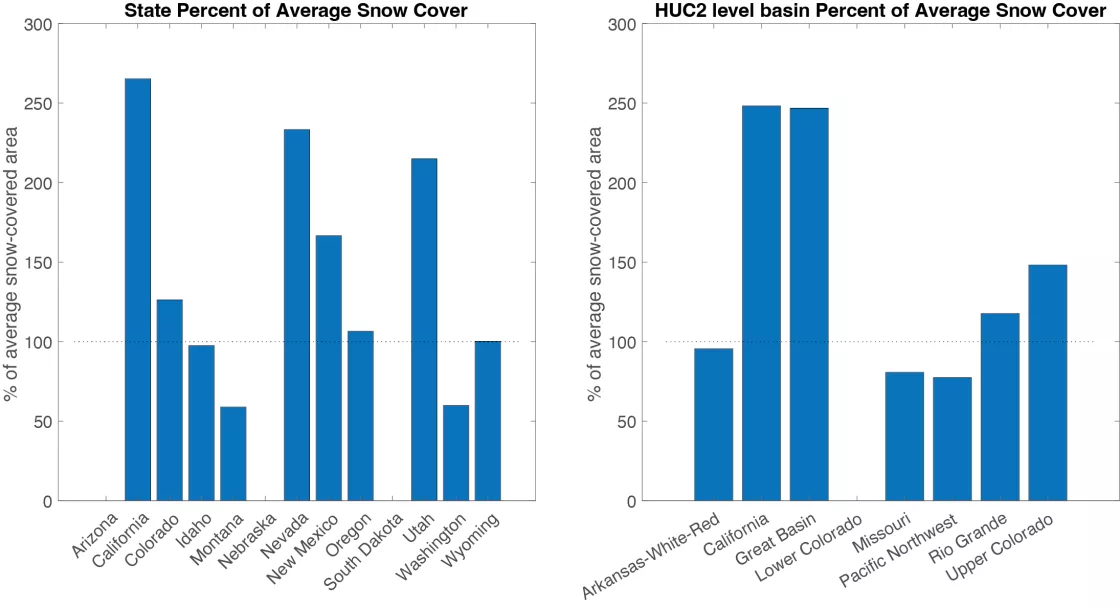
The May 2023 snow cover retreated to higher elevations in states and large river basins. In April 2023, snow-covered area was average to well above average in all states and basins, while the most recent data from May 2023 shows a mix of conditions (Figure 1). California, Nevada, and Utah continued to have well above average snow-covered area with 265 percent, 233 percent, and 215 percent of average respectively. These states benefited from numerous large storms earlier in the year that featured atmospheric rivers. Montana and Washington had below average snow-covered area despite above average conditions a month earlier. Similarly, Idaho, Oregon, and Wyoming had above average snow-covered area in April but fell to average conditions in May. Most northern basins including the Arkansas-White-Red, Missouri, and Pacific Northwest basins had below average snow-covered area while basins located in the central and southern regions had well above average snow-covered area.
Conditions in context: snow cover
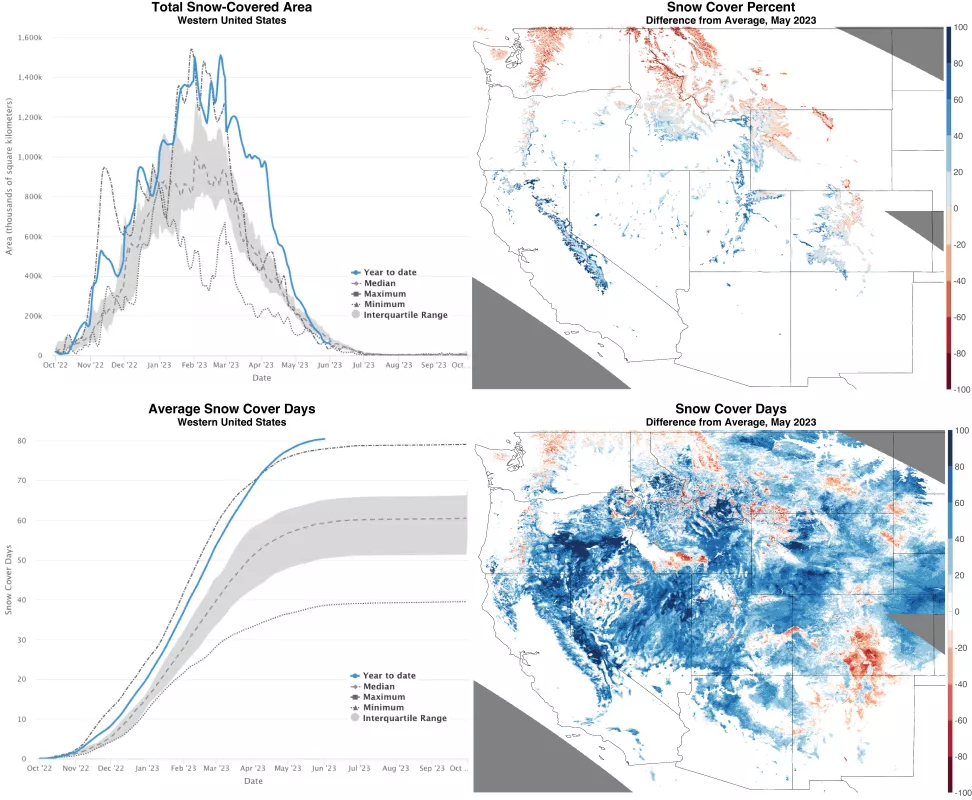
In early May, the snow-covered area was the highest in the 23-year-satellite record (Figure 2, upper left). However, a rapid decrease in snow-covered area from April continued through May with snow-covered area dropping to the seventy-fifth percentile by May 11, to the average by May 17, and below the twenty-fifth percentile by May 24. While snow-covered area decreased across the western United States in response to seasonal warming, decreases in snow-covered area were larger in northern states resulting in below average snow-covered area in Washington, northern Idaho, Montana, and Wyoming (Figure 2, upper right). Colorado's Front Range also had well below average snow cover for May. By contrast, regions impacted by atmospheric rivers that produced significant snowfall earlier in winter had above average snow-covered area including California's Sierra Nevada, Nevada's Basin and Range region, nearly all ranges in Utah, and Colorado's San Juan Mountains and its Park and Sawatch Ranges.
Snow cover days averaged over the western United States, from October 1 to May 31 increased only four days over May reaching 80.4 days (Figure 2, lower left). Snow cover days previously surpassed the 23-year record on April 7. Nearly the entire western United States had above average snow cover days (Figure 2, lower right). The largest extent of below average snow cover days was in southeast Colorado in the Sangre de Cristo Range, Wet Mountains, and Mosquito Range near Colorado Springs. By contrast, some of the highest snow cover days relative to average were the eastern Sierra Nevada of California and Nevada and Oregon's Blue Mountains and the Steens Mountain area.
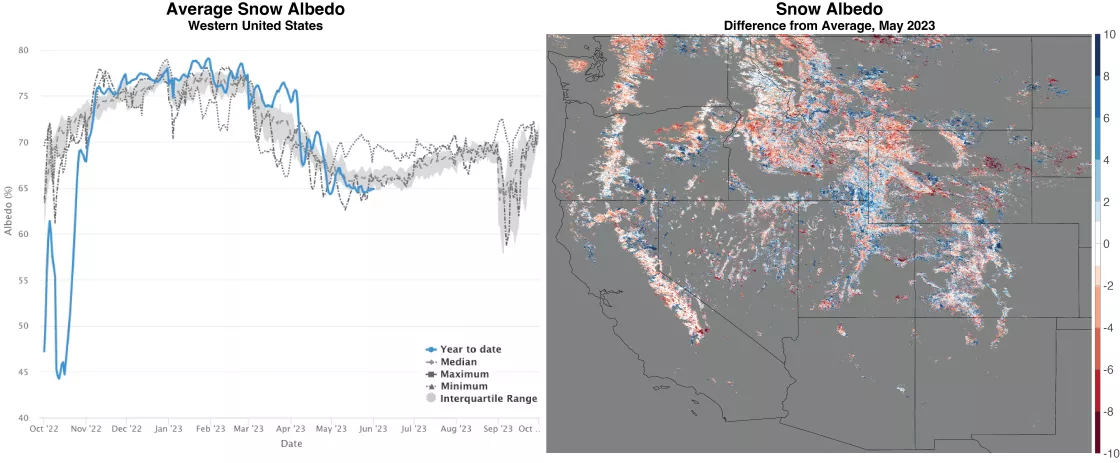
Snow brightness, known as snow albedo, averaged across the western United States started the month off at the twenty-fifth percentile but increased to average brightness in the first week of May from snowstorms in California and Nevada (Figure 3, left). Through the rest of May, snow albedo continued to decrease. May snow albedo shows regional and local highs and lows relative to average. However, most northern regions appear to have below average snow brightness. These regions had little precipitation (see "The great snow retreat", Figure 6) so snow was not refreshed. The old snow grains, which are dark relative to fresh snow, most likely combined with soot deposits from early season wildfires in Alberta, Canada, which had over 100 active fires in May. Local news in Montana, Idaho, Washington, and Colorado have been reporting on poor air quality conditions that can increase soot deposits and reduce snow albedo.
Conditions in context: snow water equivalent (SWE)
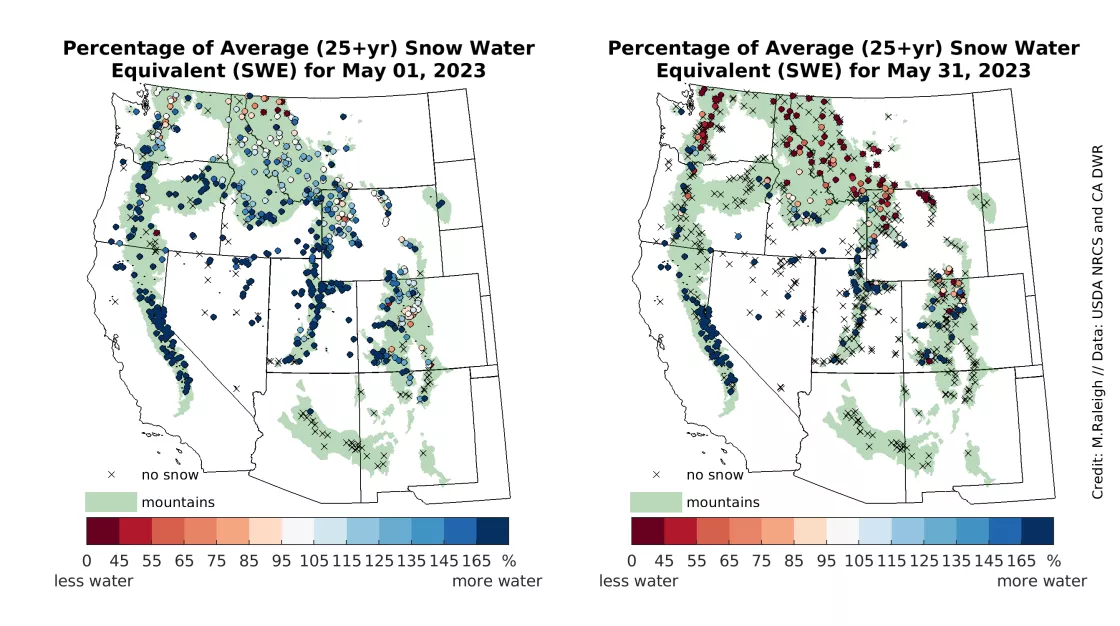
At the start of May 2023, snow water equivalent (SWE) was above average at most monitoring stations (Figure 4, left). Through the course of the month, snow melted out at 470 stations, leaving 359 stations still reporting some snowpack at the end of May (Figure 4, right). SWE at stations in Arizona, New Mexico, and South Dakota was zero by the end of May. Not surprisingly, end of May SWE was above average for stations in California, Nevada, and Utah, as well as parts of Colorado, Oregon, and central Idaho. By contrast, SWE was below average at many stations in Washington, northern Idaho, Montana, and Wyoming. This northeast-southwest contrast in SWE percent of average is consistent with the pattern of May snow cover percent (Figure 2, top right).
Note that in the spring and fall shoulder seasons, the SWE percentage of average metric can be difficult to interpret; hence, comparisons are qualitative in this narrative. For instance, several stations still had SWE values at the end of May 2023, but historically some of these locations have little or no SWE at this time of year. This makes the percentage of average calculation either unphysical (e.g., SWE percent of average in the thousands) or undefined (i.e., dividing by zero). These cases are plotted with the highest value in the SWE percent of average (dark blue in Figure 4).
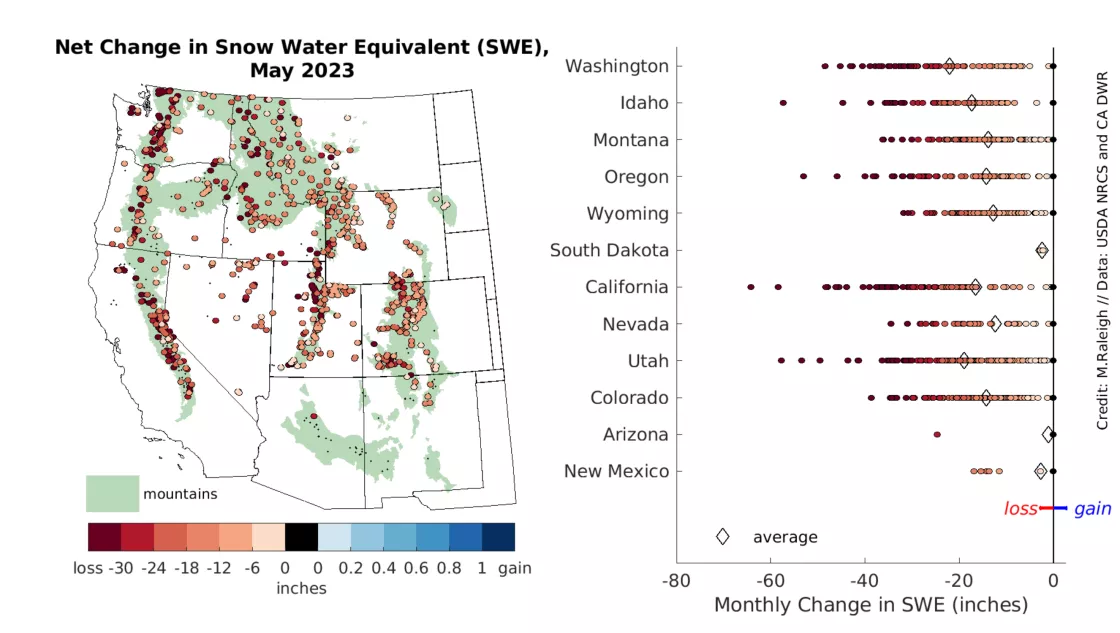
All stations with snow in May registered a net loss in SWE through the month (Figure 5), meaning that the monthly snowmelt exceeded any new snowfall. This is expected for this time of year with higher temperatures and more solar radiation. On an individual station basis, the greatest net SWE losses exceeded 125 centimeters (49 inches); these stations are in California, Utah, Idaho, and Oregon. On a state-average basis, Washington had the highest average loss in SWE at 55.9 centimeters (22 inches), followed by Utah at 48.3 centimeters (19 inches), and Idaho at 44.2 centimeters (17.4 inches). Arizona, New Mexico, and South Dakota had the lowest average loss in SWE because they had few stations with snow and the snow was relatively shallow, limiting the total amount of melt possible.
The great snow retreat
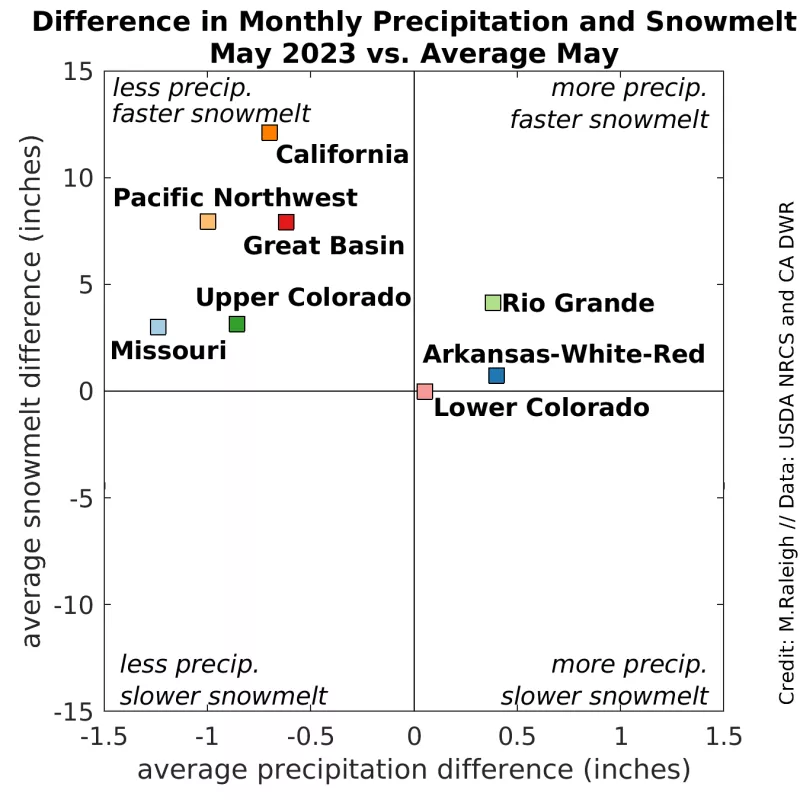
Major seasonal snow losses occurred through May across the western United States, both in terms of snow cover (Table 1 and Figure 2) and SWE (Figures 3 and 4). To what extent was this because of rapid snowmelt versus a lack of late season snowfall? To assess this question, total monthly precipitation and snowmelt was computed for May 2023 and compared to an average May using a gridded precipitation data set developed by Oregon State University and the full record at the SWE stations in each of the eight large river basins. Six of the eight river basins had above average monthly melt rates ranging from 7.7 centimeters (3 inches) in the Missouri Basin to 30.7 centimeters (12.1 inches) in the California Basin (Figure 6). The other two basins (Arkansas-White-Red and Lower Colorado) had near-average melt rates for May. Total May precipitation was below average in five of the eight basins and above average in the other three basins (all in the southern part of the domain). In all basins the difference in monthly precipitation from average was less than 3.1 centimeters (1.2 inches). This analysis suggests that rapid snowmelt was the main cause of the rapid retreat of seasonal snow. Drier conditions in May in five basins (California, Pacific Northwest, Great Basin, Upper Colorado, and Missouri), and hence a lack of new snowfall played a secondary role.
A farewell to the 2022 to 2023 snow season
A record-breaking snow year is coming to an end. It is anyone’s guess what next winter will bring. Our hope is that many will benefit from the downstream effects of the big winter that just came to pass in the West, helping fill reservoirs and rivers, and ensure a steady water supply through the summer. While the wildfire season has begun in some places in western North America, the remaining snowpack and higher soil water content may help keep wildfires at bay. Seasonal snow is important in so many ways, and our world is a better place when there is more of it around.
We also take this opportunity to look back and forward on the development of the Snow Today project. This year our team took a big stride to improve the experience of Snow Today for users with the roll-out of the more interactive daily snow data viewer. We have more exciting things planned for next year. Looking ahead to this summer and fall, our team will continue to improve the interactive web application. We will also work on refining regional analyses, adding automation for popular manually generated figures often used in our articles, and expanding coverage to new regions. The Snow Today pages will continue to update in the months ahead but may have downtime as features and datasets are upgraded. We plan to resume regular article posts once the 2023-2024 winter gets underway.
Finally, the founders of Snow Today, Karl Rittger of Institute of Arctic and Alpine Research (INSTAAR) and Mark Raleigh of Oregon State University acknowledge the team of people across INSTAAR, National Snow and Ice Data Center (NSIDC), and the Cooperative Institute for Research in Environmental Science (CIRES) at the University of Colorado Boulder, for their efforts in shaping, running, and improving the website. It takes a small village to keep the project going and articles flowing, and for that we thank our team.
