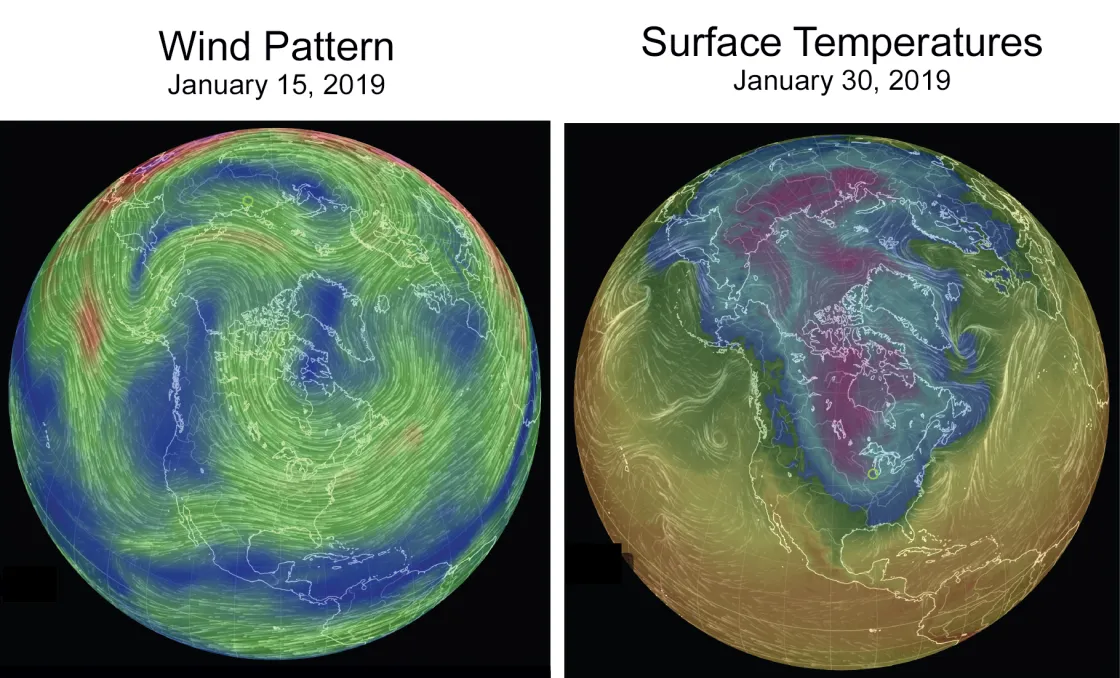
In January 2019, a pattern of high-altitude winds in the Arctic, better known as the polar vortex, weakened, sweeping frigid air over North America and Europe in the second half of the month. Arctic sea ice extent remained well below average, but temperatures in the far north were closer to average than in past years.
Overview of conditions
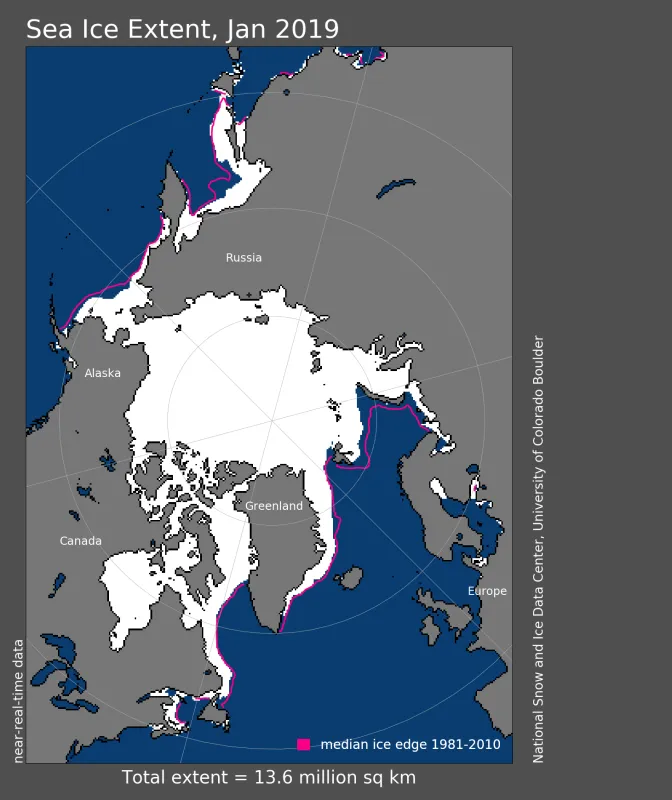
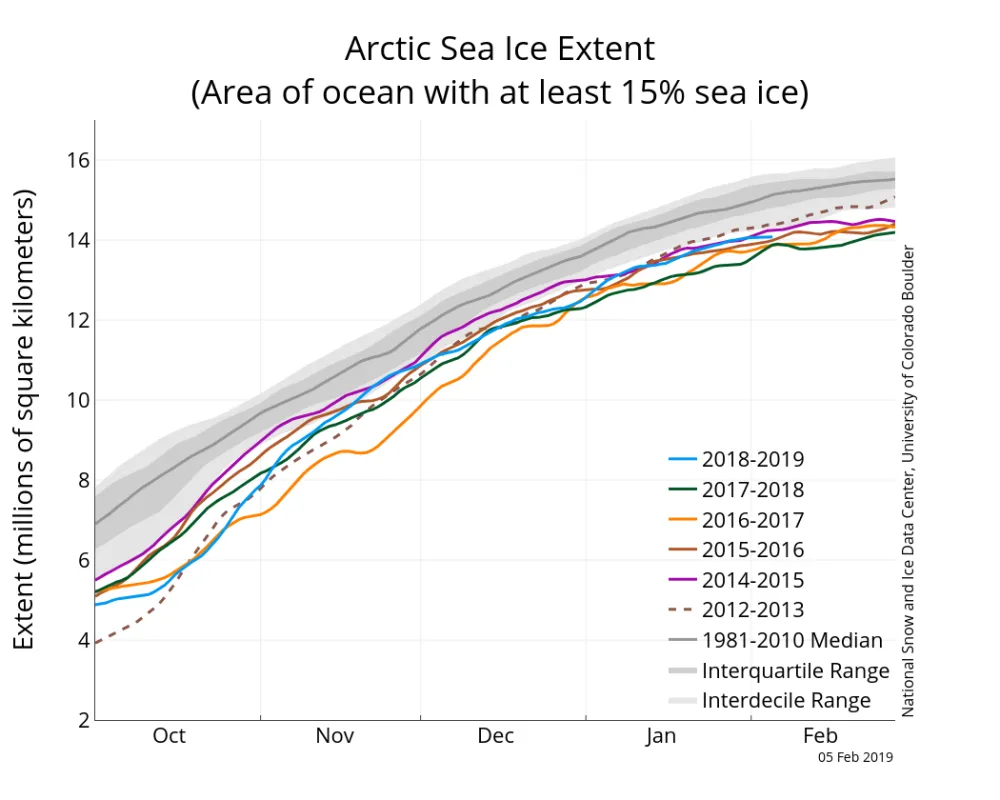
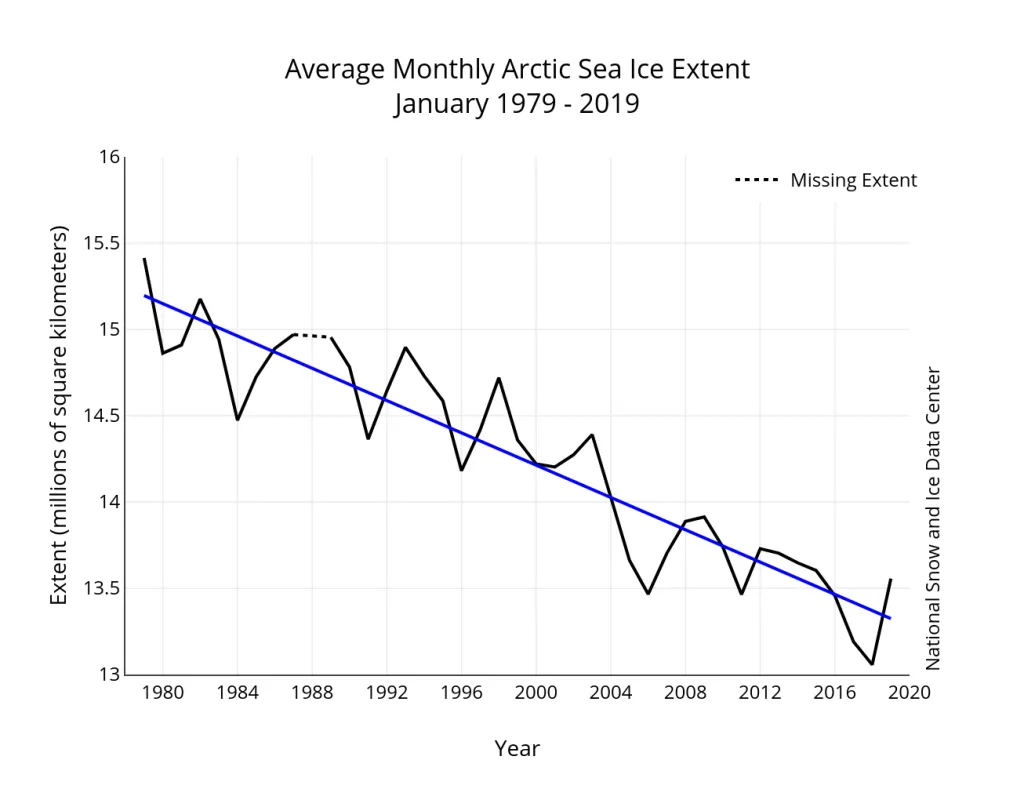
Arctic sea ice extent for January averaged 13.56 million square kilometers (5.24 million square miles). This was 860,000 square kilometers (332,000 square miles) below the 1981 to 2010 long-term average sea ice extent, and 500,000 square kilometers (193,000 square miles) above the record low for the month set in January 2018. January 2019 was the sixth lowest January extent in the 1979 to 2019 satellite record.
The average rate of daily ice growth of 51,200 square kilometers (19,800 square miles) was faster than the long-term average. Ice growth primarily occurred in the Bering Sea and Sea of Okhotsk in the Pacific sector as well as in the Labrador and Kara Seas. Some ice spread to the northeast of Svalbard, while retreating slightly to the northwest of these islands. Total ice extent was tracking at eighth lowest on January 31, with below average extent in nearly all sectors of the Arctic.
Conditions in context
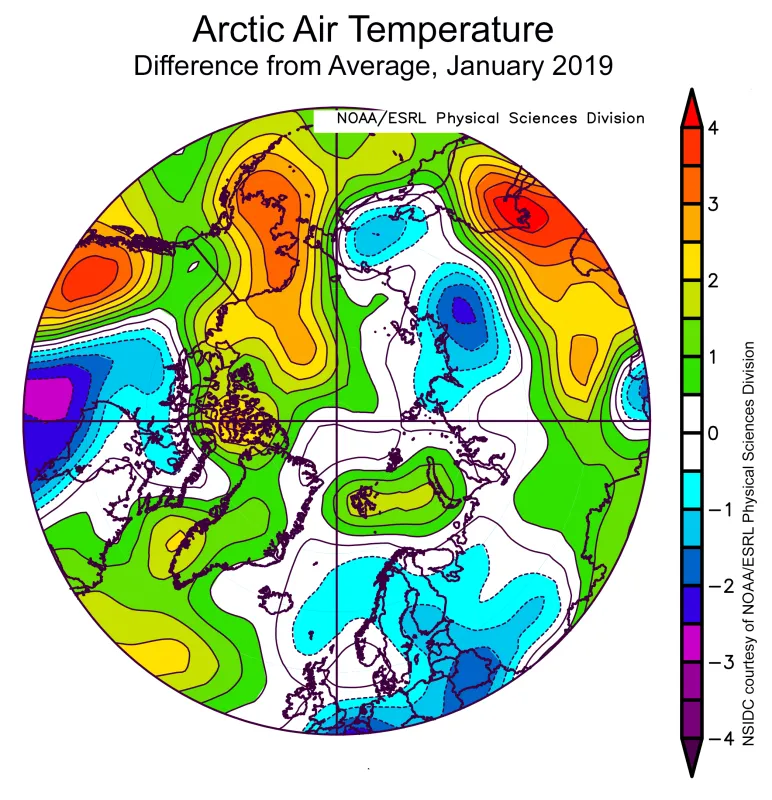
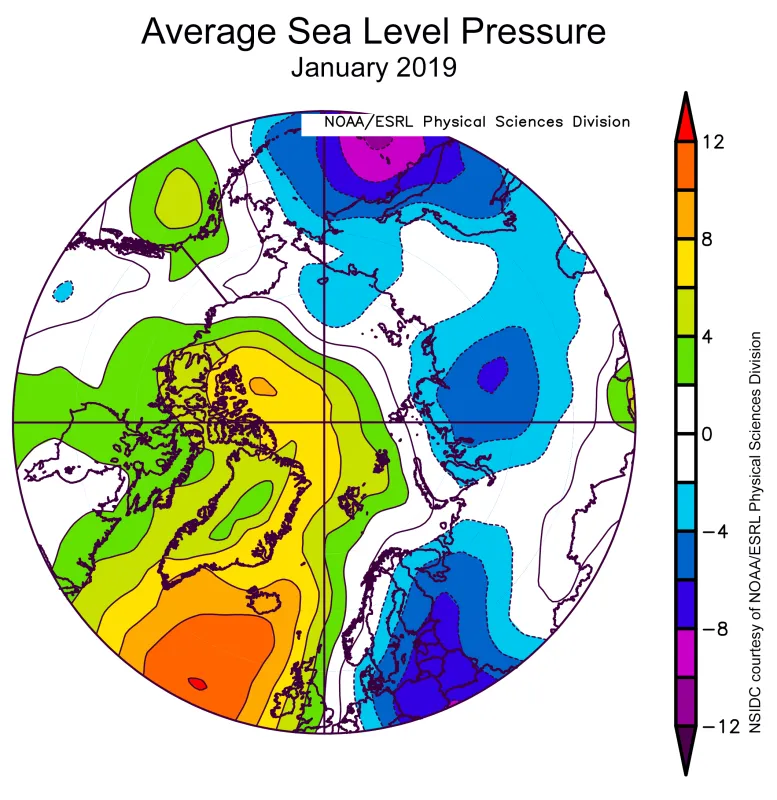
Arctic temperatures were only slightly above average, contrasting recent Januaries when very warm conditions prevailed. Daily 2 meter air temperatures for the Arctic averaged above 80 degrees North from the Danish Meteorological Institute were just a few degrees above the 1958 to 2002 average, whereas in 2018, temperatures ranged from 4 to 12 degrees Celsius (7 to 22 degrees Fahrenheit) above average. Looking at the 925 hPa level (approximately 2,500 feet above the surface; Figure 2b), temperatures of 1 to 2.5 degrees Celsius (2 to 4.5 degrees Fahrenheit) above the 1981 to 2010 average were the rule over the Beaufort Sea and Canadian Arctic Archipelago, and over the Bering Sea. However, part of the Atlantic side of the Arctic had temperatures near or slightly below average for the month. The atmospheric circulation pattern was unusual, with above average pressure at sea level over a broad area including northern Canada, Greenland, and the northern North Atlantic, and a broad area of below average pressure along the Russian and Siberian Arctic coast. Low pressure also prevailed over the northern Pacific and Bering Sea (Figure 2c).
January 2019 compared to previous years
Overall, sea ice extent during January 2019 increased by 1.59 million square kilometers (614,000 square miles). This was 270,000 square kilometers (104,000 square miles) above the 1981 to 2010 average rate for the month. The linear rate of sea ice decline for January was 46,700 square kilometers (18,000 square miles) per year, or 3.2 percent per decade relative to the 1981 to 2010 average.
Cold shoulder
When well developed, the upper atmosphere circumpolar wind pattern, or polar vortex, isolates cold Arctic air in the far north, strengthens the mid-latitude jet stream, and reduces the frequency of frigid air outbreaks into lower latitudes. Early in January 2019, the polar vortex split into several separate closed streams. There was an outbreak of bitter cold air crossing southern Canada, the US Midwest, and the East Coast, during the last week of January. Such events have been popularly termed “invasions of the polar vortex.”
Conditions in the upper US Midwest were colder than any previous winter period in the past two decades. Low temperatures in northern Minnesota and all of Wisconsin on January 30 and 31 were in the -27 to -35 degrees Celsius range (-17 to -31 degrees Fahrenheit). Large areas of Michigan, Ohio, Indiana, Iowa, and the Dakotas reached temperatures below -20 degrees Celsius (-4 degrees Fahrenheit). However, few all-time low temperature records were set during the cold snap. Very mild conditions followed the cold snap in early February.
Arctic change: Fast and furious…and urgent
In a recent review paper (Overland et al., 2019), colleagues from a spectrum of polar geophysics disciplines summarized the many facets of the Arctic’s ongoing transformation, noting that this region, perhaps foremost in the globe, requires a quick adjustment to the pace of climate change. The amplification of global climate change in the Arctic, and the emerging potential for long-term atmospheric and ocean circulation changes, permafrost greenhouse gas release, and the effects of changing snow cover and snowmelt timing, point to serious but hard-to-forecast impacts on global society and infrastructure by the second half of this century.
Antarctic notes
After a rapid December loss and record low extent in early January, Antarctic sea ice extent declined at a slower-than-average rate. On January 31, Antarctic sea ice extent dropped to third lowest on record, tying with 2006 and bested by 2017 and 2018. Sea ice extent was particularly low in the eastern Weddell Sea and the eastern Ross Sea. Over the satellite record, Antarctic January sea ice was increasing at 4,400 square kilometers (1,700 square miles) per year or 0.9 percent per decade, although this was not statistically significant at the 95 percent confidence level. The Antarctic minimum for the year is typically in late February. The Southern Annular Mode, similar to the polar vortex for the southern hemisphere, was in its positive phase, favoring westerly winds around the continent and cool conditions over its ice sheet. This was indeed the case for East Antarctica, where temperatures were 2 to 6 degrees Celsius (4 to 11 degrees Fahrenheit) below the 1981 to 2010 mean, but other parts of Antarctica and the surrounding sea ice areas were near average.
References
Danish Meteorological Institute Arctic temperatures
Overland, J., E. Dunlea, J. Box, R. Corell, M. Forsinus, V. Kattsov, M. S. Olsen, J. Pawlak, L-O Reirson, and M. Wang. 2019. The urgency of arctic change. Polar Science. doi:10.1016/j.polar.2018.11.008
