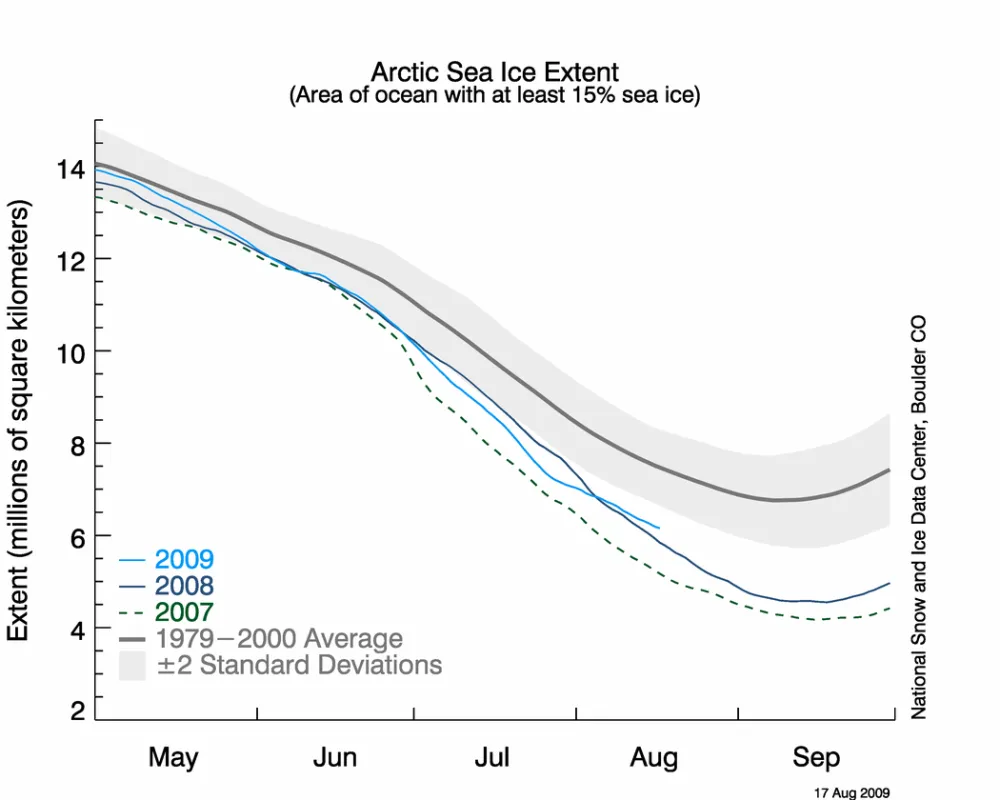
During the first half of August, Arctic ice extent declined more slowly than during the same period in 2007 and 2008. The slower decline is primarily due to a recent atmospheric circulation pattern, which transported ice toward the Siberian coast and discouraged export of ice out of the Arctic Ocean. It is now unlikely that 2009 will see a record low extent, but the minimum summer ice extent will still be much lower than the 1979 to 2000 average.
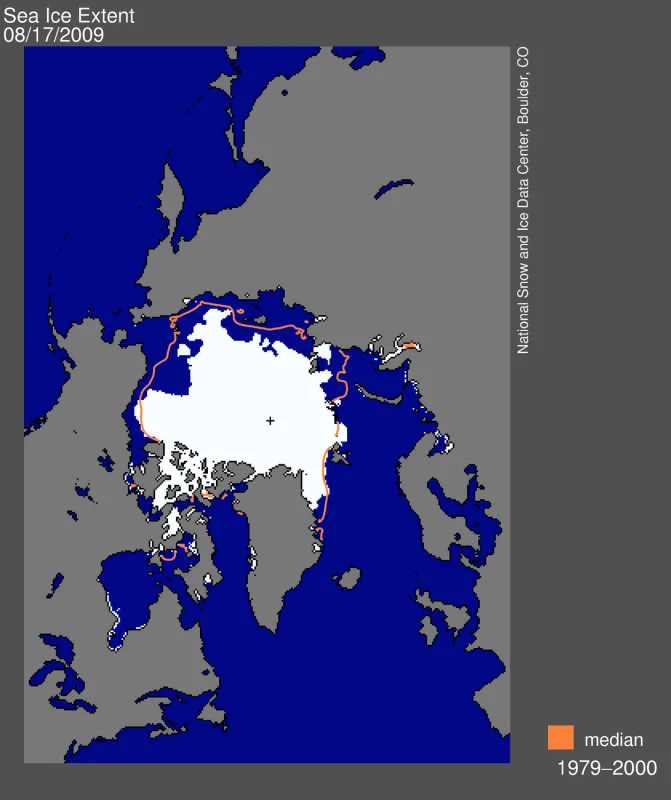
Note: This mid-monthly analysis update shows a single-day extent value for Figure 1, rather than the usual monthly average. While monthly average extent images are more accurate in understanding long-term changes, the daily images are helpful in monitoring sea ice conditions in near-real time.
Overview of conditions
On August 17, Arctic sea ice extent was 6.26 million square kilometers (2.42 million square miles). This is 960,000 square kilometers (370,000 square miles) more ice than for the same day in 2007, and 1.37 million square kilometers (530,000 square miles) below the 1979 to 2000 average. On August 8, the 2009 extent decreased below the 1979 to 2000 average minimum annual extent, with a month of melt still remaining.
Conditions in context
From August 1 to 17, Arctic sea ice extent declined at an average rate of 54,000 square kilometers (21,000 square miles) per day. This decline was slower than the same period in 2008, when it was 91,000 square kilometers (35,000 square miles) per day, and for the same period in 2007, when ice extent declined at a rate of 84,000 square kilometers (32,000 square miles) per day. The recent rate of ice loss has slowed considerably compared to most of July. Arctic sea ice extent is now greater than the same day in 2008.
Ice motion changes in August
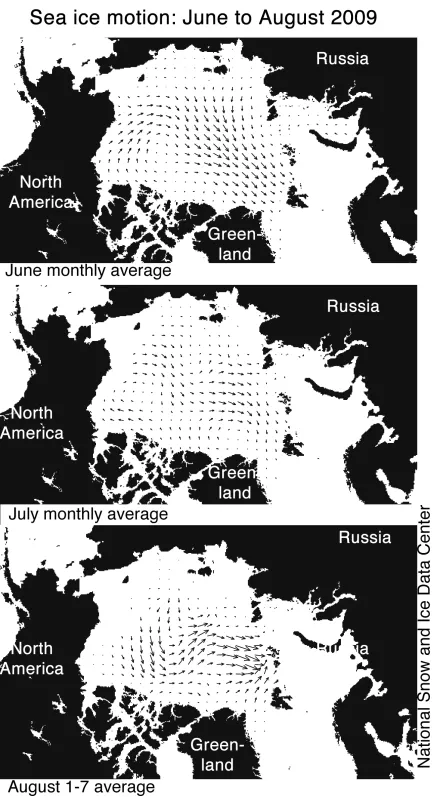
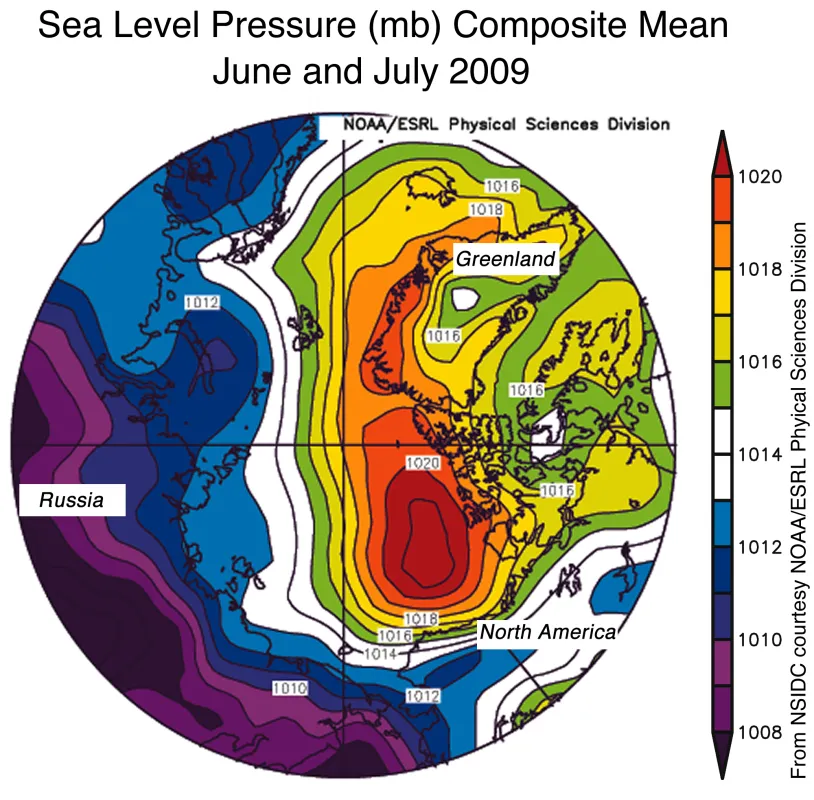
A recent atmospheric circulation pattern, which led to a change in ice motion, caused the ice loss rate to slow down significantly in the first two weeks of August. As discussed in the August 4 post, during much of June and July, a strong Beaufort Sea high-pressure pattern promoted winds that helped push ice out of the Siberian coastal seas, and also brought clear skies and warm temperatures that helped induce melt.
Toward the end of July, the atmospheric pattern changed. Averaged over the past two weeks, a high-pressure system has been centered over the Barents Sea, with low pressure centered over the Laptev Sea. In accordance with Buys Ballot’s Law, this pattern led to winds that redirected the motion of the ice cover, pushing the ice edge outward toward the Siberian coast and discouraging ice from exiting the Arctic Ocean through Fram Strait.
The Northwest Passage and Northern Sea Route
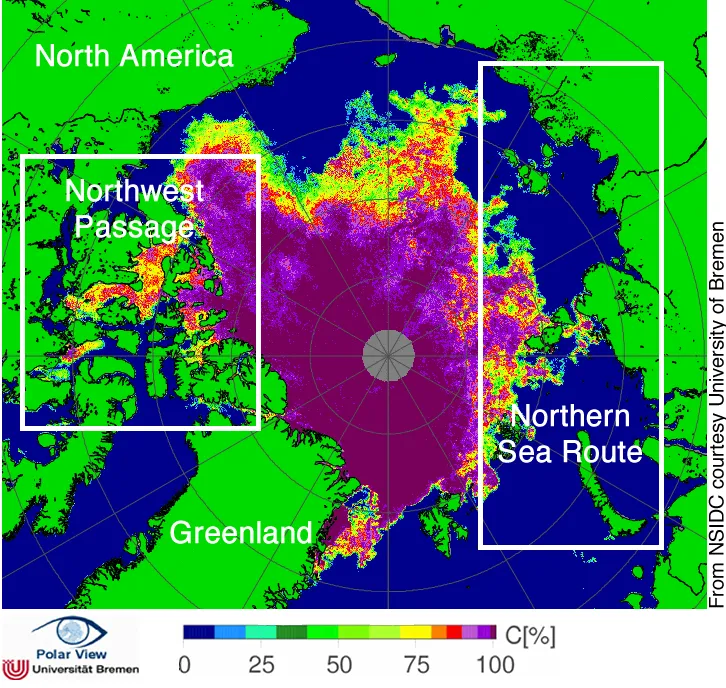
So far this year, neither the Northwest Passage nor the Northern Sea Route has opened. The Northern Sea Route appears likely to open soon, but ice still clogs many of the channels in the Northwest Passage.
Whether or not the navigational passages through the Arctic Ocean will open in a given summer depends on atmospheric circulation and ice thickness. For example, although 2007 was a record low extent in the Arctic and the Northwest Passage was nearly completely open, the Northern Sea Route was still choked with ice because of a circulation pattern that pushed a tongue of ice against the Siberian coast. Recent research by Stephen Howell at the University of Waterloo in Canada shows that whether the Northwest Passage clears depends less on how much melt occurs, and more on whether multi-year sea ice is pushed into the channels. Counterintuitively, as the ice cover thins, ice may flow more easily into the channels, preventing the Northwest Passage from regularly opening in coming decades.
Comment on atmospheric circulation patterns
James Overland of the NOAA Pacific Marine Environmental Laboratory in Seattle, Washington has taken a close look at patterns of atmospheric circulation in recent summers. Overland notes that the periods June through August 2007 and June and July 2009 both saw an unusual atmospheric pattern of sea level pressure, with higher pressure on the Alaskan side of the Arctic and lower pressure on the Eurasian side. This pressure difference brought warm air into the central Arctic and transported sea ice towards the Atlantic. Historically, such a pattern is a rare event—before 2007, it only occurred twice in 30 years. Normally there is little difference in pressure across the Arctic during summer, and winds are slack.
This rare condition may result from the convergence of the three main patterns of climate variability: the Arctic Oscillation (AO) climate pattern, which features either high or low pressure over most of the Arctic; the positive phase of the Pacific North American (PNA) pattern, which is characterized by low pressure over the Bering Sea and high pressure over the Canadian Rockies; and the Arctic dipole pattern, which features high pressure on one side of the Arctic and low pressure on the other. In 2007 and 2009 all three patterns have been in play. A clue to the cause of these unusual conditions comes from the wind flow in the middle atmosphere. Normally winds flow in a counter-clockwise direction around the central Arctic Ocean, a flow known as the polar vortex. In the summers of 2007 and 2009 the polar vortex shifted to mostly to the Eurasian side of the Arctic, allowing higher pressures to develop on the Alaskan side. Scientists are now studying whether this dipole pattern will become more common in the future and whether the loss of summer sea ice itself is helping to make this pattern more frequent.
ReferencesHowell, S. E. L., C. R. Duguay, and T. Markus. 2009. Sea ice conditions and melt season duration variability within the Canadian Arctic Archipelago: 1979–2008, Geophys. Res. Lett., 36, L10502, doi:10.1029/2009GL037681.
Overland, J. E., and M. Wang. 2005. The third Arctic climate pattern: 1930s and early 2000s. Geophys. Res. Lett., 32(23), L23808, doi:10.1029/2005GL024254.
Wang, M., N. A. Bond, and J. E. Overland. 2007. Comparison of atmospheric forcing in four sub-arctic seas. Deep-Sea Research II. 54, 2543-2559. doi:10.1016/j.dsr2.2007.08.014
