By Michon Scott
In late September 2024, late-monsoon rainfall caused widespread flooding and landslides across Nepal. The Landslide Blog, a publication of the American Geophysical Union, reported that more than 100 landslides struck the country, many of them clustered around Kathmandu. The worst landslide occurred west of the city, where a mudflow struck two buses on the Prithvi Highway. That single slurry of mud and rock killed 35 people, adding to the rain event's overall death toll of more than 200.
Deadly landslides in Nepal—and other parts of High Mountain Asia—are not new, but around the time that the rain-triggered landslides struck, a new study predicted an increase in this kind of hazard across the region. The study authors linked higher emissions of greenhouse gases to the potential for higher risks from landslides.
The study authors produced more than a research paper. Along with the study, they released a new data set, High Mountain Asia Daily 5km Landslide Hazard Indicator. This new data set is now available through the NASA NSIDC Distributed Active Archive Center (DAAC).
Changes in store for this high-elevation region
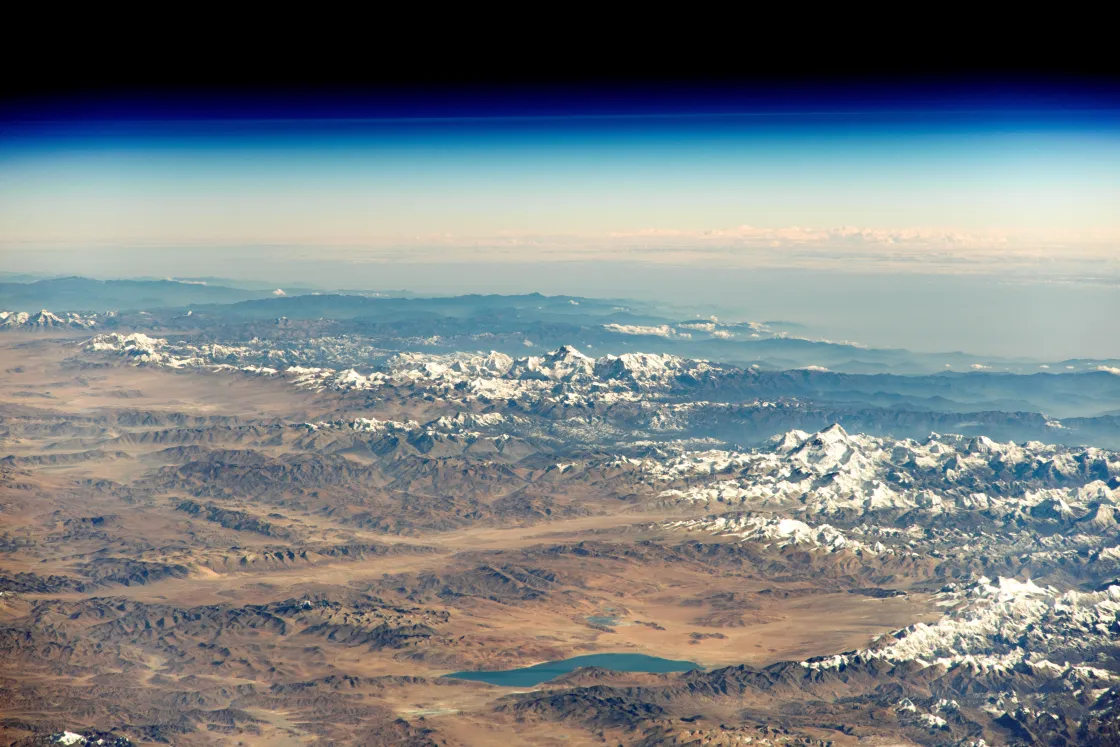
High Mountain Asia encompasses five mountain ranges spanning portions of 10 countries. These mountains rose some 50 million years ago when tectonic activity pushed the Indian subcontinent up against the Eurasian Plate. That geologic collision formed some of the world’s tallest mountains, including Mount Everest.
High Mountain Asia’s high elevation and frequently low temperatures mean much of the region’s precipitation falls as snow. In fact, this high-altitude region contains so much snow and ice, it is often referred to as Earth’s “third pole." Not all precipitation in High Mountain Asia falls as snow, though. Some precipitation falls as rain, which has a greater potential to erode rocks and trigger landslides, especially in heavy rainfall events.
As continued greenhouse gas emissions raise global temperatures, more of High Mountain Asia’s precipitation is expected to fall as rain, and extreme rainfall events are anticipated to grow more frequent. The 2024 study attempted to estimate how much extreme rainfall events will increase, and when they will arrive in the twenty-first century.
Combining observations, climate scenarios, and machine learning
High Mountain Asia stretches from the Tien Shan Mountains in the northwest to the Eastern Himalaya in the southeast, ranging widely in elevation, from as low as 200 meters (700 feet) above sea level to as high as Everest, Earth’s tallest mountain peak at 8,848 meters (29,032 feet). The landscapes are not uniform, and neither are the weather patterns.
To make predictions about rain on snow events and their connection to landslides in the remainder of the twenty-first century, researchers examined multiple factors. Their research encompassed historical records of precipitation and temperature since future rain-triggered events will likely act much like those from the past. In particular, the researchers looked for records of heavy downpours strong enough to trigger landslides. The research team also examined topographic and seismic data for High Mountain Asia. The team fed this wealth of data into a machine-learning model where the computer effectively taught itself how to understand the data as it received more records.
As important as they are, historical data form only part of the basis of future predictions. After all, historical weather patterns are a function of historical climate. Climate does not directly dictate weather events but instead establishes a range of probable weather events. As climate shifts, likely weather patterns change, but by how much?
The answer depends largely on human actions. So, climate scientists use scenarios to predict how future human activities might affect the climate. Among the tools they use are Shared Socioeconomic Pathways (SSPs), which group projections about emissions and mitigation efforts based on different societal choices. SSPs are widely used in climate research, including by the Intergovernmental Panel on Climate Change (IPCC). SSPs range from very low to very high emissions. The 2024 study used two SSPs: SSP2-4.5 (a middle-ground scenario where development continues along current trends) and SSP5-8.5 (A high-emissions scenario based on extensive fossil fuels).
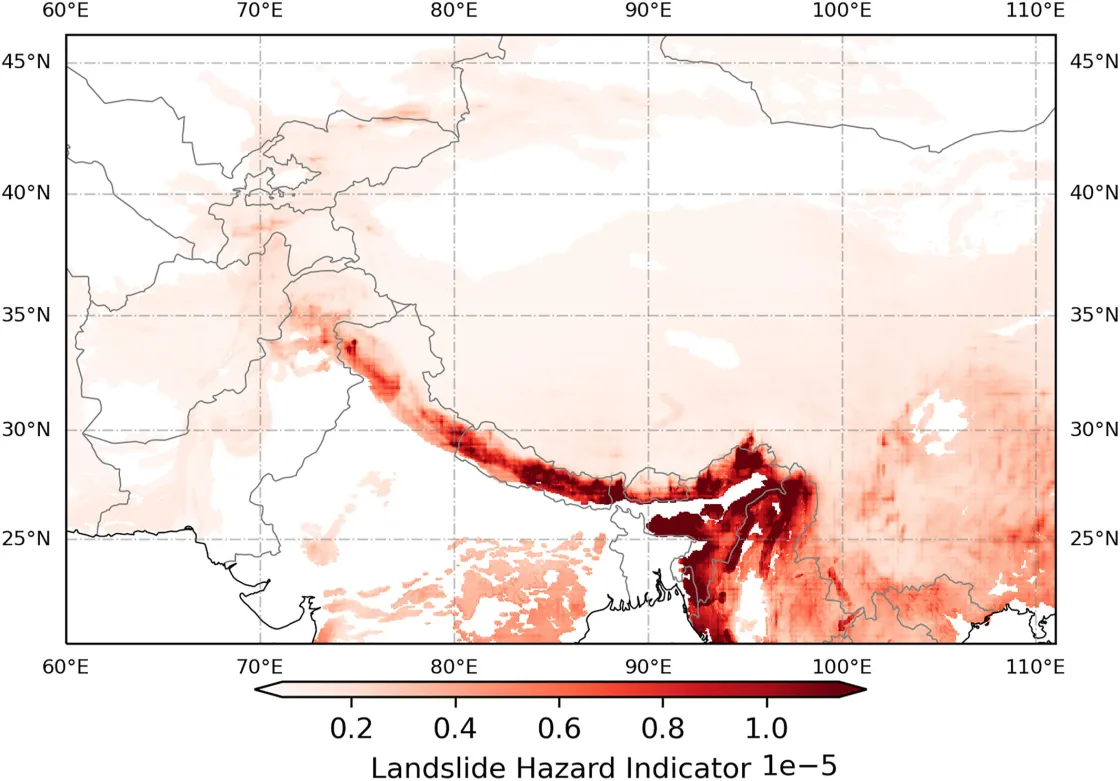
The researchers combined weather observations, topographic data, and SSPs in their study to create a measurement called the landslide hazard indicator (LHI). The LHU shows the daily probability of a landslide happening in a specific area and time period. LHIs were first developed in an earlier pilot study on landslides and were used again in the 2024 study.
Projected changes in High Mountain Asia landslide risk
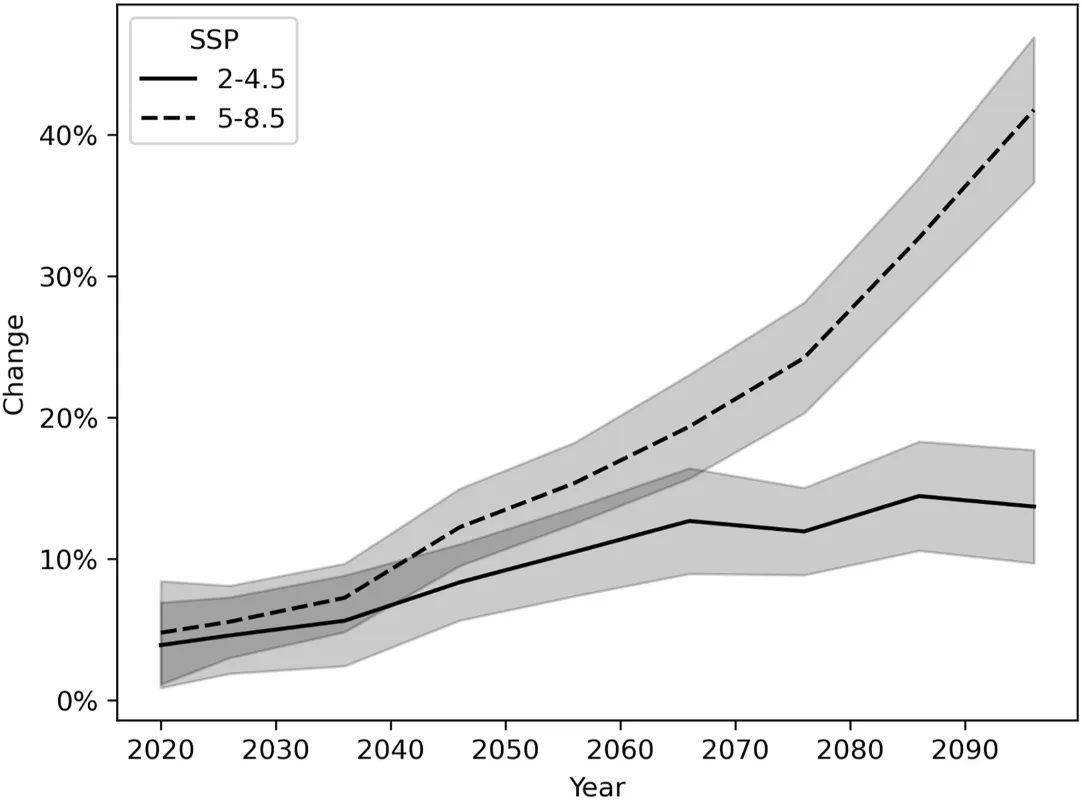
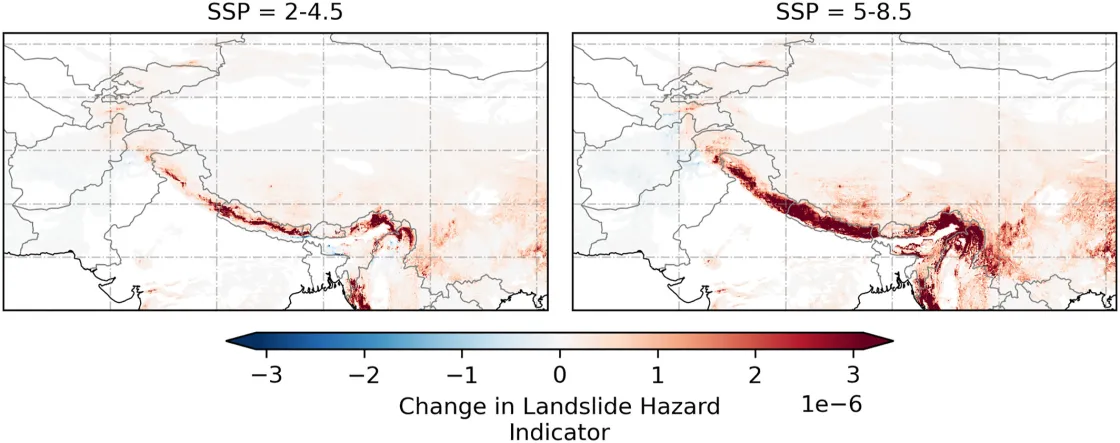
The study estimated increased landslide risks across High Mountain Asia by the end of the twenty-first century, both for development along current trends (SSP2-4.5) and heavy fossil fuel use (SSP5-8.5). While landslide risks are expected to rise under both scenarios, the risks increase markedly by the 2060s for the higher-emission scenario.
High Mountain Asia conditions vary greatly today and will continue to vary in the future. Future projections for the entire region show a broad range of possible changes over the coming decades.
The 2024 study concluded that the parts of High Mountain Asia that currently experience the highest landslide risks will continue to experience high risks throughout the twenty-first century. Currently, the Eastern Himalaya has the greatest risk.
Although the Eastern Himalaya will likely experience the greatest absolute increase in LHI, the greatest change, relative to current levels, is expected to occur on the Tibetan Plateau. The Tibetan Plateau sees fewer slope failures than the Eastern Himalaya, but some parts of the plateau experience frequent landslides.
Thomas Stanley, the 2024 study’s lead author, explained, “Most of the time there isn’t a landslide. But the growth in landslides presumably will have an effect." He pointed out that the September 2024 landslide near Kathmandu was just one example of landslides’ destructive power. Even a small increase in the incidence of landslides has the potential to devastate affected areas.
In all parts of High Mountain Asia, landslide risks are anticipated to increase along with higher greenhouse gas emissions. Stanley and coauthors emphasized “the need for continued vigilance by engineers, planners, and emergency responders across High Mountain Asia.”
Access data through the NSIDC DAAC
Supplementing the landslide risk paper, the researchers released a data set, available through the NSIDC DAAC. High Mountain Asia Daily 5km Landslide HazaAccrd Indicator provides daily projections of rainfall-triggered landslide risks for High Mountain Asia, from 2015 to 2100. Data files are available in NetCDF-4 format and can be visualized with multiple geographic information system (GIS) packages, such as ArcGIS or QGIS.
NASA’s NSIDC DAAC manages, distributes, and supports a variety of cryospheric and climate-related datasets as one of the discipline-specific Earth Science Data and Information System (ESDIS) data centers within NASA’s Earth Science Data Systems (ESDS) Program. User Resources include data documentation, help articles, data tools, training, and on-demand user support. Learn more about NSIDC DAAC services.
NSIDC data highlighted in this article include:
Stanley, T.A., R.B. Soobitsky, P.M. Amatya, and D.B. Kirschbaum. 2024. High Mountain Asia Daily 5km Landslide Hazard Indicator. (HMA2_LHI, Version 1). [Data Set]. Boulder, Colorado USA. NASA National Snow and Ice Data Center Distributed Active Archive Center. https://doi.org/10.5067/CU0JWHT2RNIW. [describe subset used if applicable]. Date Accessed 10-14-2024.
References
Petley, D. (2024). The Landslide Blog. Eos. Accessed October 14, 2024.
Stanley, T.A., R.B. Soobitsky, P.M. Amatya, and D.B. Kirschbaum. 2024. Landslide Hazard Is Projected to Increase Across High Mountain Asia. Earth’s Future 12(10): e2023EF004325. https://doi.org/10.1029/2023ef004325.


