By Michon Scott
Right now, meltwater runoff from the Greenland Ice Sheet is the single biggest source of new water added to Earth’s global ocean. The annual contribution can be measured in millimeters, which might sound trivial, but when combined with other phenomena along heavily populated coastlines, this seemingly small amount has large impacts.
The exact timing of Greenland meltwater reaching the ocean has effects ranging from local ocean salinity to coastal ecosystems. Meltwater storage in the ice affects ice sheet behavior. If scientists can better understand what happens between ice and snow melting, and the resulting meltwater landing in the ocean, they can better model the process and anticipate how it might change in the future.
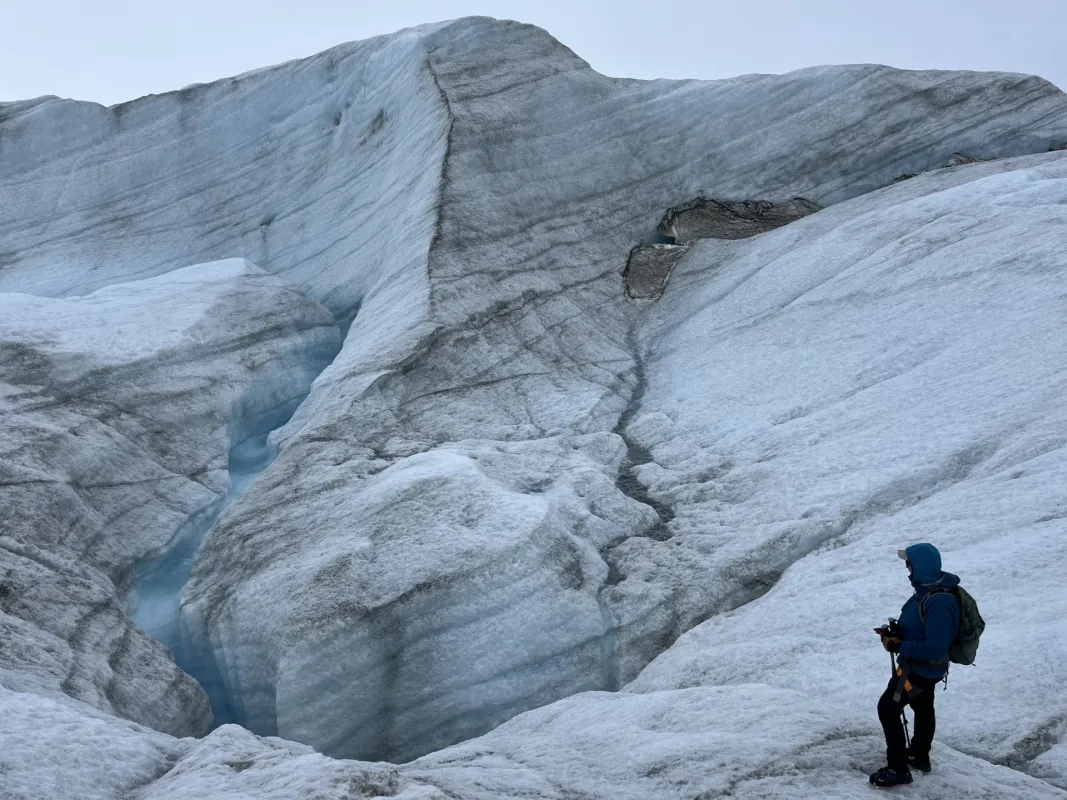
Most of Greenland’s meltwater does not simply slide off the ice surface and tumble over the side. Instead, meltwater persists on the ice surface in temporary lakes, refreezes in compressed snow at the ice sheet surface, or percolates to the bottom of the ice sheet where the ice meets the bedrock. Meltwater typically takes weeks to reach the ocean, and the temporary containment of meltwater under the ice is known as buffered water storage (BWS).
A recently published study highlights an innovative new method to track Greenland’s meltwater movement: monitoring the bedrock under the ice. Study authors, including National Snow and Ice Data Center (NSIDC) deputy lead scientist Twila Moon, took advantage of a network of Global Navigation Satellite System (GNSS) stations. The GNSS Network, called GNET, was originally designed primarily to measure changes in ice mass overlying the bedrock, but the authors of this new study realized GNET could also measure the meltwater’s distribution and movement.
Weighed down in a seasonal cycle
Bedrock sinks and rises in response to the addition or removal of mass on its surface. Water, ice, and snow weight has an impact on Greenland’s bedrock, compressing it or, when the weight is removed, allowing the bedrock to rebound. Even against the background of Greenland’s staggering mass of ice—enough to raise sea level globally by up to 7 meters (23 feet)—meltwater movement has a discernible effect on the bedrock. When the mass overhead is redistributed, the bedrock changes in response. The changes are small, compressing the rock only by millimeters, but the changes are still telling.
To figure out how many of those millimeters are due to meltwater, the research team had to filter out other factors, such as ocean tides, water storage on ice-free parts of Greenland, even atmospheric pressure on Greenland’s bedrock. To filter out all the other factors, the research team turned to established, peer-reviewed models, computing all the changes in bedrock loading by incorporating multiple models. The result was what study authors referred to as residual vertical displacement.
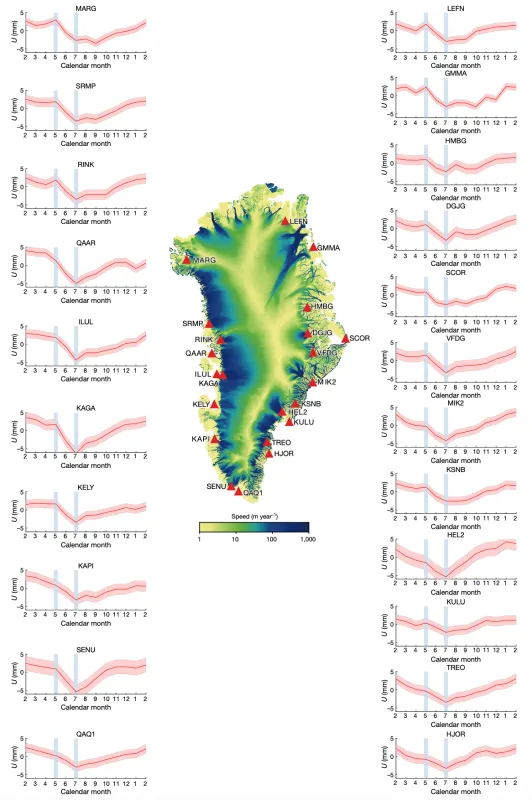
This innovative study drew from measurements taken by 22 of Greenland’s 54 GNET stations situated along the island’s perimeter. The study authors examined the stations’ readings, subtracted signals attributable to ice mass and water storage due to other factors than snow and ice melt, and identified the timing of bedrock changes.
Naturally, readings varied across the network, but they showed broad consistencies. Greenland’s meltwater formation, storage, and ultimate discharge into the ocean follows an average annual cycle, discernible from station readings. Stored water begins to accumulate from February to April, driving down the bedrock. The bedrock’s downward movement accelerates in May, and bedrock reaches its lowest point in July. After that, bedrock starts to rise. The accumulated water compresses the bedrock as much as roughly 5 millimeters during the melt season.
The implication of the residual vertical displacement is that meltwater accumulates in Greenland starting early in the Northern Hemisphere’s Spring, and peaks in mid-summer. How long meltwater endures in Greenland varies across the island, persisting four and a half weeks in southeastern Greenland, and nine weeks in other places.
What it all means
One of the key questions the study authors sought to answer was whether GNET observations could identify needed improvements in models. Moon stated, “Understanding this process reveals that commonly used regional climate models may underestimate meltwater runoff during warmer, higher melt, years.” The authors found that models need improvement, especially for record melt seasons such as the one observed in 2012. To accurately reflect intense melt years, the model projections should be scaled, in some instances, by as much as a 20 percent increase.
The study’s findings should interest more than just glacier modelers. Greenland’s contribution to sea level, though seemingly small, has real-world implications. Moon explained, “Because of the compounding effects of events like storm surge, even very small increases in sea level can have big consequences for homes, roads, communities, and more. The timing of meltwater release also makes a difference for how it influences local ecosystems important to Greenlanders and regional ocean conditions. These conditions are important for determining regional climates such as Northern Europe. Environment changes in Greenland have a surprisingly far reach, affecting us around the globe.”
Reference
Ran, J., P. Ditmar, M.R. van den Broeke, L. Liu, R. Klees, S.A. Khan, T. Moon, J. Li., M. Bevis, M. Zhong, X. Fettweis, J. Liu, B. Noël, C.K. Shum, J. Chen, L. Jiang, and T. van Dam. 2024. Vertical bedrock shifts reveal summer water storage in Greenland ice sheet. Nature 635:108-113. doi:10.1038/s41586-024-08096-3

