By Jane Beitler
The winter storms of 2009 to 2010 snuffed out everyday routines in cities in the northeastern United States and Europe. That December and January, El Niño and the Arctic Oscillation (AO) joined itineraries to route moisture and extreme cold into record-setting snowfalls. While people living in the northeastern United States and Europe were caught off guard by the snow, the effects of the AO on the Arctic were also unexpected.
The AO is an index that marks variations in atmospheric pressure patterns, which in turn lead to changes in weather patterns in the Arctic and in middle latitudes. Data back to 1951 show that the winter of 2009 to 2010 experienced the most negative AO on record. Past negative phases of the Arctic Oscillation helped keep Arctic sea ice extents higher through the end of the following summer. But not this season: Arctic sea ice reached its third-lowest level in the satellite record during September 2010. NSIDC scientist Julienne Stroeve and colleagues investigated to understand why.
Patterns of variability
In an average year, a low-pressure air mass sits over the Arctic in winter, creating frigid conditions there, while higher pressures and relatively warmer temperatures occur in lower latitudes. When the AO is in a negative phase, the typical low pressure pattern over Iceland is not as low; the typical high pressure system over the Beaufort Sea is stronger; and the mid-latitudes experience lower than average pressures. These shifts translate into changes in weather patterns that bring extremely cold air down to lower latitudes and send warmer air north.
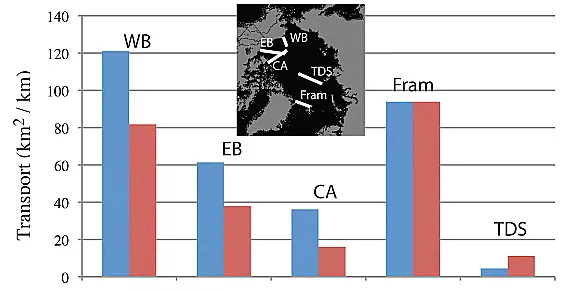
The changes in pressure patterns associated with a negative AO also affect the winds and ocean currents that cause sea ice to circulate around the Arctic. Arctic sea ice does not remain stuck in place all winter, and how the ice moves can be key to its survival later in the season. A positive AO tends to flush ice out of the Arctic through the Fram Strait, where it melts in the North Atlantic. This process leaves open water areas in the Arctic that refreeze, but the new ice is thin and vulnerable to melt later in the summer. During a negative AO winter, less sea ice exits through the Fram Strait, and more ice piles up against the Siberian coast and collects in the Canadian Basin, where it persists and thickens. This thicker ice resists melt during summer.
A change in character
So why did the negative phase of the AO in 2009/2010 fail to help retain ice the following summer? The researchers studied sea ice concentration data, sea ice motion fields, sea level pressures, and air temperatures to understand what happened. Comparing ice transport and the AO for each month, they found that during some periods, the negative AO indeed helped to keep sea ice in the Arctic.
But they also noted that the high- and low- pressure systems formed in different areas than during other negative AO winters. Typically, low pressure sits over Iceland during a negative AO, but that winter the AO center of action shifted towards the Barents and Kara seas. This caused enhanced transport of old, thick ice from the coast of the Canadian Archipelago southward and westward into the Beaufort and Chukchi seas; less ice was transported towards Siberia. Since this old, thick ice ended up in the southerly reaches of the Beaufort and Chukchi seas, it was more vulnerable to summer melt.
After years of steady decline in the ice cover, this ice was also likely to be thinner than in past years. The combination of transport of the Arctic's remaining store of old, thick ice into the southerly reaches of the Beaufort and Chukchi seas, together with an overall thinning of the ice over the past several decades, helped lead to the low extent observed in September 2010. Researchers expect to see continued declines in ice volume and extent. And as the ice thins, atmospheric patterns known to help stabilize ice loss are becoming less effective at doing so.
Reference
Stroeve, Julienne C., Mark C. Serreze, Ignatius Rigor, Walter Meier, and Charles Fowler. 2011. Sea ice response to an extreme negative phase of the Arctic Oscillation during winter 2009/2010. Geophysical Research Letters 38, L02502, doi:10.1029/2010GL045662.

