By Agnieszka Gautier
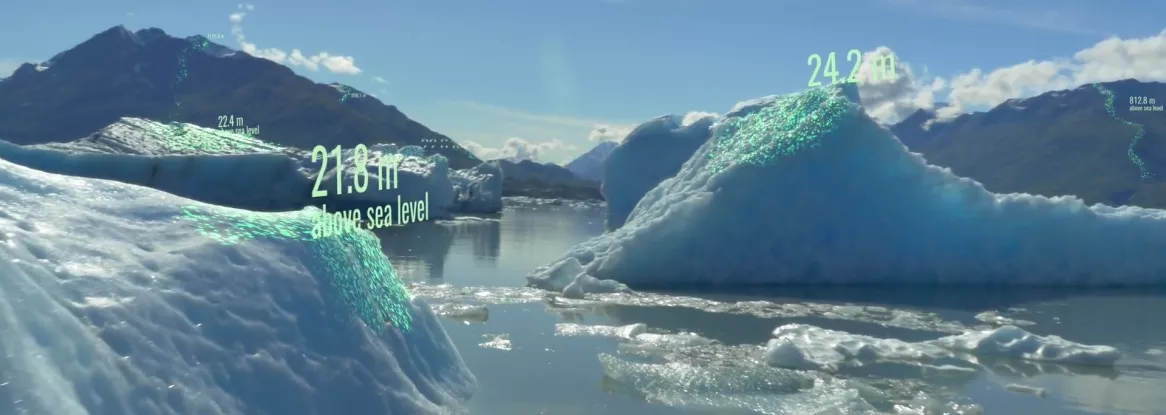
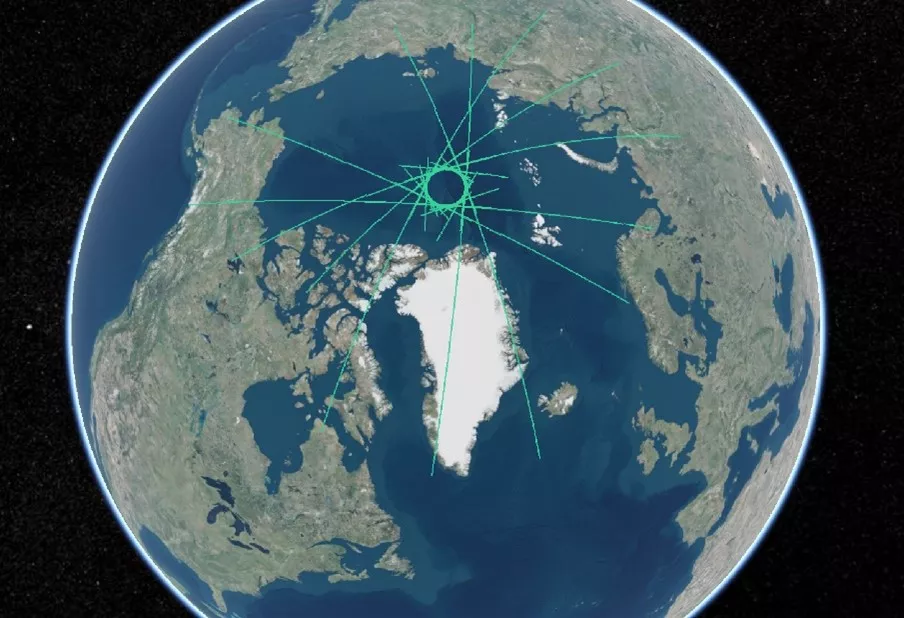
Every three months, the NASA Ice, Cloud, and land Elevation Satellite-2 (ICESat-2) completes a comprehensive measurement of Earth’s surface, mapping our planet in cool three-dimensional details. It tracks changes to tree canopy heights, ocean and lake levels, and the elevation of ice sheets, glaciers, and sea ice.
After NASA processes ICESat-2 data, it is sent to the NASA National Snow and Ice Data Center (NSIDC) Distributed Active Archive Center (DAAC) to archive and manage. The DAAC supports users through tutorial assistance, documentation, maintaining the website, and ensuring quality of data. Understanding how data are used has also helped the ICESat-2 mission produce products like Quick Looks, a faster but less refined data product than the final data. Here is a snapshot of the ICESat-2 mission and its data.
The mission
Launched in 2018, ICESat-2 continues the original ICESat mission, which began in 2003, aiming to provide a critical look at ice thickness at Earth’s polar regions. ICESat stopped collecting data in 2010 when its primary instrument failed. To fill the gap in data, NASA sparked Operation IceBridge, which flew aircraft equipped with airborne instruments over the polar regions while scientists prepared ICESat-2 for launch.
Like marks on a door jamb displaying a child’s growth, measurements over time track changes. As the globe faces rising temperatures, the most apparent changes involve Earth’s frozen regions, but the changes extend well beyond. The upgrade to ICESat-2 has improved estimates for sea level rise, land and sea ice thickness, and the amount of vegetation on the planet.
How ICESat-2 works
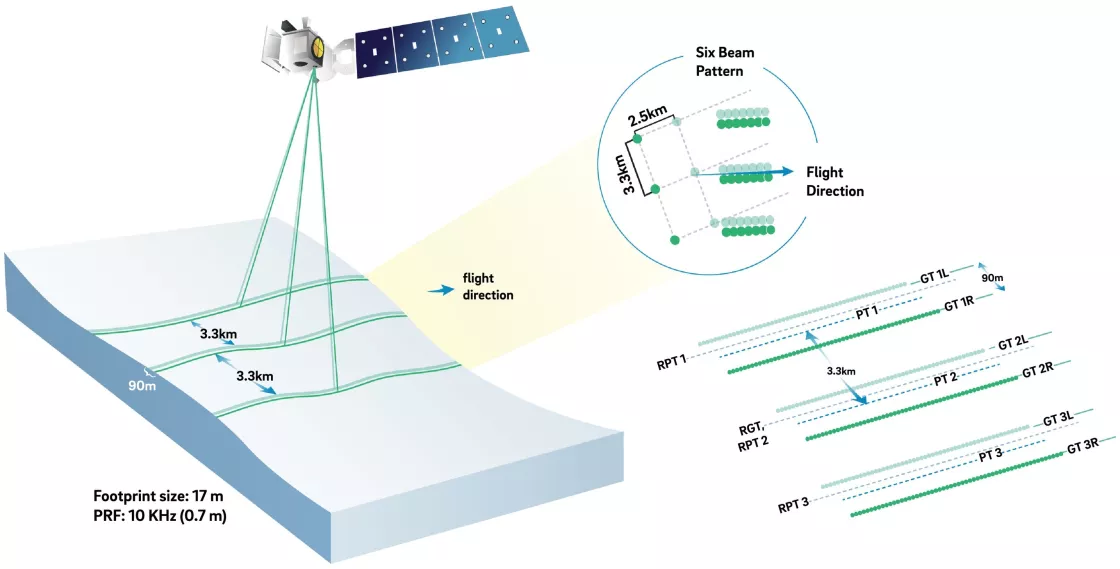
The Advanced Topographic Altimeter System (ATLAS) instrument on board ICESat-2 uses six laser beams split into three pairs, blasting 10,000 laser light pulses per second. The photons beam down 500 kilometers (310 miles), bounce off Earth’s surface, and return to the satellite. That round-trip journey measures height at a distance down to 4 millimeters, detecting fine details like crevasses in a glacier.
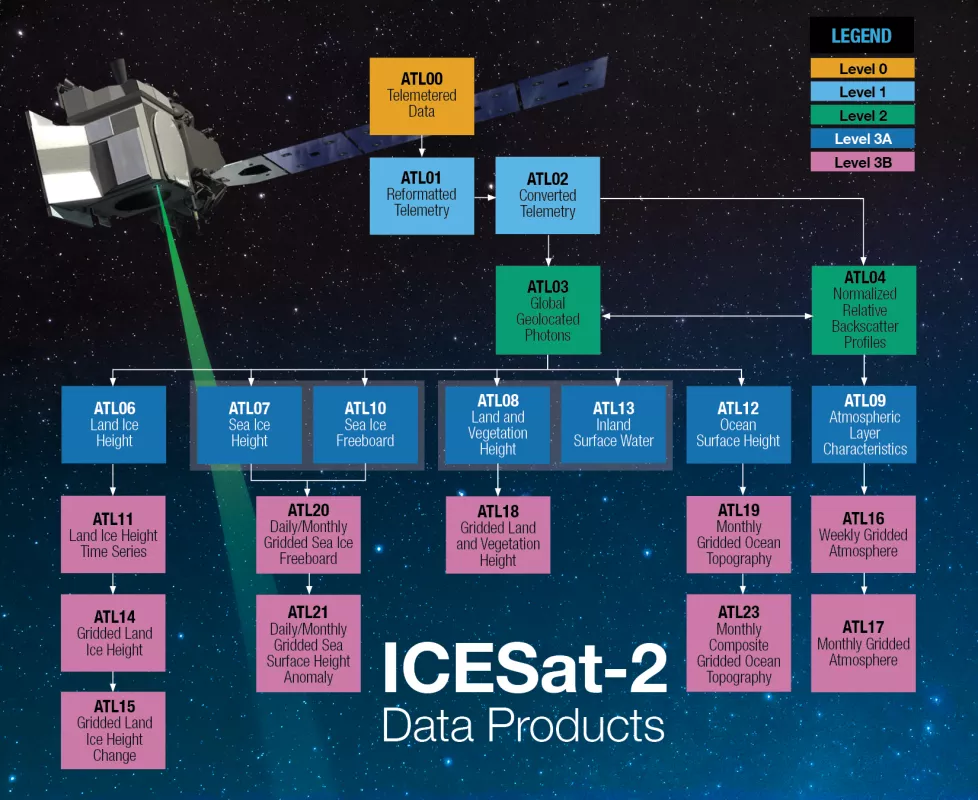
As the satellite shoots the laser toward Earth, each photon picks up a location that is tracked and stored at the DAAC. All the subsequent products, like vegetation height and sea ice thickness, are based on this data. However, a challenge with ICESat-2 data is timing.
Quick Look data
With 10,000 photons picking up location, making accurate calculations takes time. For NASA to process the data and maximize its accuracy, it can take up to 45 days. Knowing ICESat-2’s position in space is critical. A child’s growth would be inaccurate if the floor moved up or down. Equipped with GPS onboard and center-of-gravity knowledge, the satellite can control its position and orientation, but corrections are still needed after the data comes to NASA. For instance, scientists must check what the tides are doing when the measurements are taken so as not to confuse natural fluctuation with actual sea level heights. It takes time to do that.
On such a timescale, forecasting of sea ice conditions or atmospheric conditions, for instance, is moot. Timely research needs faster data. The solution is Quick Look data. After a preliminary processing, Quick Look data are available to users within three days. The main difference between this expedited data and the standard data is the degree of precision in location. For a sea ice forecast model, precision down to the hundredth decimal is not necessary.
When final products are released, they replace the Quick Look data.
Applications of ICESat-2 data
Researchers can use ICESat-2 data to produce new products like cloud, ocean coastline, and melt pond data products.
Photons bounce off clouds and other particles in the atmosphere, and this information can feed into cloud data products. Some photons penetrate the ocean’s surface to shallow depths, revealing the contours of the ocean bottom, known as bathymetry, near coastlines. Also, with their ability to push through water, these photons can offer measurements of melt ponds that form on thawing ice surfaces.
Researchers using ICESat-2 data also collaborate with the European Union’s CryoSat-2 mission. Carrying a radar altimeter, CryoSat-2 was launched in 2010. A decade later, its orbit was altered to partially overlap with ICESat-2, providing two different readings—a laser and radar altimetry. The two different types of energy returns are helping scientists calculate the amount of snow on sea ice, allowing for more accurate sea ice thickness measurements.
The more users engage with the data, the more potential research ideas emerge that may fuel new products and collaborations. After all, this is just the beginning for ICESat-2 data.
Further information
Access data through the NSIDC DAAC
NASA’s NSIDC DAAC manages, distributes, and supports a variety of cryospheric and climate-related datasets as one of the discipline-specific Earth Science Data and Information System (ESDIS) data centers within NASA’s Earth Science Data Systems (ESDS) Program. User Resources include data documentation, help articles, data tools, training, and on-demand user support. Learn more about NSIDC DAAC services.


