By Jane Beitler
If you live in, work in, or study the Arctic, you may have noted firsthand the evidence of warming felt more strongly there than in most other places on Earth. Summer sea ice is drawing back from coasts, glaciers are waning, ice sheets are discharging rivers of summer melt; once permanently frozen ground is turning to mush, and landscapes are changing as shrubby vegetation advances northward and plants have a longer growing season. This outsized warming in the Arctic is called Arctic amplification, and was predicted by climate scientists to occur as global atmospheric carbon dioxide concentrations rise.
But exactly how much change is occurring in the Arctic’s vital signs, and where? Warming and change do not affect every place in the Arctic equally. The pace and place of change are also influenced by other variables, such as weather patterns. NASA possesses a wealth of data on Arctic change from its Earth observing missions and related studies. But until now, unlocking the information in these data has required considerable technical and scientific expertise and time.
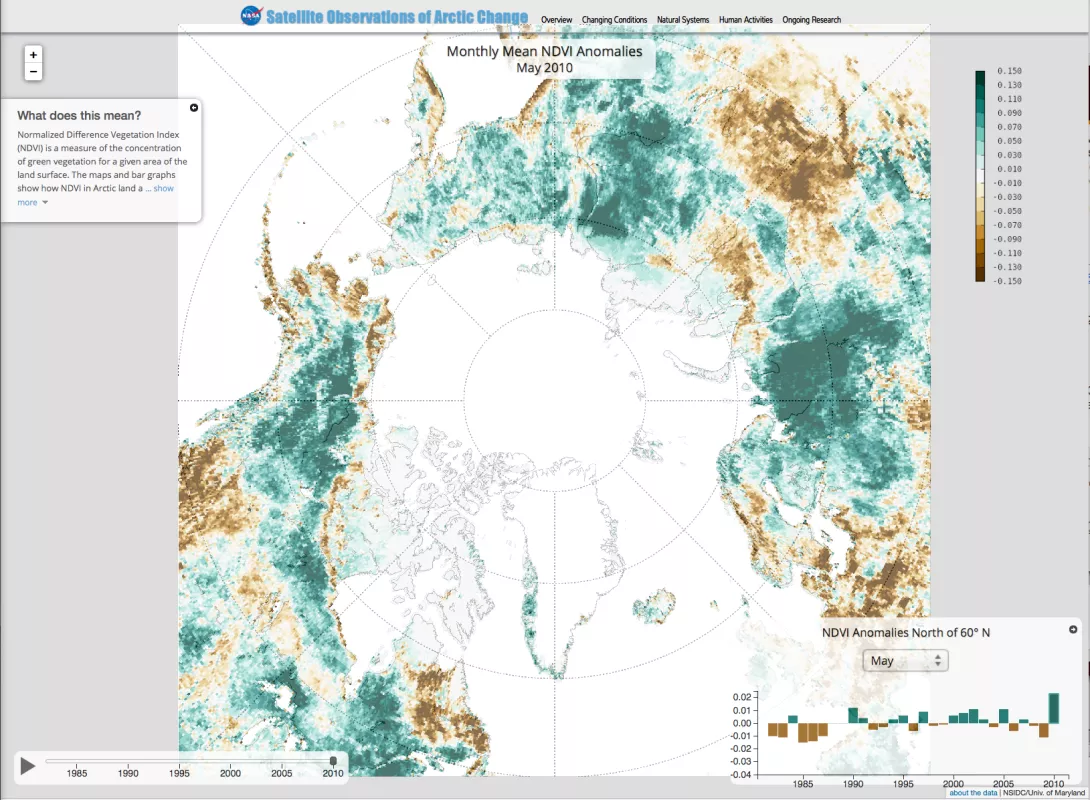
To make data on Arctic change accessible to a wider audience of non-specialist scientists, policymakers, and others, NSIDC has developed a new Web site that lets you explore data on change in the Arctic over time, without any programming or specialized tools. The site, Satellite Observations of Arctic Change (SOAC), allows you to view and interact with data on a map. You can animate a time series, zoom in or out, and view a bar graph of anomalies over time. Links to the source data and documentation are also included. Additional pages provide brief scientific discussion, and overviews of the scientific importance of these data. Presently, SOAC offers seven data sets:
- Air temperatures: Near-surface air temperature anomalies, from MERRA, data from 1979
- Water vapor: Total column water vapor anomalies, from MERRA, data from 1979
- Sea Ice: Monthly mean sea ice concentration anomalies, from the NSIDC Sea Ice Index, data from 1979
- Snow cover: Snow cover duration anomalies, from Rutgers Snow Cover Lab, data from 1966
- Vegetation/greenness: Monthly mean NDVI anomalies, from GIMMS, data from 1982
- Frozen ground: Soil non-frozen period anomalies, from NASA MEaSUREs, data from 1981
- Snow and ice cover: Annual minimum exposed snow and ice, from MODICE, data from 2000
More data types and extended temporal coverage may be added in the future, if interest warrants and funding continues. SOAC was developed with support from NASA Earth Sciences (http://science.nasa.gov/earth-science/). Visit Satellite Observations of Arctic Change.

