The World Meteorological Organization (WMO) has just released a catalogue of benchmark data sets, including four from the National Snow and Ice Data Center (NSIDC), to promote as trusted data sources, simplify user access and support global policy makers.
“It is a credit to NSIDC to be asked to be part of that—that the data NSIDC stewards are considered that caliber,” said David Gallaher, a data manager at NSIDC, which is part of the Cooperative Institute for Research in Environmental Sciences (CIRES) at the University of Colorado Boulder.
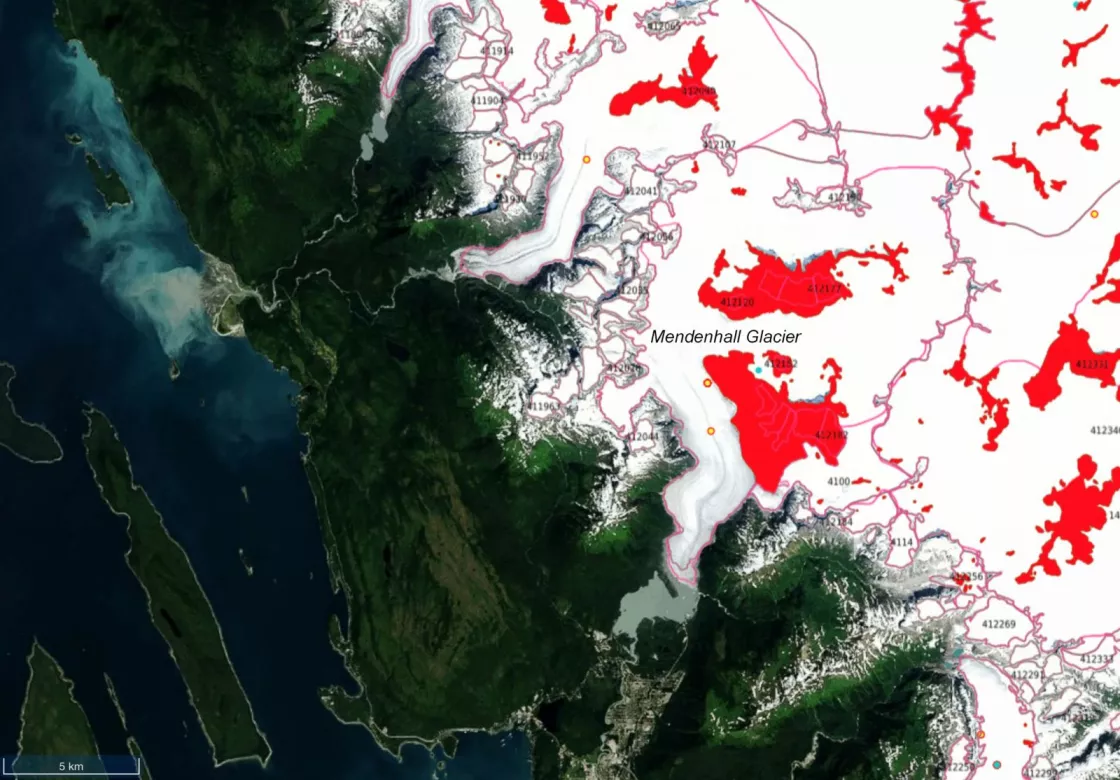
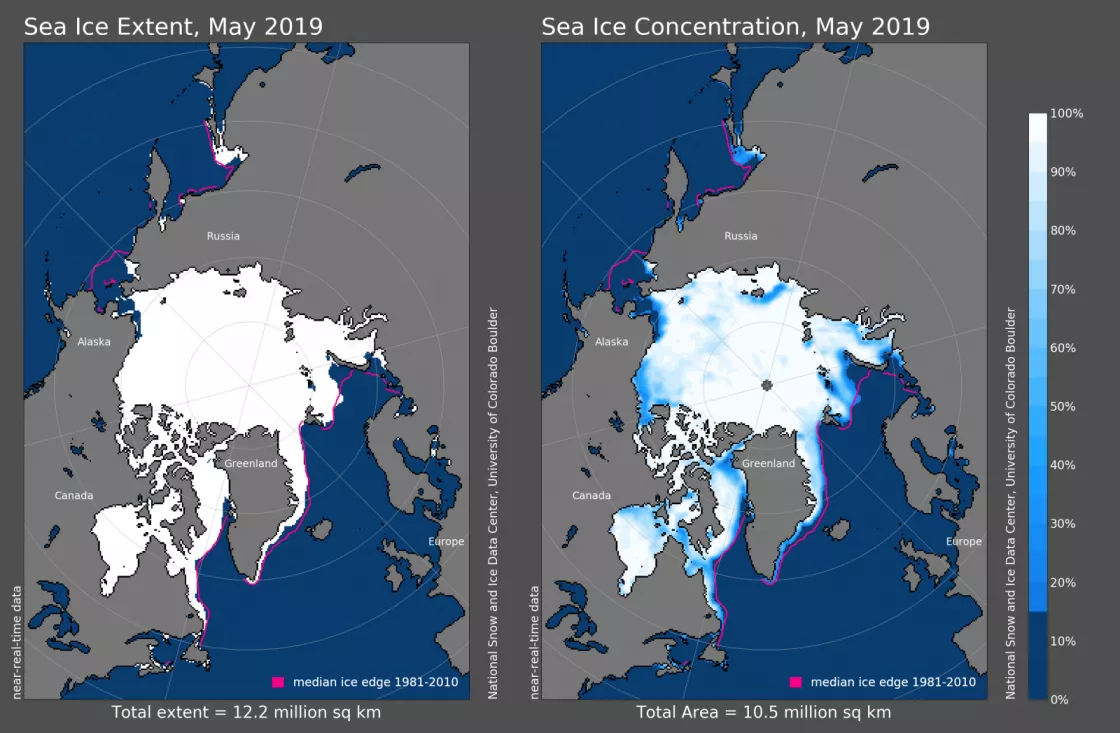
NSIDC distributes four of the six data sets selected to represent key climate variables in Earth’s frozen regions, known collectively as the cryosphere: the Sea Ice Index (Fetterer, F., et al.), the Global Land Ice Measurements from Space (GLIMS), the Antarctic 1-kilometer Digital Elevation Model (Bamber, J., J. L. Gomez-Dans, and J. A. Griggs), and Geoscience Laser Altimeter System/Ice, Cloud, and Elevation satellite (GLAS/ICESat) 500-meter Laser Altimetry Digital Elevation Model of Antarctica (John P. DiMarzio). The NASA Distributed Active Archive Center (DAAC) and National Oceanic and Atmospheric Administration (NOAA) programs at NSIDC provide the stewardship for these data and are instrumental in their quality management and governance.
A long-term view
Earth is currently on track for a three-degree Celsius warming by 2100, according to the WMO. That, however, is if the government commitments pledged during the Paris climate agreement in 2015 are actually fulfilled. Already, this past decade has seen lingering heat-waves and record-breaking storms with just a one-degree warming since the middle of the nineteenth century.
These numbers, however, are just averages. Masked within are extremes. For instance, the Arctic is warming at twice the rate of the rest of the planet, disproportionately affecting its environment and people.
But how do we know this to be true? High quality, accessible data informs our understanding of a changing climate. Scientists require reliable data products to deliver statistical analyses, modeling, and climate predictions and forecasting to policymakers. Without the data, their insight carries no weight. So the WMO created the Catalogue for Climate Data through an internationally agreed evaluation process as a staple of trustworthy and recognized datasets.
Timeless data
In October 2017, a team of experts extensively reviewed select data sets, and gave each a quality assurance grade. The WMO brought this diverse group to Geneva, Switzerland, from national data centers, international organizations, and academia to agree upon a set of criteria for essential data sets in temperature, precipitation, sea level, sea ice, ice sheets and glaciers. “We wanted to pick data that could best tell this tale of what’s really going on,” said Gallaher, one of the invited experts.
Longevity, or long-term data, took priority, as did global coverage. For example, a new high-resolution sensor may better depict complex sea ice, but a sensor that has only been around for two years cannot tell the story of sea ice change over the course of decades. The Sea Ice Index data set at NSIDC, which spans 40 years, can.
Other attributes the WMO considered included well-documented metadata—the data about the data—transparency of the documentation, accessibility to the public, discoverability, portability, and usage.
Data are foundational. “That’s why this was done: to show the data, to catalogue and give it a gold stamp of approval,” Gallaher said. This catalogue will be a reference guide for researchers, policymakers and the general public interested in present and future climate reports and analyses. “We have scrutinized the data here. We can’t evaluate every data set on the planet, but at least we evaluate the most important ones,” Gallaher said.
The WMO plans to make their catalogue readily and widely available to the public, serving broader use as a guide to trusted climate data.
For more information
The World Meteorological Organization (WMO)
Climate change impacts worse than expected, global report warns
Global temperatures on track for 3-5 degree rise by 2100: UN
Access data through the NSIDC DAAC
NASA’s NSIDC DAAC manages, distributes, and supports a variety of cryospheric and climate-related datasets as one of the discipline-specific Earth Science Data and Information System (ESDIS) data centers within NASA’s Earth Science Data Systems (ESDS) Program. User Resources include data documentation, help articles, data tools, training, and on-demand user support. Learn more about NSIDC DAAC services.
Access data through NOAA@NSIDC
NSIDC archives a variety of data sets on behalf of NOAA. In addition to archiving data, the NOAA@NSIDC provides data users with multiple methods of support: documentation, help articles, data tools, training, and on-demand support.


