By Michon Scott
When global sea level rises, multiple sources are often to blame. Thermal expansion—water taking up more volume as it warms—boosts sea level. So does melting land ice, putting new water into the ocean. (Sea ice melt does not raise ocean level since that ice floats on the surface and displaces its own volume before it melts.)
Mountain glaciers have long sent meltwater trickling into the sea, but glaciologists increasingly worry about ice sheets. An ice sheet is a mass of land ice that covers more than 50,000 square kilometers (20,000 square miles), a bit like a giant glacier flowing outward in all directions. Our planet has two ice sheets: one on Antarctica and the other on Greenland. As recently as the 1990s, glaciologists were not very concerned about ice sheet impacts on coastal areas, but around the year 2000, researchers developed the tools to measure changes in the ice sheets, and discovered that substantial ice loss was already underway.
So, if ice sheet losses continue or even worsen, where will sea level rise the most? Sea level rise from ice sheet loss will not be uniform and, ironically, sea levels near melting ice sheets will likely fall. Scientists anticipate that sea level will rise fastest along some densely populated coastal regions in the tropics and mid-latitudes. In North America, the regions likely to experience the fastest rates of sea level rise are the southern United States East Coast and Gulf Coast.
How could ice sheet loss raise global sea level?
Together, the Antarctic and Greenland Ice Sheets hold enough water to raise sea level by roughly 65 meters (more than 210 feet) if they melt entirely. That will not happen in the foreseeable future, but it hardly takes the entire loss of an ice sheet to affect population centers worldwide. According to a 2019 estimate by the Intergovernmental Panel on Climate Change (IPCC), 680 million people live in low-lying coastal zones, and that number could exceed 1 billion by 2050. The melt of just a tiny fraction of an ice sheet exacerbates high-tide flooding, and rapid change on an ice sheet could spell disaster.
For example, Antarctica’s Thwaites Glacier drains a giant expanse of the ice sheet in West Antarctica. The glacier covers an area larger than the state of Florida. At its current rate of retreat, it is expected to contribute several centimeters (a few inches) to sea level rise by the end of this century. A worst-case scenario involves sudden retreat of the glacier beginning later this century, loosening enough ice to raise sea level by more than 3 meters (10 feet) over the next few hundred years.
This potential for disaster motivates glaciologists to study ice sheets closely. The Ice sheet Mass Balance Inter-comparison Exercise (IMBIE), an international collaboration of polar scientists, has conducted multiple ice-sheet-monitoring studies. A 2023 IMBIE study found growing impact on sea level from the early 1990s through 2020. Over that time, ice sheets contributed approximately 21 millimeters (0.8 inch) to global mean sea level. Moreover, the study found the rate of annual ice loss increased, from roughly 105 billion metric tons per year between 1992 and 1996, to roughly 372 billion metric tons per year between 2016 and 2020.
In some regions, the effect of current ice sheet melt is worsened by the aftereffects of ice sheet melt that happened thousands of years ago.
The legacy of the Laurentide Ice Sheet
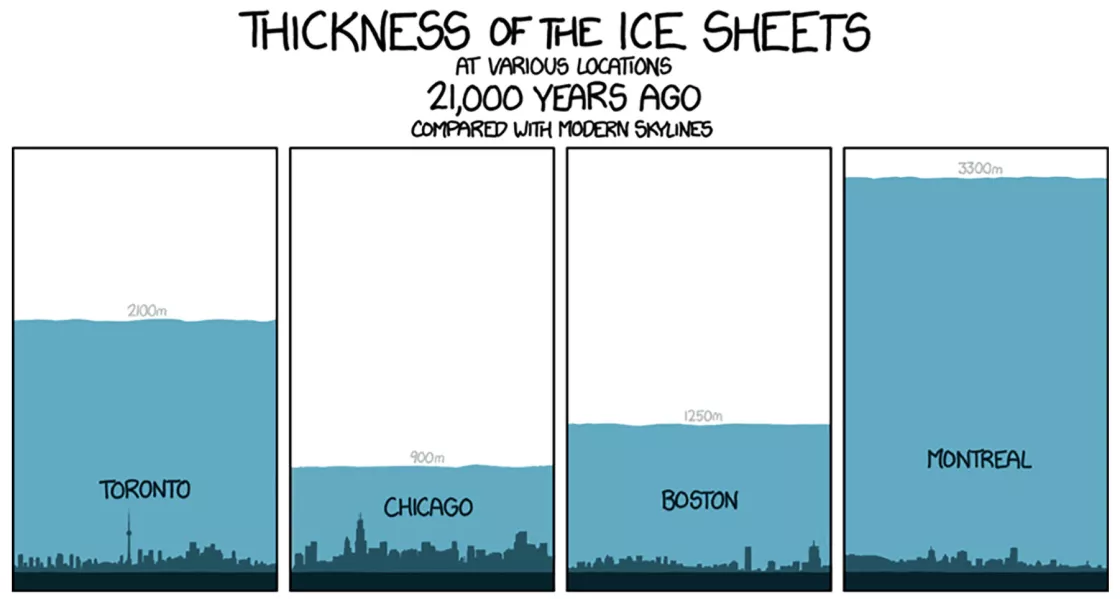
About 20,000 years ago, ice sheets blanketed the Arctic, Scandinavia, and much of North America. One ice sheet, the Laurentide, extended as far south as present-day Kansas and Kentucky.
Although it floats in water, the weight of ice in an ice sheet still presses down hard on the land. The Laurentide Ice Sheet not only covered parts of present-day United States and Canada, but it also pushed them downward into the Earth’s crust. North America is still adjusting to the removal of that weight.
Imagine a long balloon, the kind used in a balloon animal. Place the balloon on a flat surface and press gently on any part of it. The parts of the balloon you have not touched bulge outward. Remove your hand and the balloon reverts to its original shape. Earth’s continents respond in a similar way—just much more slowly. When an ice sheet retreats, areas that were directly under the ice rise while areas that were on the bulge sink. But this process takes hundreds to thousands of years. It is still continuing today.
Parts of the United States East Coast and Gulf Coast used to lie on the bulging parts of the North American continent. They are still sinking, adjusting to the removal of the Laurentide Ice Sheet’s weight, and this process will continue for thousands more years. By some estimates, the land around Chesapeake Bay will sink several more inches over the next century.
Sinking coastal areas may face double jeopardy as they contend with rising sea levels—not because they are near today’s retreating ice sheets, but because they are far away.
Icy magnetism
Every physical body in the universe exerts a gravitational pull on the bodies around it. In most cases, the effect is negligible because it is overwhelmed by the gravitational pull of a much larger body. Your pull on a bag of chips might feel strong, but both you and the chips are mostly bound by Earth’s gravitational pull. Really big objects are more powerful. Just consider the moon’s influence on Earth’s ocean tides.
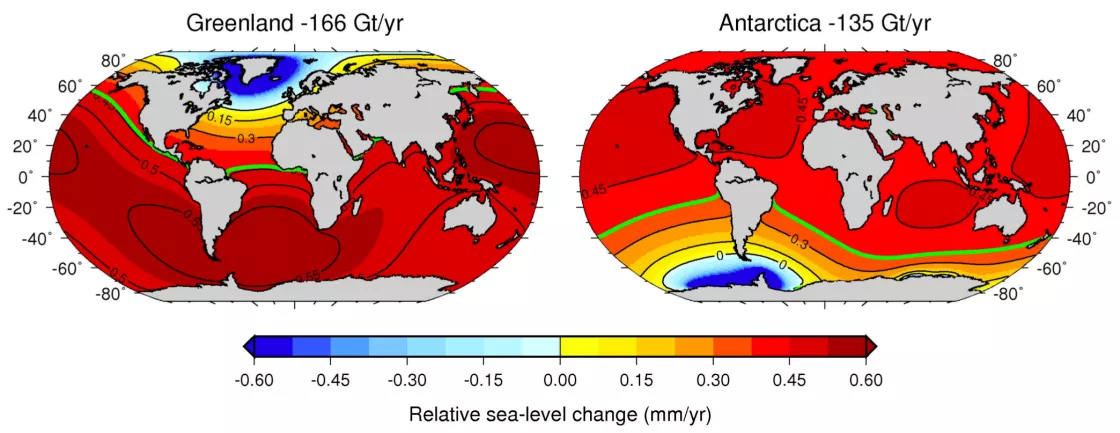
The Greenland and Antarctic Ice Sheets are massive enough to exert a gravitational pull on nearby ocean waters. As the ice sheets lose mass, the nearby ocean levels drop. Water, somewhat freed from the ice sheet’s influence, sloshes elsewhere in the global ocean.
The oceanic outcome would differ depending on whether the ice loss occurred on Greenland or Antarctica. But ice loss solely from either ice sheet is not a realistic scenario, nor is rising ocean level due solely to ice sheet mass loss. Thermal expansion, mountain glacier retreat, and land adjusting to the retreat of ancient glaciers will combine to boost regional ocean levels.
Where sea level may rise the most
Ice sheet loss will work in concert with other factors to raise coastal waters.
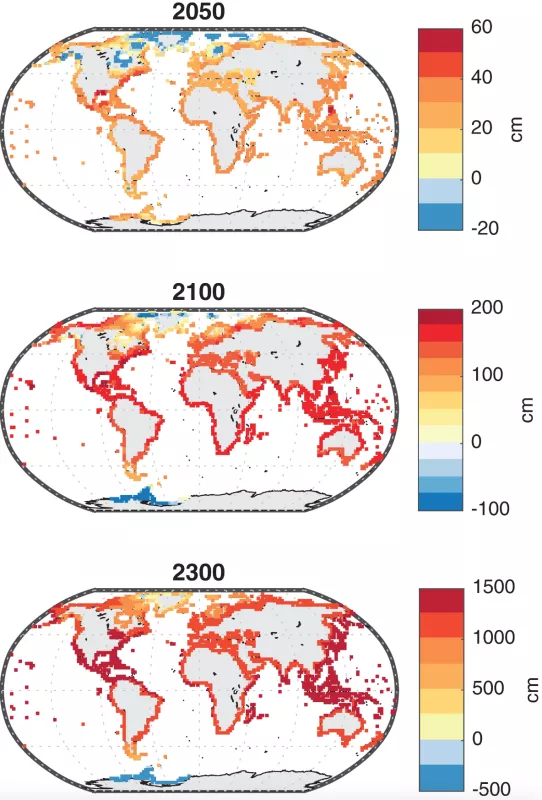
A 2010 study linking ice sheet loss and sea level rise forecast that the hardest-hit areas would be coastal regions between 20°N and 40°S across the Pacific and Indian Oceans, including “particularly vulnerable land masses in Oceania.” This could affect coastal populations in places such as Thailand, Cambodia, Malaysia, Indonesia, the Philippines, Australia, New Zealand, Kirbati, Papua New Guinea, Tuvalu, and Fiji, to name some examples.
In the United States, the National Oceanic and Atmospheric Administration (NOAA) projected in a 2022 report that, from 2020 to 2050, sea level will rise on average 0.25 to 0.30 meters (10 to 12 inches)—as much as the sea level rise measured from 1920 to 2020. But amounts will vary geographically. Smallest amounts are anticipated for the northern West Coast (0.1 to 0.2 meters, or 4 to 8 inches) and Hawaiian Islands (0.15 to 0.2 meters, or 6 to 8 inches). Higher amounts are expected for the Caribbean and northern Alaska (0.2 to 0.25 meters, or 8 to 10 inches). Highest amounts are expected for the East Coast (0.25 to 0.35 meters, or 10 to 14 inches) and the Gulf Coast (0.35 to 0.45 meters, or 14 to 18 inches).
References
Bamber, J., and R. Riva. 2010. The sea level fingerprint of recent ice mass fluxes. The Cryosphere 4:621-627. https://doi.org/10.5194/tc-4-621-2010.
Intergovernmental Panel on Climate Change. 2022. Summary for Policymakers.
Kopp, R.E. R.M. DeConto, D.A. Bader, C.C. Hay, R.M. Horton, S. Kulp, M. Oppenheimer, D. Pollard, and B.H. Strauss. 2017. Evolving understanding of Antarctic Ice-Sheet physics and ambiguity in probabilistic sea-level projections. Earth’s Future 5: 1217-1233. https://doi.org/10.1002/2017EF000663.
Kurtze, D.A. 2022. Gravitational effects of ice sheets on sea level. American Journal of Physics 90(5): 351-358. https://doi.org/10.1119/5.0067924.
McMichael, C., S. Dasgupta, S. Ayeb-Karlsson, and I. Kelman. 2020. A review of estimating population exposure to sea-level rise and the relevance for migration. Environmental Research Letters 15: 123005. https://doi.org/10.1088/1748-9326/abb398.
NOAA. 2022. 2022 Sea Level Rise Technical Report.
NOAA. What is glacial isostatic adjustment? Accessed May 11, 2023.
Otosaka, I.N., A. Shepherd, E.R. Ivins, N.-J. Schlegel, C. Amory, M.R. van den Broeke, M. Horwath, I. Joughin, M.D. King, G. Krinner, S. Nowicki, A.J. Payne, E. Rignot, T. Scambos, K.M. Simon, B.E. Smith, L.S. Sørensen, I. Velicogna, P.L. Whitehouse, G.A.C. Agosta, A.P. Ahlstrøm, A. Blazquez, W. Colgan, M..E. Engdahl, X. Fettweis, R. Forsberg, H. Gallée, A. Gardner, L. Gilbert, N. Gourmelen, A. Groh, B..C. Gunter, C. Harig, V. Helm, S..A. Khan, C. Kittel, H. Konrad, P.L. Langen, B.S. Lecavalier, C.-C. Liang, B.D. Loomis, M. McMillan, D. Melini, S.H. Mernild, R. Mottram, J. Mouginot, J. Nilsson, B. Noël, M.E. Pattle, W.R. Peltier, N. Pie, M. Roca, I. Sasgen, H.V. Save, K.-W. Seo, B. Scheuchl, E.J. O. Schrama, L. Schröder, S.B. Simonsen, T. Slater, G. Spada, T.C. Sutterley, B.D. Vishwakarma, J.M. van Wessem, D. Wiese, W. van der Wal, and B. Wouters. 2023. Mass balance of the Greenland and Antarctic ice sheets from 1992 to 2020. Earth System Science Data. 15: 1597-1616. https://doi.org/10.5194/essd-15-1597-2023.
Scambos, T.A., R.E. Bell, R.B. Alley, S. Anandakrishnan, D.H. Bromwich, K. Brunt, K. Christianson, T. Creyts, S.B. Das, R. DeConto, P. Dutrieux, H.A. Fricker, D. Holland, J. MacGregor, B. Medley, J.P. Nicolas, D. Pollard, M.R. Siegfried, A.M. Smith, E.J. Steig, L.D. Trusel, D.G. Vaughan, and P.L. Yager. 2017. How much, how fast?: A science review and outlook for research on the instability of Antarctica’s Thwaites Glacier in the 21st century. Global and Planetary Change 153: 16-34. https://doi.org/10.1016/j.gloplacha.2017.04.008.


