By Michon Scott
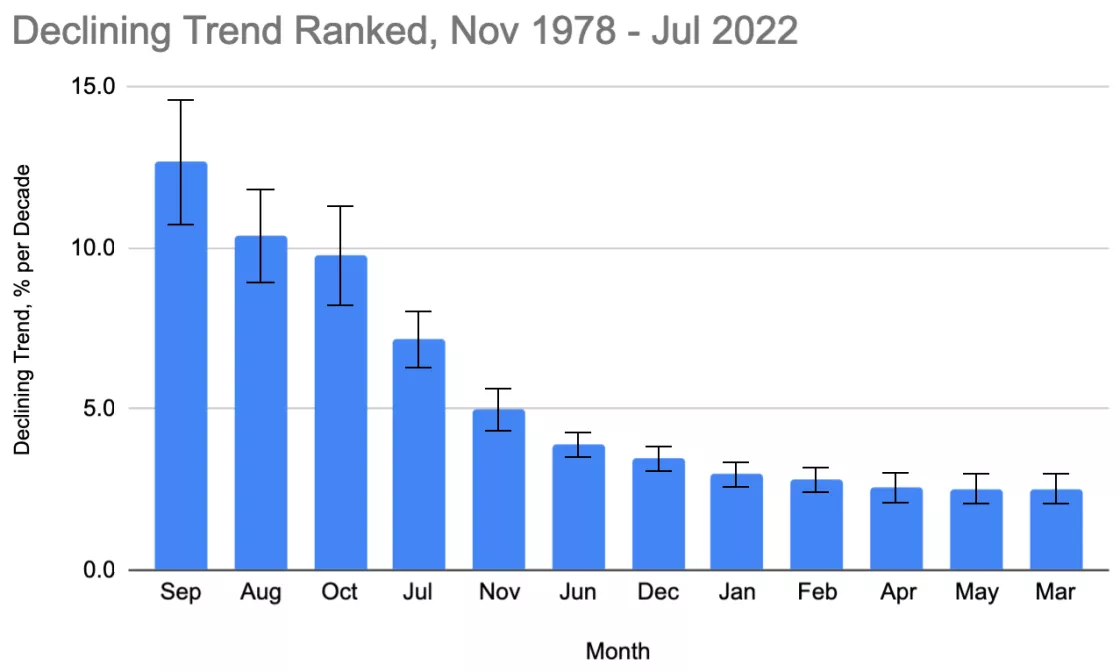
NSIDC archives satellite data for polar sea ice dating back to November 1978. As public interest in sea ice has grown, NSIDC has published regular updates on sea ice conditions in Sea Ice Today. The sharpest declines have occurred in the summer and fall, including the time of year when sea ice reaches its annual minimum in September.
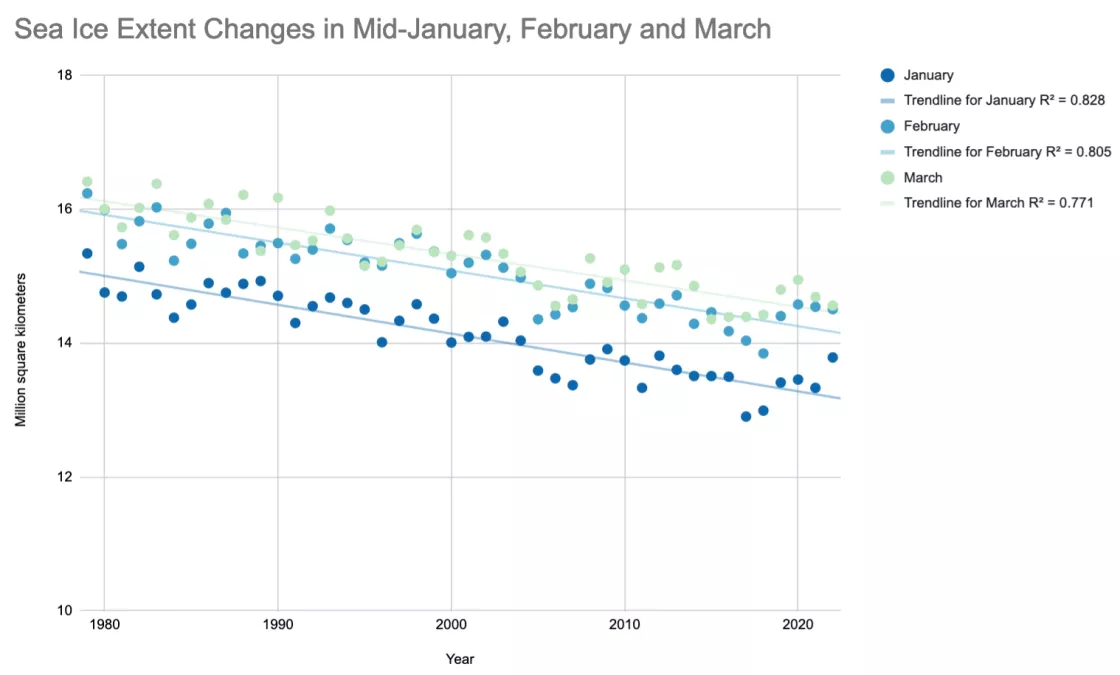
Although Arctic sea ice extent has not declined as much during winter months, it has still shown a steadily decreasing trend. Arctic sea ice extent now exhibits long-term declines in all months, including the coldest, darkest months of the year.
Now is the winter of our discontent
In both the Arctic and Antarctic regions, sea ice melts throughout the spring and summer, and grows throughout the fall and winter. In the Arctic, sea ice often reaches its annual minimum in September then resumes its annual growth cycle.
Since the start of the satellite record, Arctic sea ice has declined significantly in September. Lower September minimums can drag down sea ice extent in October, in part because sea ice begins growing from a smaller extent. In short, lower summertime extents have likely created a new normal in autumn.
Compared to summer and autumn declines, wintertime Arctic sea ice reductions have been smaller, but they are still significant.
A 2018 study on changing Arctic sea ice across all seasons, coauthored by NSIDC’s Julienne Stroeve, examined long-term sea ice changes. The study concluded that, compared to the 1981 to 2010 reference period, spring and winter declines had increased over the course of the satellite record. From 1979 to 1999, wintertime sea ice loss averaged 2.4 percent per decade. After the year 2000, the rate accelerated to an average of 3.4 percent per decade. (The observed rates of sea ice decline in summer and autumn have also increased over time.) The study identified a robust link between Arctic sea ice extent and anthropogenic carbon dioxide emissions.
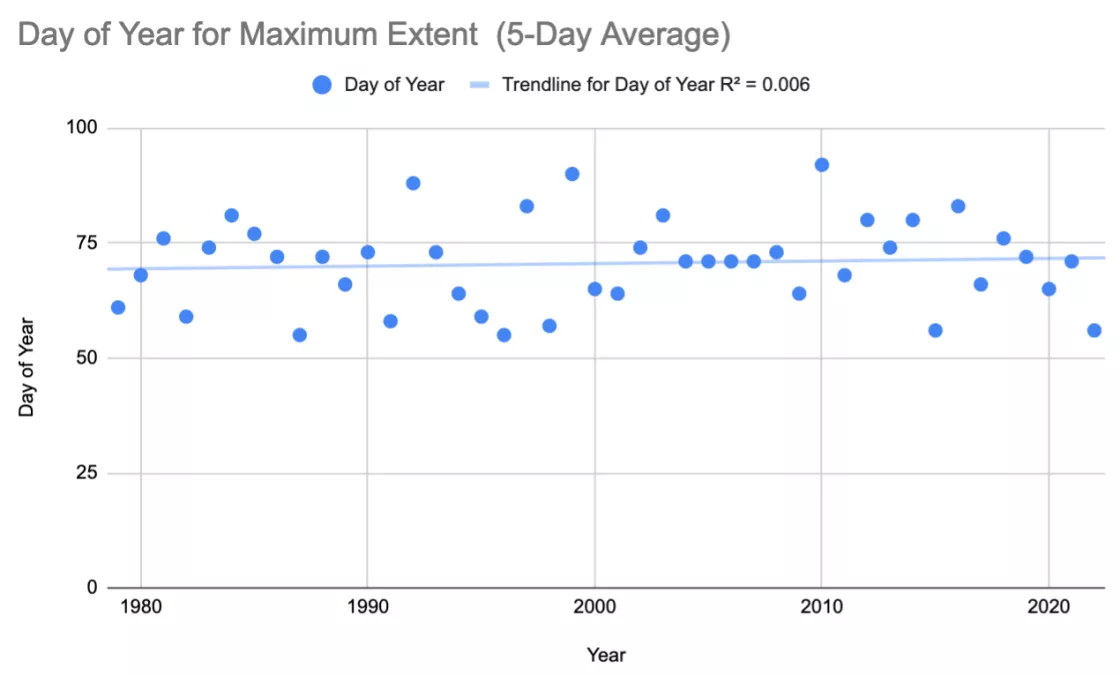
Has the maximum date shifted?
Given the long-term changes in wintertime extent, it is reasonable to wonder whether the timing of the maximum date has also changed. The satellite record shows that, from the winter of 1978-1979 through the winter of 2021-2022, Arctic sea ice reached its annual maximum extent between late February and early April. Arctic sea ice showed no significant trend toward an earlier or later maximum-extent date.
Future projections
A 2020 study on the possible transition to an ice-free Arctic projected Arctic sea ice behavior under low-emission and high-remission scenarios. (For scenarios, the study relied on Shared Socioeconomic Pathways, or SSPs. SSPs complement previously developed Representative Concentration Pathways, or RCPs. The Intergovernmental Panel on Climate Change (IPCC) also relied on SSPs in its Sixth Assessment Report.) The 2020 study concluded that, even under a low-emission scenario, Arctic sea ice is likely to melt away completely in September by the year 2100. Under the same scenario, however, Arctic sea ice would survive in the winter months. Under a high-emission scenario, sea ice may disappear from the Arctic in all months before the year 2100.
References
Årthun, M., I.H. Onarheim, J. Dörr, T. Eldevik. 2020. The seasonal and regional transition to an ice-free Arctic. Geophysical Research Letters, 48(1): e2020GL090825. https://doi.org/10.1029/2020GL090825.
Carbon Brief. 2018. Explainer: How ‘Shared Socioeconomic Pathways’ explore future climate change.
Intergovernmental Panel on Climate Change. 2021. Figure SPM.10 | Near-linear relationship between cumulative CO2 emissions and the increase in global surface temperature.
Strove, J., and D. Notz. 2018. Changing state of Arctic sea ice across all seasons. Environmental Research Letters, 13(10): 10300. https://doi.org/10.1088/1748-9326/aade56.


