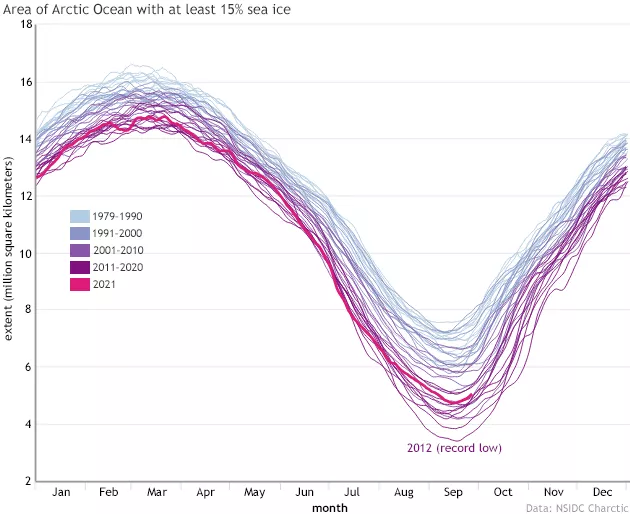
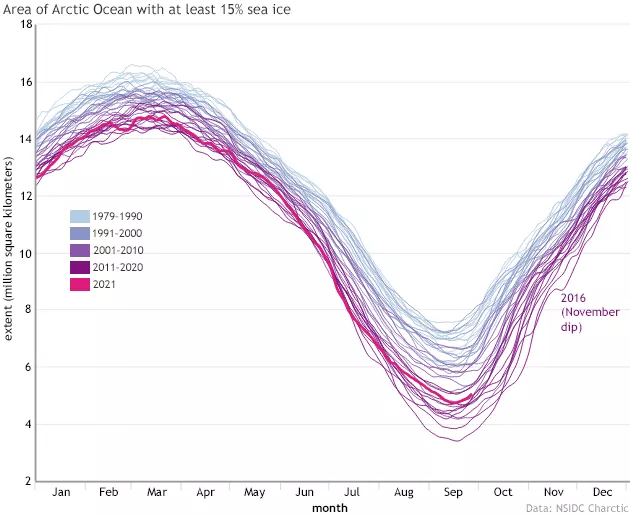
Over the course of the satellite record, Arctic sea ice extent has declined. Declines have been observed throughout the year, but they have been most pronounced at the time of the annual minimum each September. Lower sea ice minimums raise a question about what happens next, when the sea ice refreezes in autumn. Is the autumn freeze up also changing?
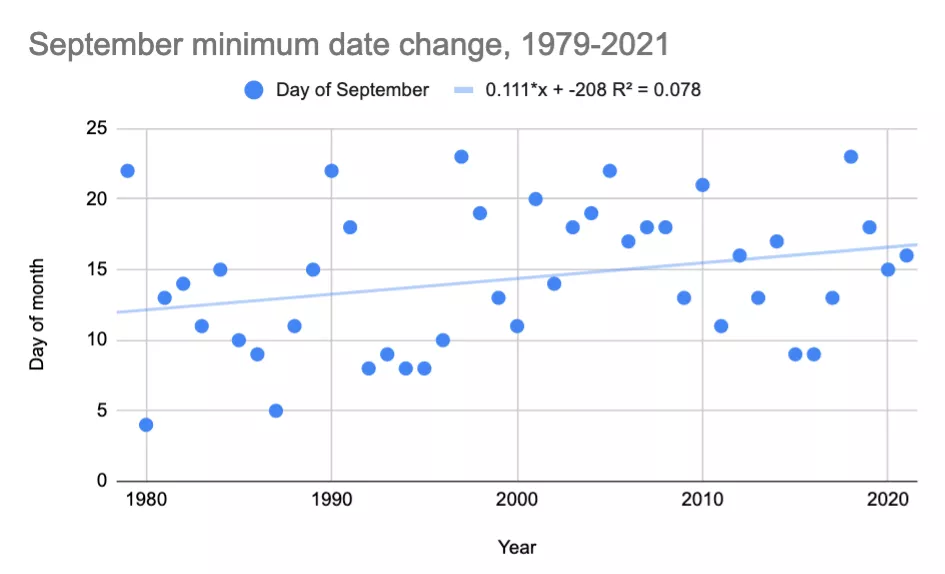
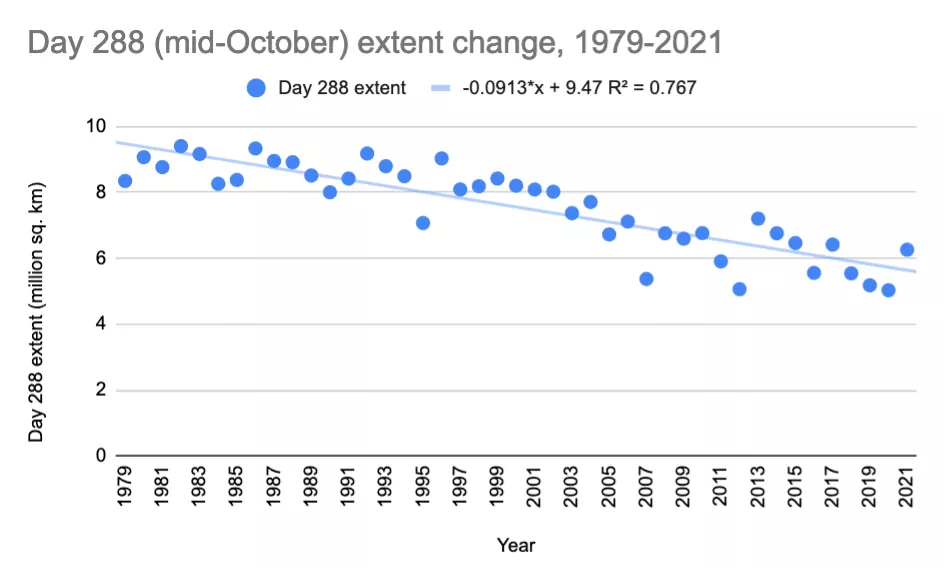
In short, yes. Although year-to-year variability is substantial, minimum dates observed over the satellite record suggest a very slight shift to later in the month. But a more significant trend occurs in the weeks following the minimum. Observations over the satellite record indicate a significant declining trend in autumn extent, particularly in October.
Mercury rising
In recent decades, the Arctic has gained heat as air, land, and ocean temperatures in the region have risen. Amid rising temperatures, scientists have noted dramatic reductions in summer sea ice extent over the course of the satellite record, which dates back to November 1978.
As summer minimum extents drop ever lower, more of the ocean surface is free of ice at the start of autumn. This means that, to replace the greater amount of ice lost during spring and summer melt, more ice must form in fall and winter.
Later minimum date: A tiny trend with a lot of noise
NSIDC scientists have observed that Arctic sea ice generally melts to its minimum annual extent between the first and third week of September. After that, ice begins freezing again.
Walt Meier, a research scientist at NSIDC, said, “Overall, one would expect to get later minimums because with more open water during summer, more heat is absorbed by the ocean, and that heat has to be dissipated before freezing can begin.” Because ocean water is salty, its temperature has to sink a little lower than the freezing point of fresh water before sea ice can form, adding to the amount of heat that must dissipate before refreezing.
It stands to reason that, if the Arctic Ocean routinely absorbs more heat each summer, the ocean should routinely take longer to cool off and start freezing each fall. This should steadily nudge the minimum date later. But is that necessarily the case?
September minimum dates over the satellite record
Although the Arctic sea ice minimum extent often occurs in mid-September, a look at the entire satellite record shows minimum dates splattered over most of the month.
Meier said, “There is a general shift toward a later minimum of about two days per decade.” But, he noted, there is a catch. “The record is pretty noisy—a lot of ups and downs from year to year—so it’s really not very significant.”
Tricky timing
To someone unfamiliar with the ups and downs of sea ice, the fact that the sea ice minimum can happen throughout most of September may be less surprising than the fact that the sea ice minimum happens in September. Why not in June, July, or August—closer to the height of summer—rather than later in the year?
Part of the answer involves the ocean’s heat capacity. Heat capacity is defined as the amount of heat that something must absorb before actually heating up. Water has a higher heat capacity than air. It takes longer to heat up and to cool down. For a simple analogy, imagine boiling a pot of water. Once the burner is turned on, the air over the burner warms quickly but the water changes temperature relatively slowly. Once the burner is turned off, the air overhead cools quickly while the water cools more slowly.
The world’s ocean has a much higher heat capacity than the atmosphere. Whereas air temperatures can vary by tens of degrees in a single 24-hour period, ocean temperatures in the same place may change less than a single degree. As the seasons change, the ocean lags behind the atmosphere both in heating up and cooling down. This means that hurricanes can rage over the Gulf Coast long after sweater weather has started. It also means that, in the Arctic, trapped heat may delay sea ice formation even after the brief Arctic summer has waned.
Another part of the answer is the fact that the Sun’s energy accumulates in the Earth’s atmosphere and ocean over time. Even though the summer solstice is the longest day of the year, energy continues to accumulate beyond that date.
Heat capacity and accumulation of sunlight are crucial factors in sea ice’s minimum-date equation, but they are not the only ones. Other factors complicate the outcome.
Weather woes
The Arctic environment is complex, and heat is only one of the factors affecting annual freeze up. “The minimum’s high variability is influenced by the weather,” Meier said. “If a cold front or a warm front moves through a key location near the minimum date, strong winds may push the ice edge in or out.”
Timing is crucial. At the end of summer as ocean waters cool, winds that push the ice edge outward increase the minimum extent. Winds that push the ice edge inward decrease the minimum extent. In early summer or midsummer, however, the same wind patterns can have different effects. Winds that blow sea ice floes outward and further south may scatter the ice into warmer ocean waters where it melts.
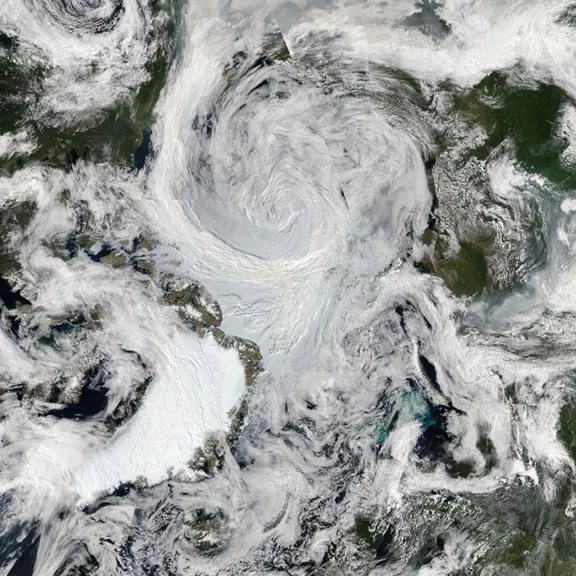
Strong storms can make the ocean choppy, break up existing ice packs, and churn warmer waters up to the surface. This turbulence, especially arriving when sea ice is already extremely thin and sparse, does not bode well for a strong ice pack going into the fall freeze up. In fact, a storm in August 2012 dislodged a large expanse of sea ice, making the remaining ice pack more vulnerable to the storm’s fury and to subsequent melting at the end of summer. In September 2012, Arctic sea ice reached its lowest extent in the satellite record, plunging to 3.39 million square kilometers (1.31 million square miles).
Storms like this illustrate how factors such as day-to-day weather still play a large role in determining when sea ice freezes up each year. “At the minimum, you’re kind of on the knife edge of freezing versus melting. Depending on the weather, you can tip either way—and back and forth—in any location at a particular moment,” Meier said.
Less autumn ice: A more significant trend
The small shift in the September date when Arctic sea ice bottoms out may matter less than what happens afterwards.
After reaching its annual minimum, Arctic sea ice begins refreezing. If the ice has shrunk to a particularly small extent, it has more ground (ocean, actually) to cover, to come back to anything like average wintertime conditions. As mentioned above, sea ice cannot begin reforming until the Arctic Ocean has released all the excess heat it soaked up when the Sun was high in the summertime sky. The more oceans warm, the longer they will take to cool down and begin ice formation. Meier said, “Where the excess heat absorbed really takes effect is in October, and even into November, when the Sun has set over much of the Arctic, and the atmosphere is cooling.”
Declining trends in average sea ice extent in October and November indicate that, weeks after sea ice has begun refreezing, it is poorly positioned to grow back to the long-term average extent in winter.
That time November got weird
Once fall freeze-up begins, even coming back from a low September minimum, ice usually grows rapidly. Storms and temperature swings may drop sea ice extent for a day or two during the autumn, but several days of ice retreat are rare. In November 2016, however, Arctic sea ice retreated for several days.
Typical for that time of year, sea ice grew rapidly in the Arctic for part of November 2016, but then retreated for five straight days, losing a total of roughly 50,000 square kilometers (19,000 square miles). Daily dips during the growing season can happen, and Arctic sea ice lost roughly 14,000 square kilometers (5,400 square miles) over two consecutive days in the autumn of 2013. But the November 2016 retreat was more substantial.
The November 2016 sea ice loss coincided with Arctic warmth: air temperatures of approximately 17°C to 20°C (30°F to 35°F) above average. The unusual warmth was widespread, covering an area about the same size as the contiguous United States.
All the year round
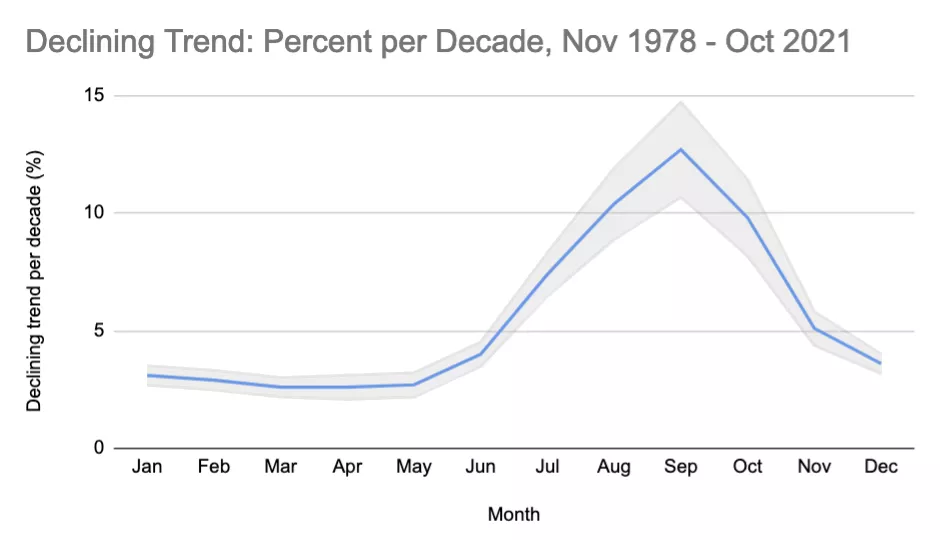
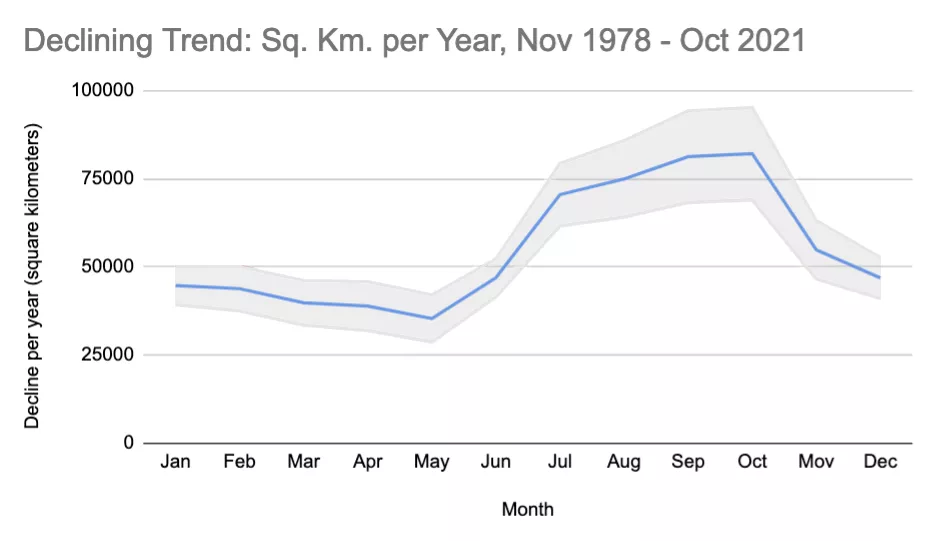
Arctic sea ice has declined in all months since the start of the satellite record, but the declines have been more pronounced in some months than in others. From November 1978 through October 2021, the smallest percentage declines occurred in the Northern Hemisphere winter and early spring. The greatest percentage declines occurred in September and August, but October was a close third. In terms of absolute area lost, October edged out September.
Though there appears to be a downward trend in the Arctic sea ice minimum, the more substantial downward trend involves sea ice extent after the Sun sinks below the Arctic horizon. Just as sea ice minimum extents have typically fallen below the 1981-to-2010 average, lower Arctic sea ice extent in autumn appears to be the new normal, at least for now.
