By Michon Scott
With satellite observations of sea ice extent stretching back to November 1978, NSIDC scientists can draw from more than 40 years of data to determine when an extent is above or below average or when it reaches a record high or low.
To identify what is typical for any time of year, NSIDC currently uses the middle value from the 1981 to 2010 baseline, and brackets that value with larger ranges: the middle 50 percent of the observed extents from the baseline period, and the middle 80 percent of the baseline extents. When sea ice extent falls below these larger ranges, it indicates that the extent is unusually low.
Average alone says only so much
Imagine a set of numbers: 1, 2, 3, 4, 5, 6, 7, 8, and 9. The sum of all these numbers divided by how many numbers there are gives an average (mean) value of 5. The middle value (median) for these numbers is also 5.
But 5 could also be the average, middle, and most common (mode) of a string of 5s or a different set of numbers: 3, 4, 5, 5, 5, 5, 5, 6, and 7. The second set of numbers is more tightly clustered than the first, excluding the values of 1, 2, 8, and 9.
So, 5 alone gives limited information about what is “average” and how far away from the average a value must be to qualify as unusual. To be clearer about the distribution of values in a data set, scientists and statisticians can use additional techniques.
Standard deviation's strengths and limitations
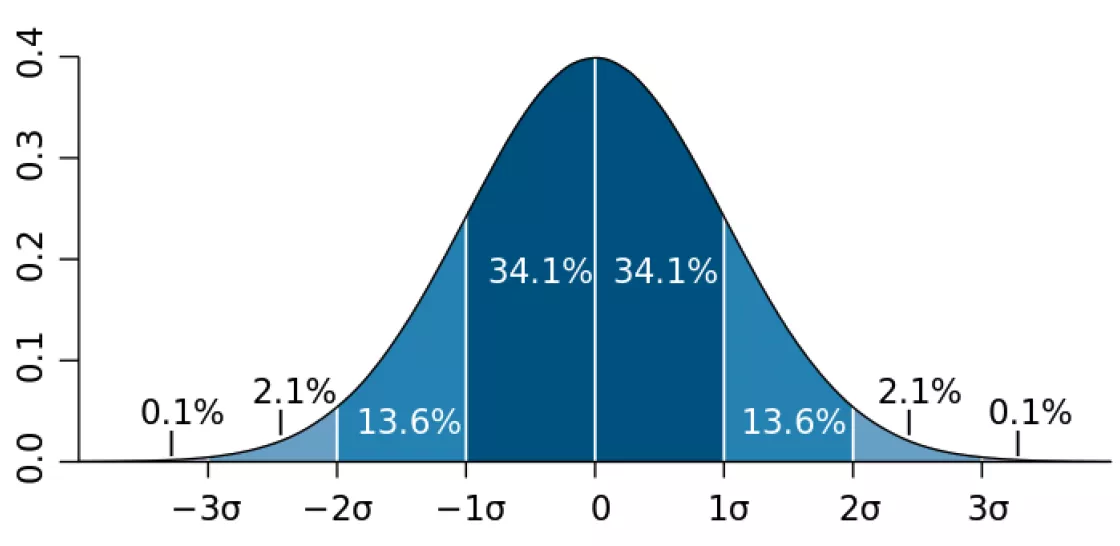
Using standard deviation, scientists can describe a “range around the average”—a wider set of values around an average—that might still be considered typical. When analyzing sea ice extent, standard deviation gives clues about whether an observed extent falls within the typical range of variability. Standard deviation is extremely well suited to what statisticians refer to at a “normal distribution,” generally represented by a perfect bell curve.
A perfect bell curve can occur in, for example, a distribution of test scores in a large college class. But suppose the class size is smaller and suppose one student in that class habitually fails the exams—by a lot. While class scores consistently fall between 60 percent and 100 percent for the rest of the class, the student who never scores above 40 percent drags down the average score. In such a case, a middle value may be a “fairer” measure of how the class is doing.
In representing sea ice extent values, NSIDC is not relaying a class’s test scores but instead extent values over a decades-long stretch of time. As Arctic sea ice has declined over time, values later in the series, such as the then-record low of 2007, dragged average value downwards for the 1981 to 2010 baseline. The result was not a perfect bell curve centered nicely around an average. In other words, standard deviation did not accurately represent the range around the average for Arctic sea ice extent over the baseline period. So, NSIDC adopted a different approach.
Interquartiles and interdeciles
Starting in 2017, NSIDC began using a middle value flanked by larger ranges to assess sea ice extent.
Taking the entire distribution of data values and dividing those values into four equal groups produces quartiles. The innermost quartiles—the interquartiles—span half the range of baseline values, centered around the median. Dividing the entire distribution into 10 equal groups produces deciles. The innermost deciles—the interdeciles—span eight-tenths of the range of baseline values, centered around the median—a broader range of values than interquartiles.
To assess sea ice extent for any calendar date, NSIDC uses the following measurements for the 30-year baseline, for any given calendar day:
- The median falls in the middle of the observed extents for the baseline period. Half of the observed extents are above the median, and half of the observed extents are below it. This does not suggest, however, that the above- and below-median extents are equally distributed. The below-median extents may be farther from the median than the above-median extents.
- The interquartile range includes two of the four quartiles around the median, i.e., extents greater than 25 percent and less than 75 percent of all the observed extents.
- The interdecile range includes eight of the 10 deciles in the entire range of values, i.e., all observed sea ice extents greater than 10 percent and less than 90 percent.
How interquartiles and interdeciles compare to standard deviation
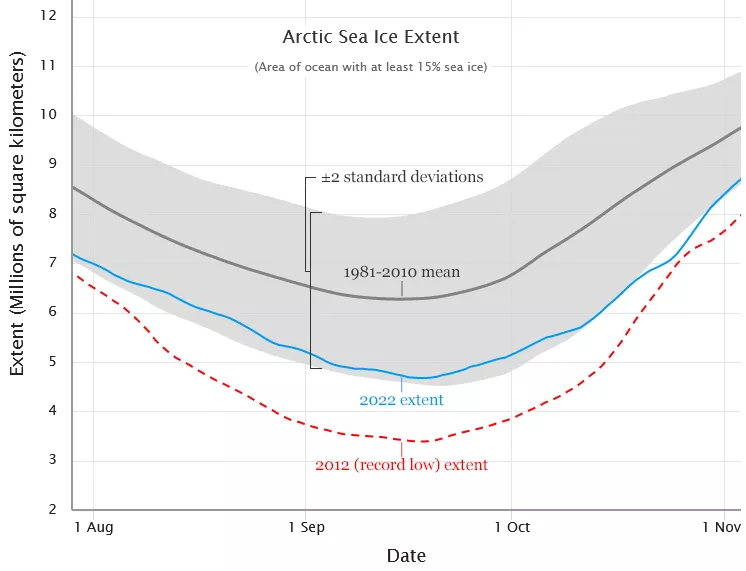
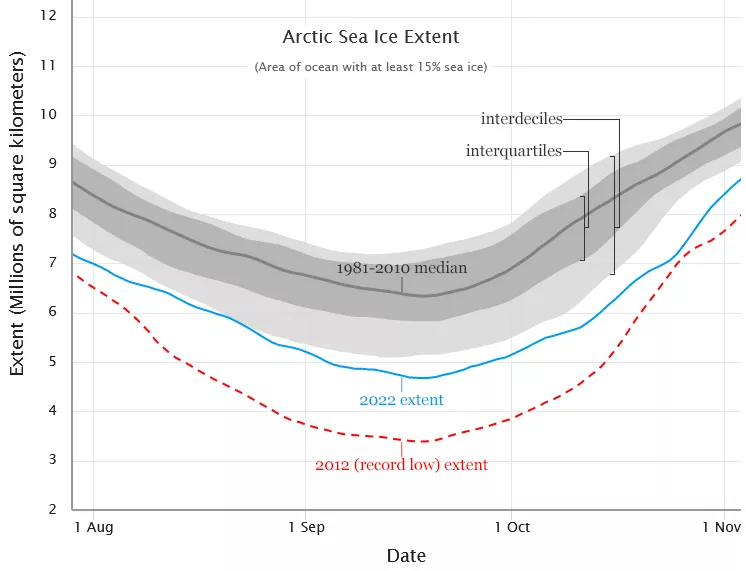
The following screenshots compare the same time of year, late July through early November, from NSIDC’s interactive Charctic visualization tool. Both examples use the 1981-to-2010 baseline for comparison, but the first example uses the average (mean) bracketed by two standard deviations while the second example uses the middle (median) bracketed by interquartiles and interdeciles.
Assuming a perfect bell curve, the mean and standard deviation approach places the average extent line exactly in the center of the standard deviations, and those deviations span a broad swath of possible extents. In fact, the 2022 extent line overlaps the standard deviation for much of the period shown.
In contrast, the median, interquartile, and interdecile approach does not place the middle extent exactly in the center of the innermost 50 and 80 percentages. Instead, the values below the median are farther away than the values above it. This approach better represents a lopsided distribution. Furthermore, the innermost 50 percent and 80 percent of the observed baseline extents are more tightly clustered around the median, so the 2022 extent only grazes the bottom range of the interdecile for a brief period.
Although NSIDC’s Charctic visualization tool defaults to using the median, interquartile, and interdecile, you can change the display to show the average (mean) and standard deviation if you prefer.
So, when was sea ice really low?
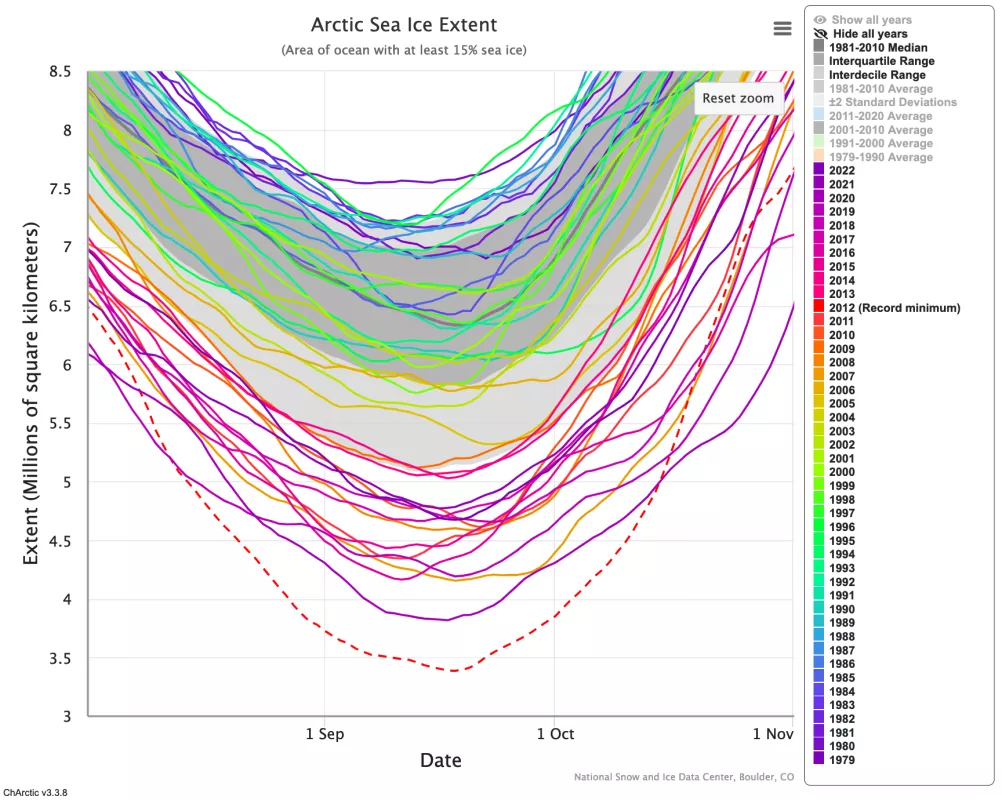
As of November 2022, the lowest Arctic sea ice extent in the satellite record occurred at the time of the summer minimum in September 2012. But by November 2022, Arctic sea ice had experienced 15 summer minimum extents below the bottom 1981 to 2010 decile.
Unusually low sea ice extents on the satellite record can occur at any time of year, compared to the 30-year baseline. For instance, significantly low Arctic sea ice extents occurred in November 2016, and again in November 2020, the time of year when sea ice is usually growing rapidly.
Antarctic sea ice has also fallen below the bottom decile of the 30-year baseline period—multiple times. But unlike Arctic sea ice, Antarctic sea ice has not shown a significant declining trend. For multiple reasons, Antarctic sea ice appears dominated by extreme year-to-year variability.


