MEaSUREs Greenland 6 and 12 day Ice Sheet Velocity Mosaics from SAR, Version 1
Data set id:
NSIDC-0766
DOI: 10.5067/6JKYGMOZQFYJ
There is a more recent version of these data.
Version Summary
Version Summary
Initial release
Overview
This data set contains 6 and 12 day surface velocity estimates for the Greenland Ice Sheet and periphery derived from images acquired between 2015–2021 by the European Space Agency (ESA) Copernicus Sentinel-1A and Sentinel-1B satellites.
Parameter(s):
ICE VELOCITY
Platform(s):
Sentinel-1A
Sentinel-1B
Sensor(s):
C-SAR
Data Format(s):
GeoTIFF
JPEG
Shapefile
Temporal Coverage:
- 1 January 2015 to 3 February 2021
Temporal Resolution:
- 6 days to 12 days
Spatial Resolution:
- 200 m
- 200 m
Spatial Reference System(s):
- WGS 84 / NSIDC Sea Ice Polar Stereographic NorthEPSG:3413
Spatial Coverage:
- N:83S:60E:-14W:-75
Blue outlined yellow areas on the map below indicate the spatial coverage for this data set.
Data Access & Tools
A free NASA Earthdata Login account is required to access these data. Learn More
Sample Data Image
Image

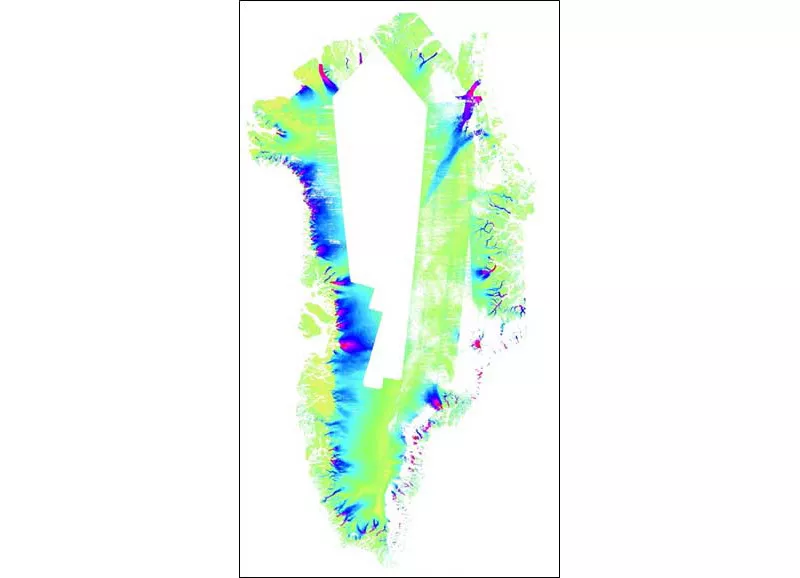
This color-coded map shows a six-day ice velocity mosaic for the Greenland Ice Sheet. Highest velocities appear in magenta and red, intermediate velocities appear in blue and green, and lowest velocities appear in yellow and peach. White patches indicate no data. Credit: NASA MEaSUREs GrIMP Data: ESA
Documentation
Help Articles
General Questions & FAQs
This article covers frequently asked questions about the NASA NSIDC DAAC's Earthdata cloud migration project and what it means to data users.
How to Articles
This article shows how to download NSIDC DAAC data from NASA Earthdata Cloud to your computer using three tools: wget and curl—popular command-line utilities for downloading files—and Data Downloader, a Python-based command-line tool developed by the Physical Oceanography Distributed Active Archi
The NASA Earthdata Cloud is the NASA cloud-based archive of Earth observations. It is hosted by Amazon Web Services (AWS). Learn how to find and access NSIDC DAAC data directly in the cloud.