MEaSUREs Greenland Quarterly Ice Sheet Velocity Mosaics from SAR and Landsat, Version 3
Data set id:
NSIDC-0727
DOI: 10.5067/7D8Z6UMS8AD4
There is a more recent version of these data.
Version Summary
Version Summary
Version updates include:
Reprocessed with a corrected DEM
Cloud optimized GeoTIFFs created with GDAL 3.2.1
Reprocessed with a corrected DEM
Cloud optimized GeoTIFFs created with GDAL 3.2.1
Overview
This data set, part of the NASA Making Earth System Data Records for Use in Research Environments (MEaSUREs) Program, contains quarterly (three-month interval) ice velocity mosaics for the Greenland Ice Sheet. This product is derived from Synthetic Aperture Radar (SAR) data obtained by the German Aerospace Center's (DLR) TerraSAR-X/TanDEM-X (TSX/TDX), by the European Space Agency's (ESA) Copernicus Sentinel-1A and -1B satellites, and from the US Geological Survey's (USGS) Landsat 8 optical imagery.
See Greenland Ice Mapping Project (GIMP) for related data.
Parameter(s):
ICE VELOCITY
Platform(s):
LANDSAT-8
Sentinel-1A
Sentinel-1B
TDX
TSX
Sensor(s):
C-SAR
OLI
X-SAR
Data Format(s):
GeoTIFF
JPEG
Shapefile
Temporal Coverage:
- 1 December 2014 to 23 August 2022
Temporal Resolution:
- 3 month
Spatial Resolution:
- 200 m
- 200 m
Spatial Reference System(s):
- WGS 84 / NSIDC Sea Ice Polar Stereographic NorthEPSG:3413
- WGS 84EPSG:4326
Spatial Coverage:
- N:83S:60E:-14W:-75
Blue outlined yellow areas on the map below indicate the spatial coverage for this data set.
Data Access & Tools
Sample Data Image
Image

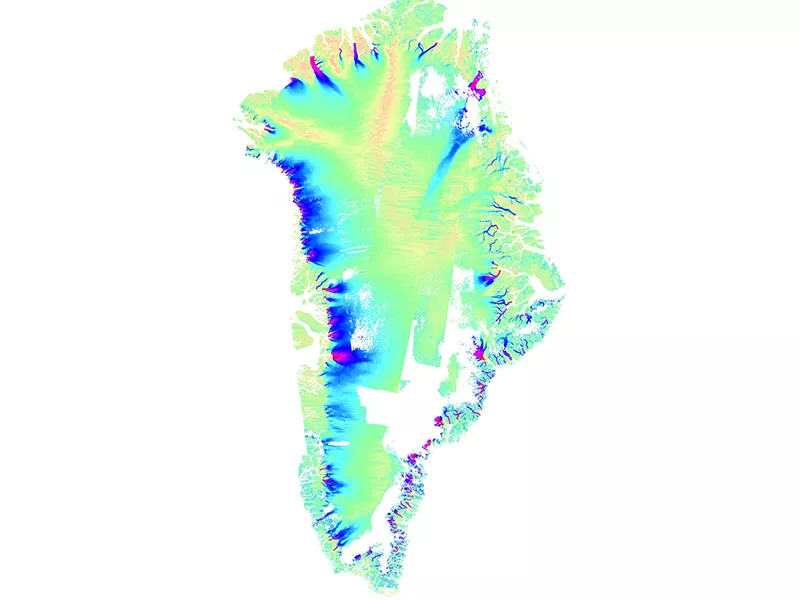
This color-coded map shows a quarterly ice velocity mosaic for the Greenland Ice Sheet. Highest velocities appear in magenta and red, intermediate velocities appear in blue and green, and lowest velocities appear in yellow and peach. White patches indicate no data. Credit: NASA MEaSUREs GrIMP Data: DLR, ESA, USGS
Documentation
Help Articles
General Questions & FAQs
This article covers frequently asked questions about the NASA NSIDC DAAC's Earthdata cloud migration project and what it means to data users.
The NASA National Snow and Ice Data Center Distributed Active Archive Center (NSIDC DAAC) is migrating its primary data access from its legacy, on-premises archive to the NASA Earthdata Cloud.
How to Articles
This article shows how to download NSIDC DAAC data from NASA Earthdata Cloud to your computer using three tools: wget and curl—popular command-line utilities for downloading files—and Data Downloader, a Python-based command-line tool developed by the Physical Oceanography Distributed Active Archi
Below the image in this article, you will find sample code in IDL, MATLAB, and Python to read in a GeoTIFF file, extract the metadata, and create an image.
The code has been tested with the following data products:
We recommend using the Geospatial Data Abstraction Library (GDAL) to convert GeoTIFF files into a different format.
We recommend using the Geospatial Data Abstraction Library (GDAL) or a GIS to reproject geoTIFF files.
There are external Jupyter notebooks available that can be used to search for GrIMP products and incorporate them into a new QGIS project:
There are external Jupyter notebooks available that can be used to download user-defined spatial subsets of the following MEaSUREs GrIMP products:
The NASA Earthdata Cloud is the NASA cloud-based archive of Earth observations. It is hosted by Amazon Web Services (AWS). Learn how to find and access NSIDC DAAC data directly in the cloud.