MASIE-NH Daily Image Viewer
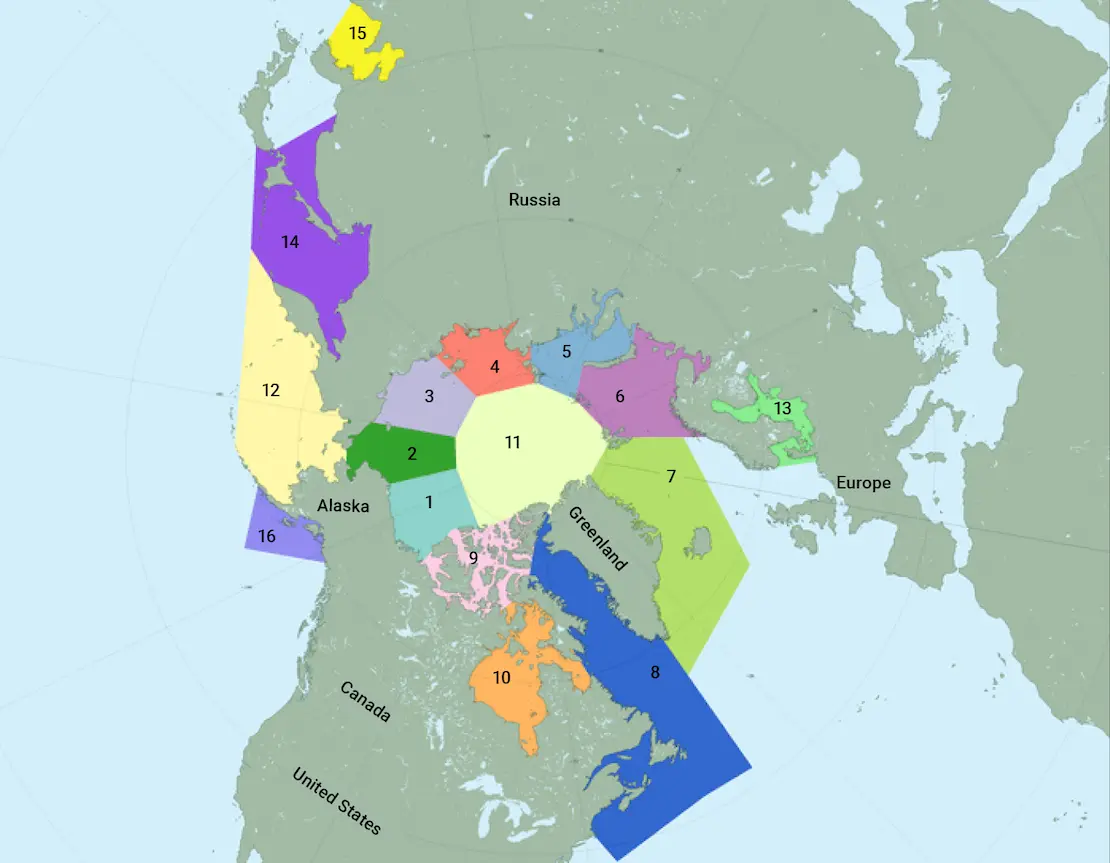
Explore by Region
Explore the MASIE-NH Daily Image Viewer to see daily images of the most recent ice extent by region. You can also view a time series plot of the selected region that shows sea ice extent over the last four weeks for this year compared to the last four weeks of the previous four years, as well as various data download options.
Click a region of the map to the see ice extent and time series plot
Select your region of interest on the map below to view the most recent ice extent for that region and comparison of sea ice extent over the last four weeks for this year compared to the last four weeks of the previous four years.


Data is obtained nightly and comes from the most recent full day of data from the U.S. National Ice Center (USNIC). As is the rule with operational centers, gaps in production can occur without warning. MASIE (may-zee) is produced in cooperation with the U.S. National Ice Center (USNIC).