After reaching the minimum on September 18, Arctic sea ice extent has been steadily increasing. With the passage of the equinox, the sun has set at the North Pole. September average ice extent ended up tying with 2010 for eleventh lowest in the satellite record.
Overview of conditions
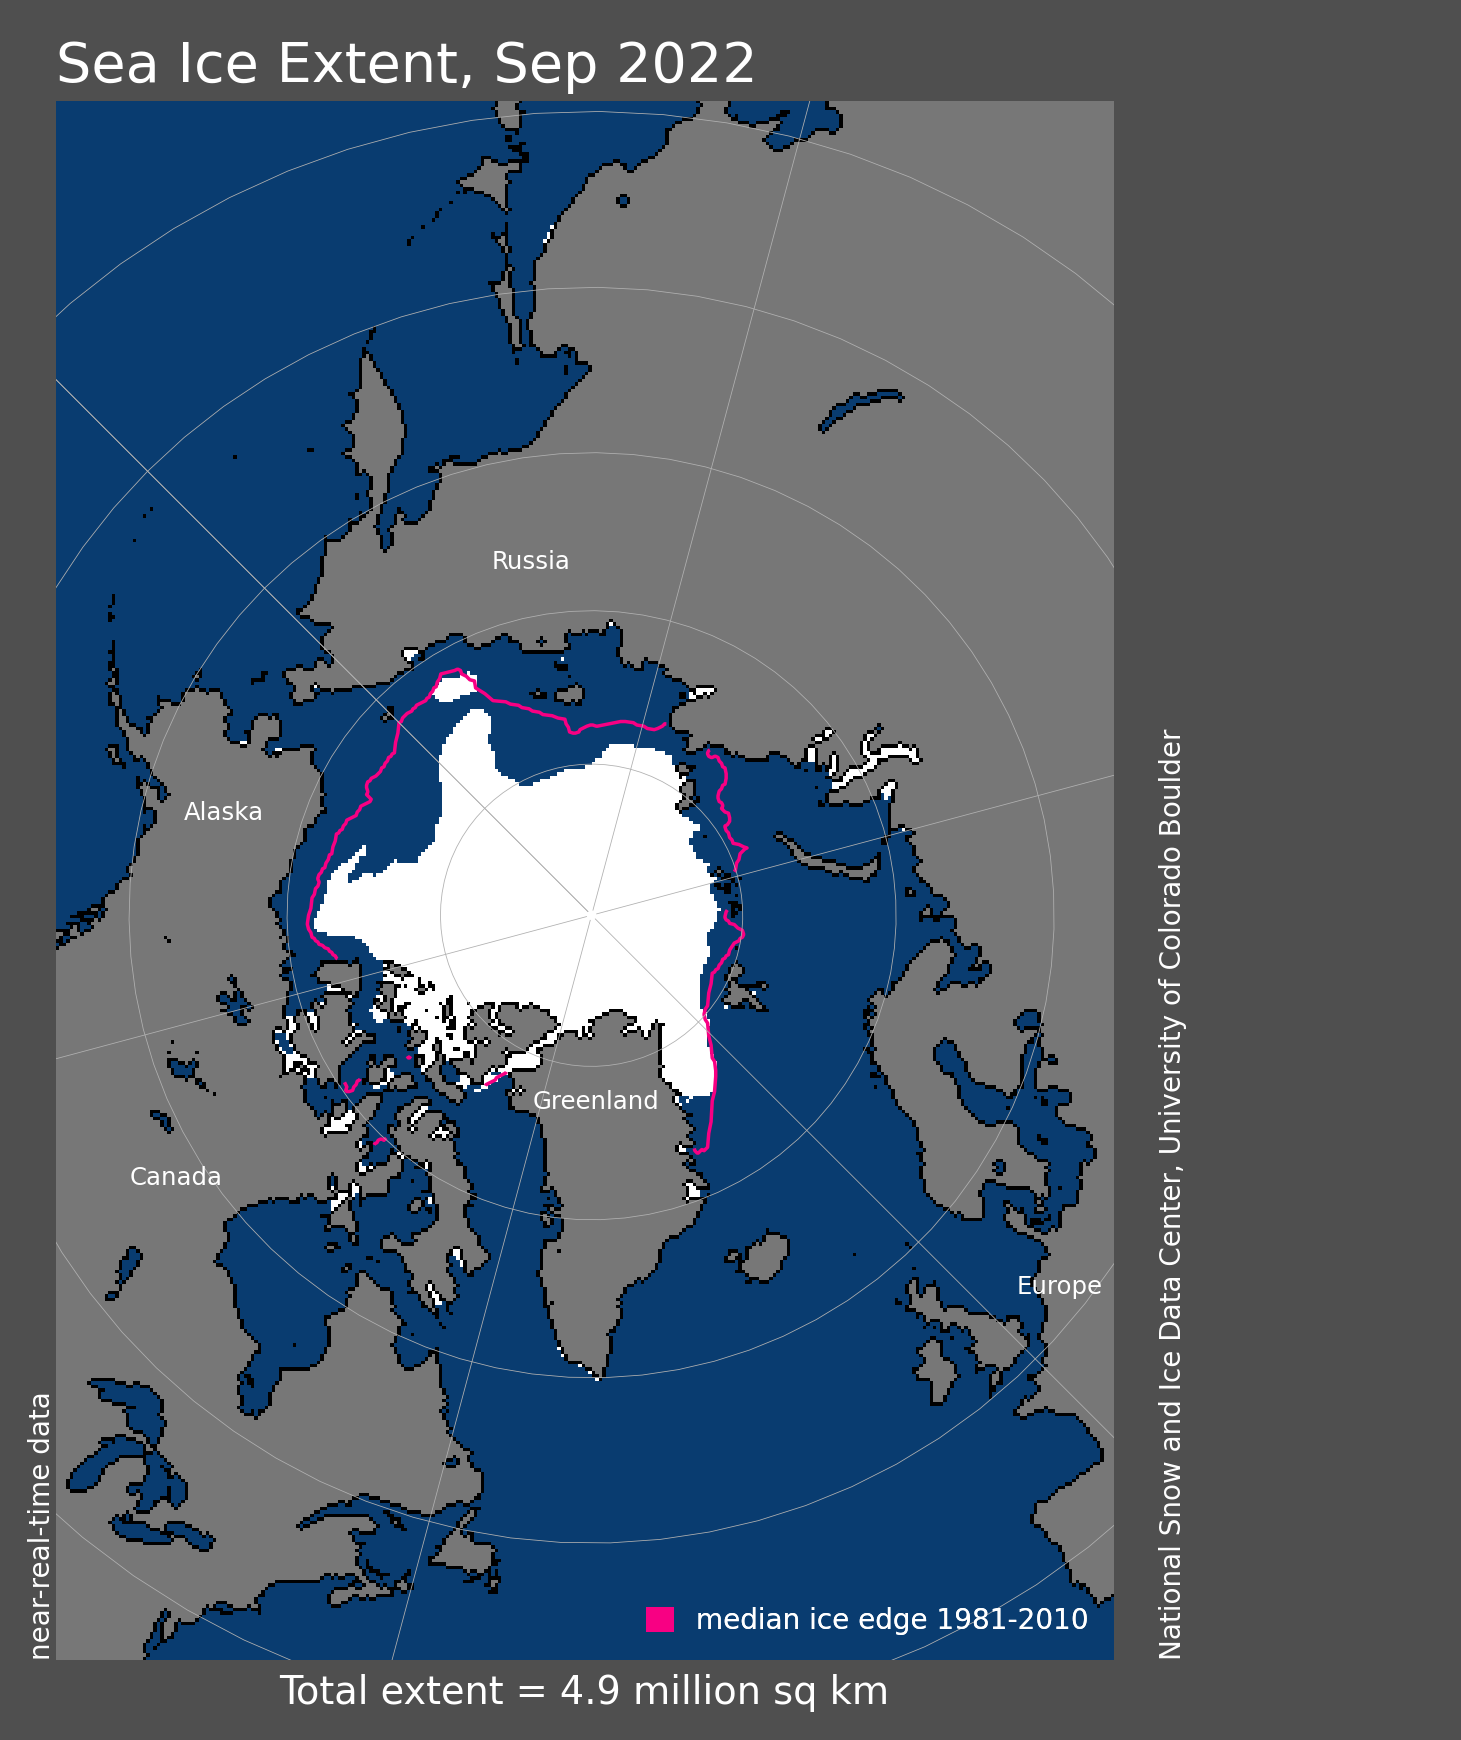
Figure 1a. Arctic sea ice extent for September 2022 was 4.87 million square kilometers (1.88 million square miles). The magenta line shows the 1981 to 2010 average extent for that month. Sea Ice Index data. About the data
Credit: National Snow and Ice Data Center
High-resolution image
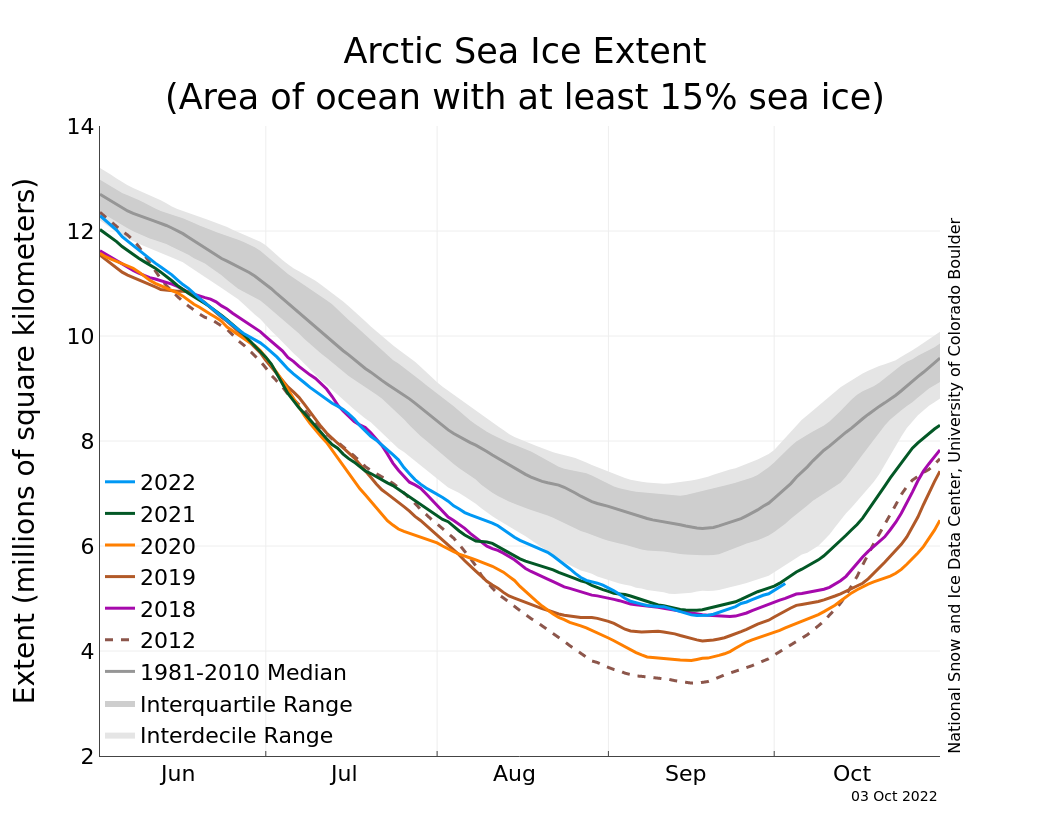
Figure 1b. The graph above shows Arctic sea ice extent as of October 3, 2022, along with daily ice extent data for four previous years and the record low year. 2022 is shown in blue, 2021 in green, 2020 in orange, 2019 in brown, 2018 in magenta, and 2012 in dashed brown. The 1981 to 2010 median is in dark gray. The gray areas around the median line show the interquartile and interdecile ranges of the data. Sea Ice Index data.
Credit: National Snow and Ice Data Center
High-resolution image
The September 2022 average Arctic sea ice extent was 4.87 million square kilometers (1.88 million square miles), tying with 2010 for eleventh lowest in the satellite record (Figure 1a). Extent was 1.54 million square kilometers (595,000 square miles) below the 1981 to 2010 average and 1.30 million square kilometers (502,000 square miles) above the record minimum set in 2012. The annual minimum extent was reached on September 18 and the autumn freeze-up is now well underway.
Ice extent declined at a faster than average rate from the beginning of the month until the minimum was reached on September 18 (Figure 1b). This resulted in a tie for the tenth lowest minimum daily extent in the satellite record. Extent was below average in all sectors of the Arctic Ocean, apart from the northern shore of the Canadian Arctic Archipelago, where ice is almost invariably pushed up against the coast by winds and ocean currents. A tongue of ice continued to extend southward in the East Siberian Sea, and a portion of ice floes broke away from the main pack ice off the tip of that tongue. An open water passage has nevertheless persisted along the Northern Sea Route. The Northwest Passage has started to freeze up, particularly the northern route through Parry Channel, but much of the Canadian Archipelago remained essentially ice free through the end of the month.
Conditions in context
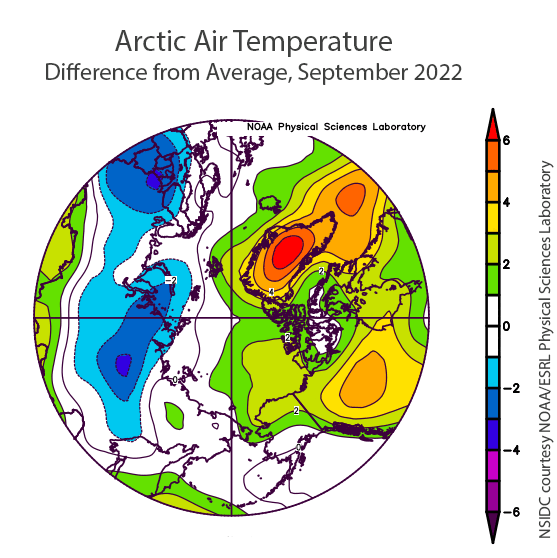
Figure 2a. This plot shows the departure from average air temperature in the Arctic at the 925 hPa level, in degrees Celsius, for September 2022. Yellows and reds indicate higher than average temperatures; blues and purples indicate lower than average temperatures.
Credit: NSIDC courtesy NOAA Earth System Research Laboratory Physical Sciences Laboratory
High-resolution image
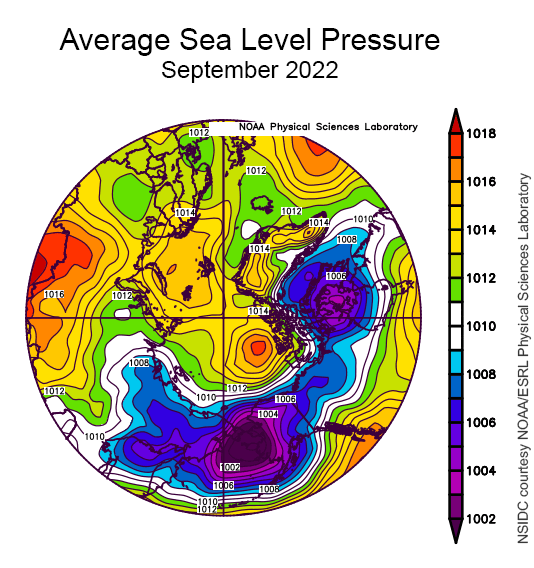
Figure 2b. This plot shows average sea level pressure in the Arctic in millibars for September 2022. Yellows and reds indicate high air pressure; blues and purples indicate low pressure.
Credit: NSIDC courtesy NOAA Earth System Research Laboratory Physical Sciences Laboratory
High-resolution image
Air temperatures during September at the 925 millibar level (approximately 2,500 feet above the surface) were above average over the North American side of the Arctic and near average or below average over most of the Eurasian side (Figure 2a). Averaged sea level pressure for September featured low pressure extending across Eurasia, Alaska, and the Canadian Arctic Archipelago, with high pressure over the central Arctic Ocean, notably north of the Canadian Arctic Archipelago (Figure 2b). The low pressure over Alaska reflects the passage of an extremely strong storm during the middle of the month that caused extensive damage and flooding to the town of Nome and surrounding areas.
September 2022 compared to previous years
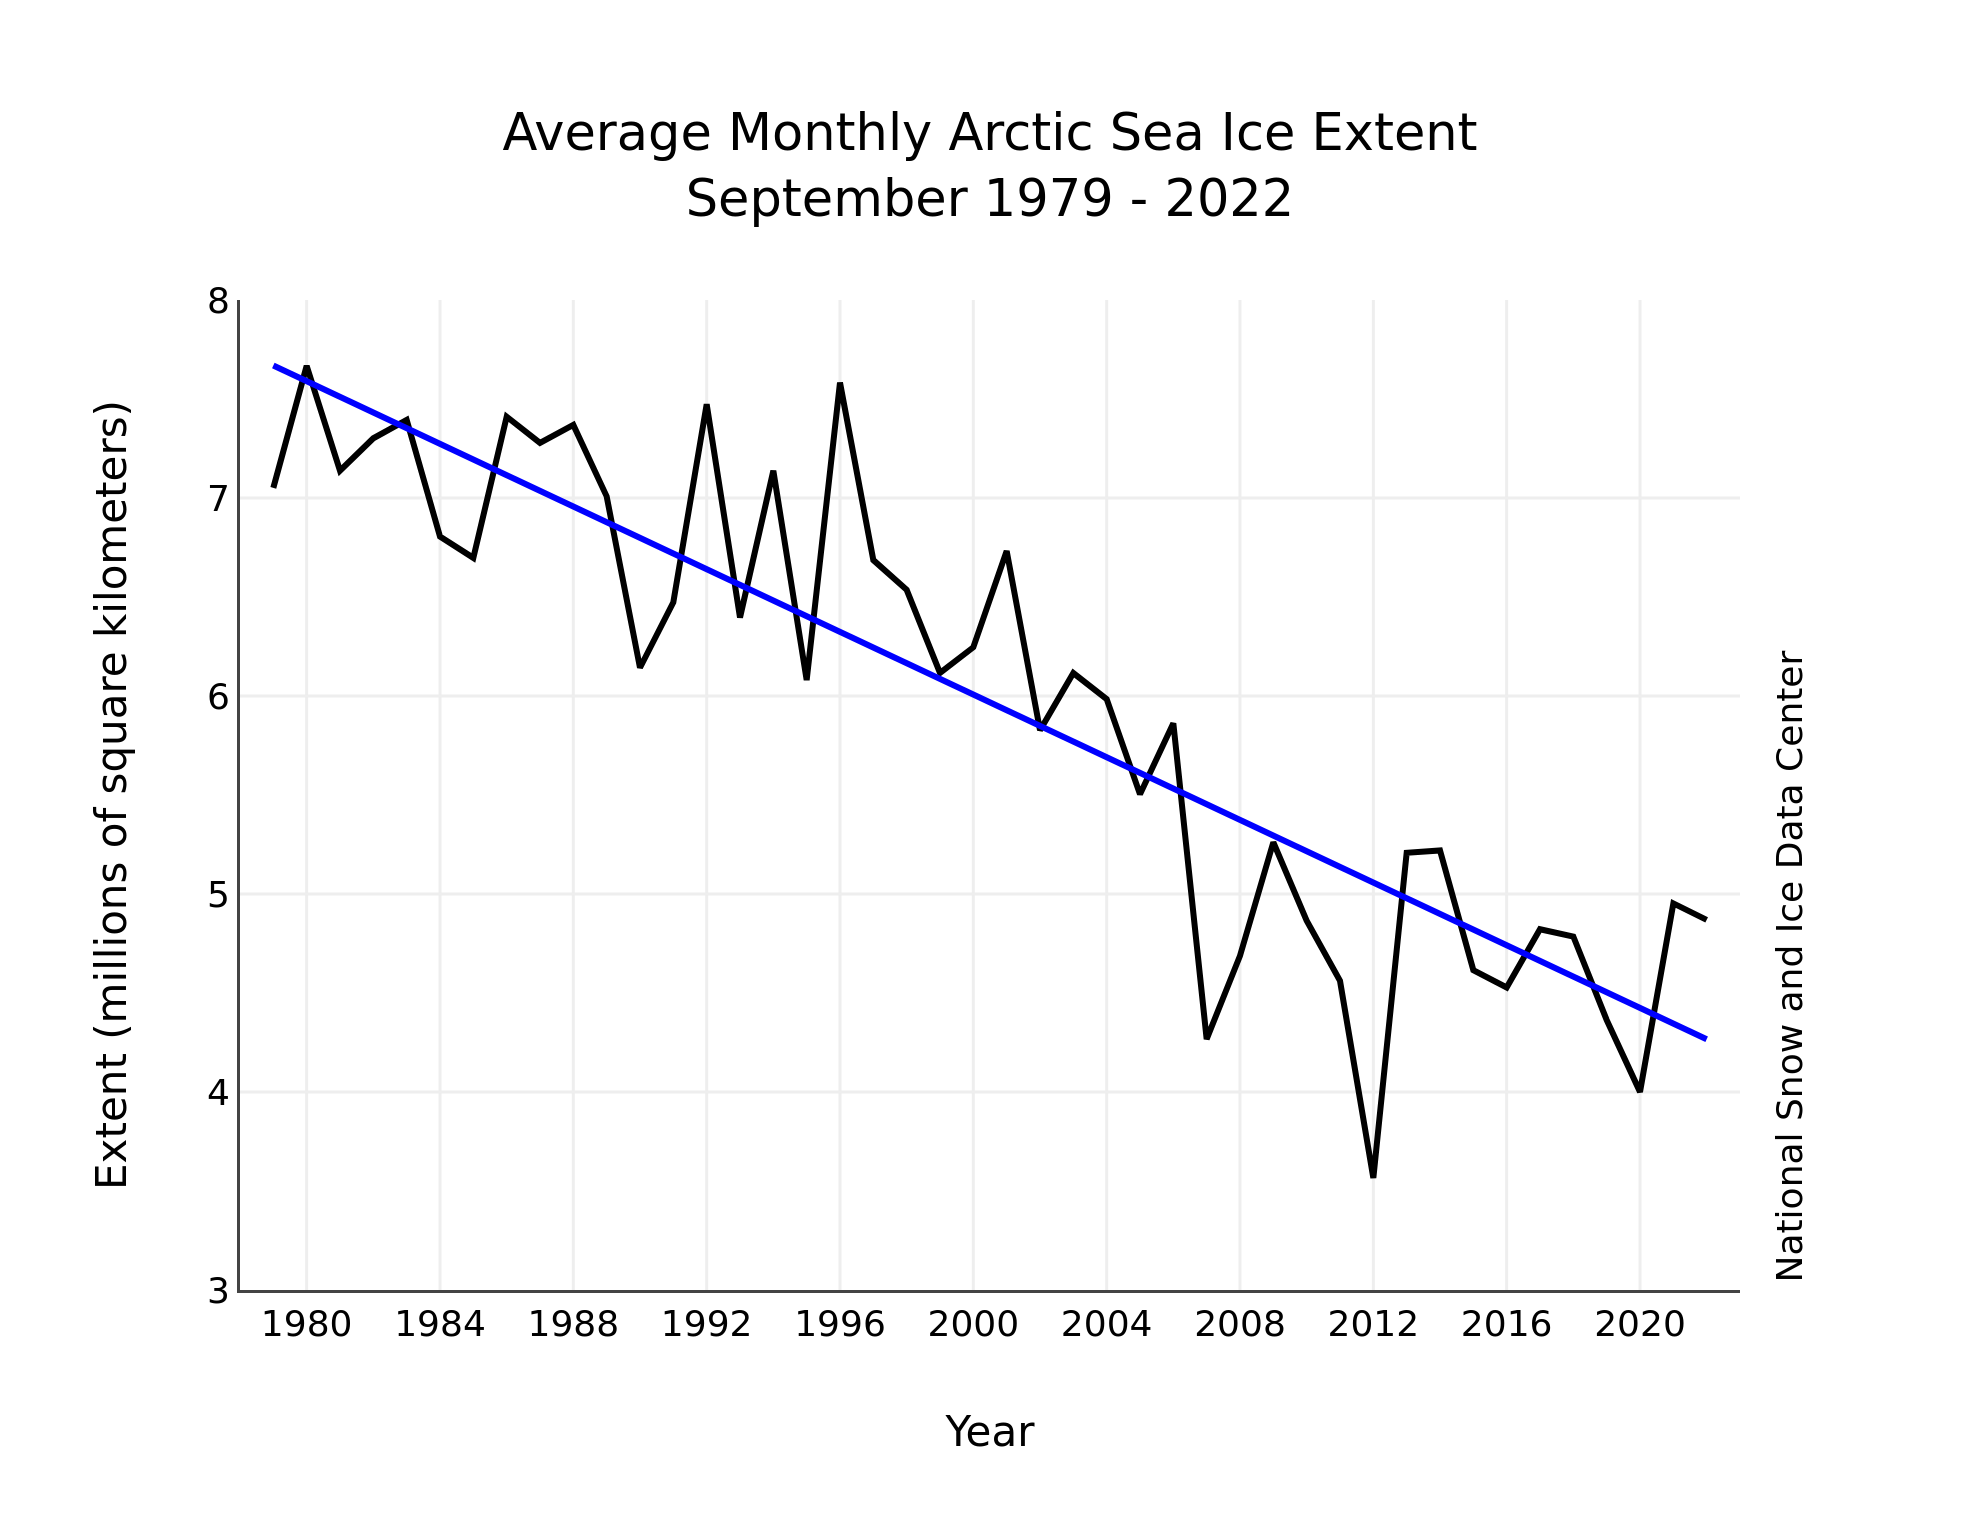
Figure 3. Monthly September ice extent for 1979 to 2022 shows a decline of 12.3 percent per decade.
Credit: National Snow and Ice Data Center
High-resolution image
The downward linear trend in September sea ice extent over the 44-year satellite record is 79,100 square kilometers (30,500 square miles) per year, or 12.3 percent per decade relative to the 1981 to 2010 average. Based on the linear trend, since 1979, September has lost 3.59 million square kilometers (1.39 million square miles). This is equivalent to about twice the size of Alaska.
Summer 2022 in review
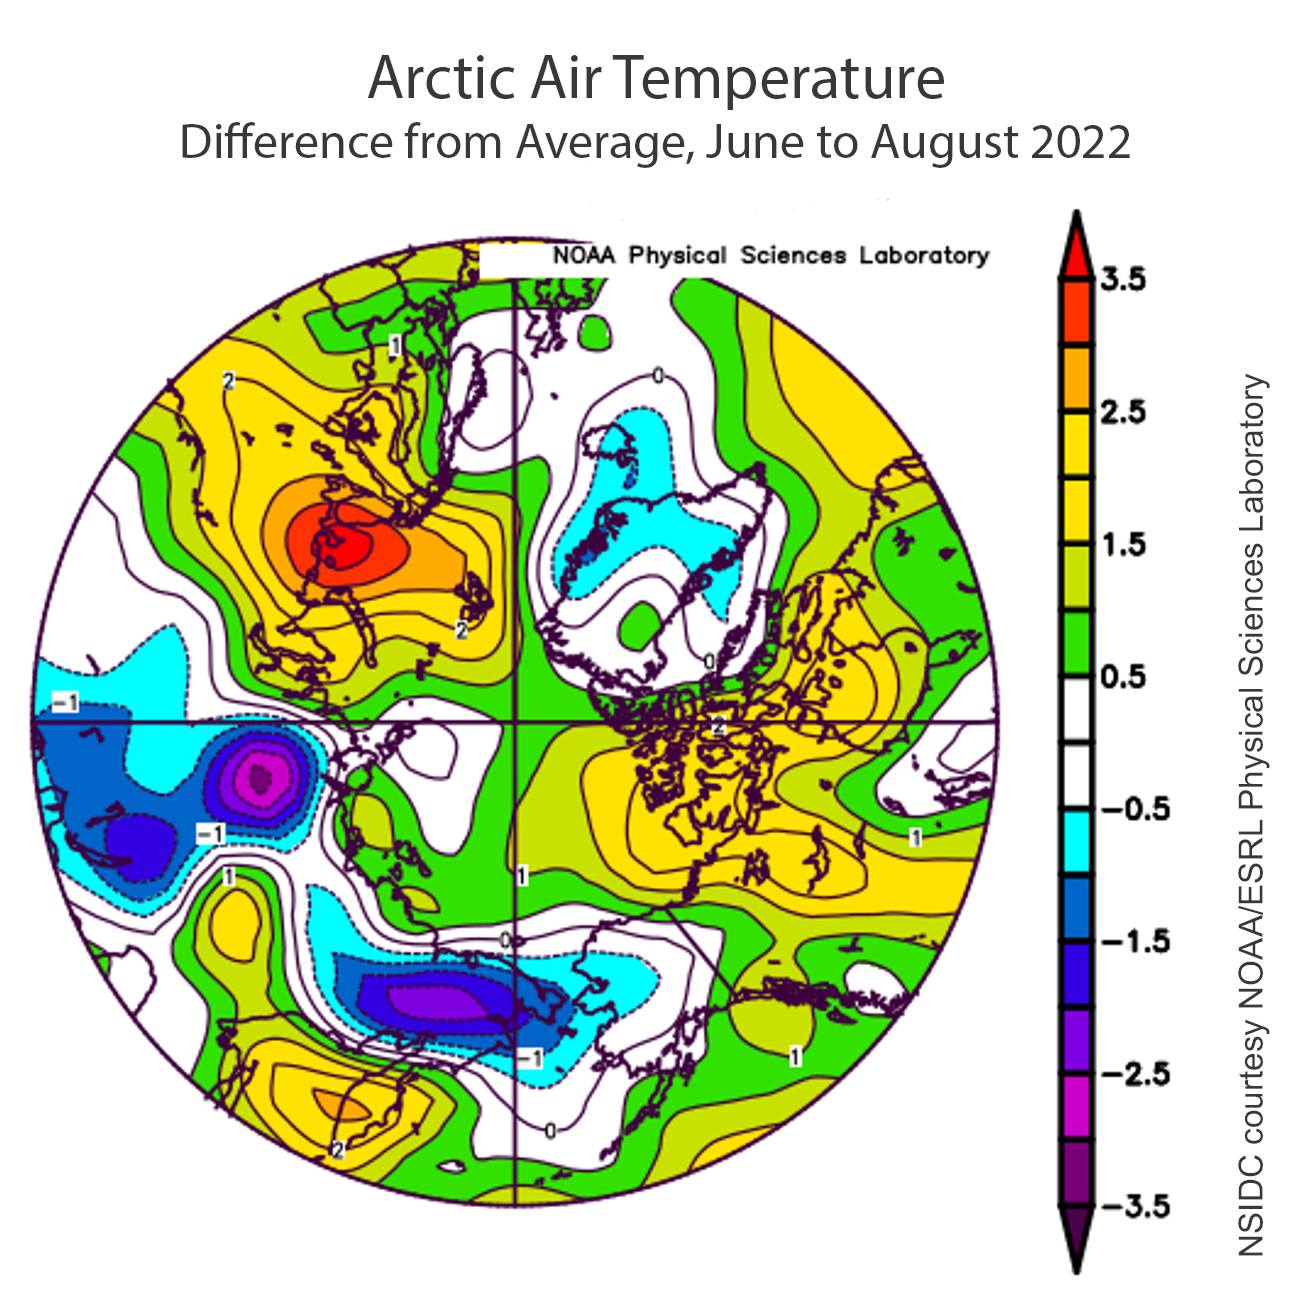
Figure 4a. This plot shows the departure from average air temperature in the Arctic at the 925 hPa level, in degrees Celsius, from June to August 2022. Yellows and reds indicate higher than average temperatures; blues and purples indicate lower than average temperatures.
Credit: NSIDC courtesy NOAA Earth System Research Laboratory Physical Sciences Laboratory
High-resolution image
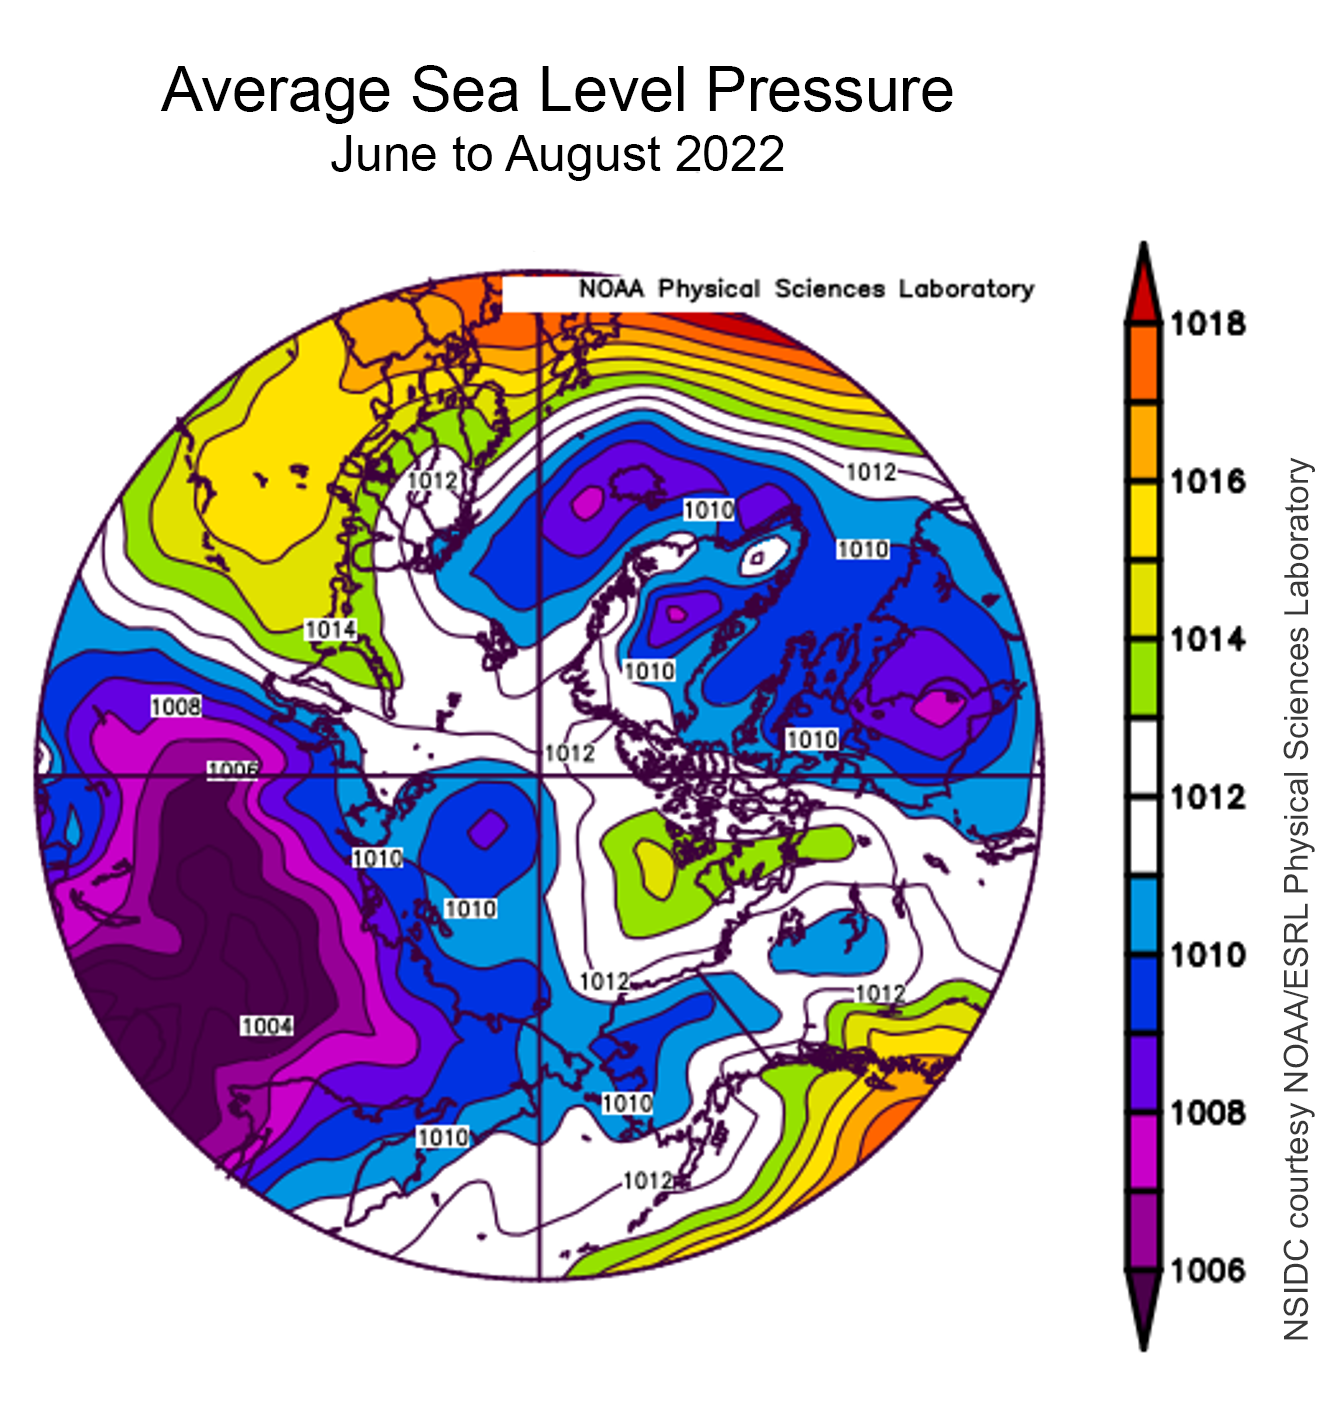
Figure 4b. This plot shows average sea level pressure in the Arctic in millibars from June to August 2022. Yellows and reds indicate high air pressure; blues and purples indicate low pressure.
Credit: NSIDC courtesy NOAA Earth System Research Laboratory Physical Sciences Laboratory
High-resolution image

Figure 4c. The upper left map shows ice age distribution toward the end of the melt season for 1985. The upper right map shows the end of the 2022 melt season. The bottom graphs shows sea ice age extent for multiyear ice, as depicted by the black line, and 4+ year-old ice, as depicted by the red line, for the Arctic Ocean region. The inset identifies the region of interest. Note the ice age product does not include ice in the Canadian Archipelago.
Credit: Tschudi et al., 2019
High-resolution image
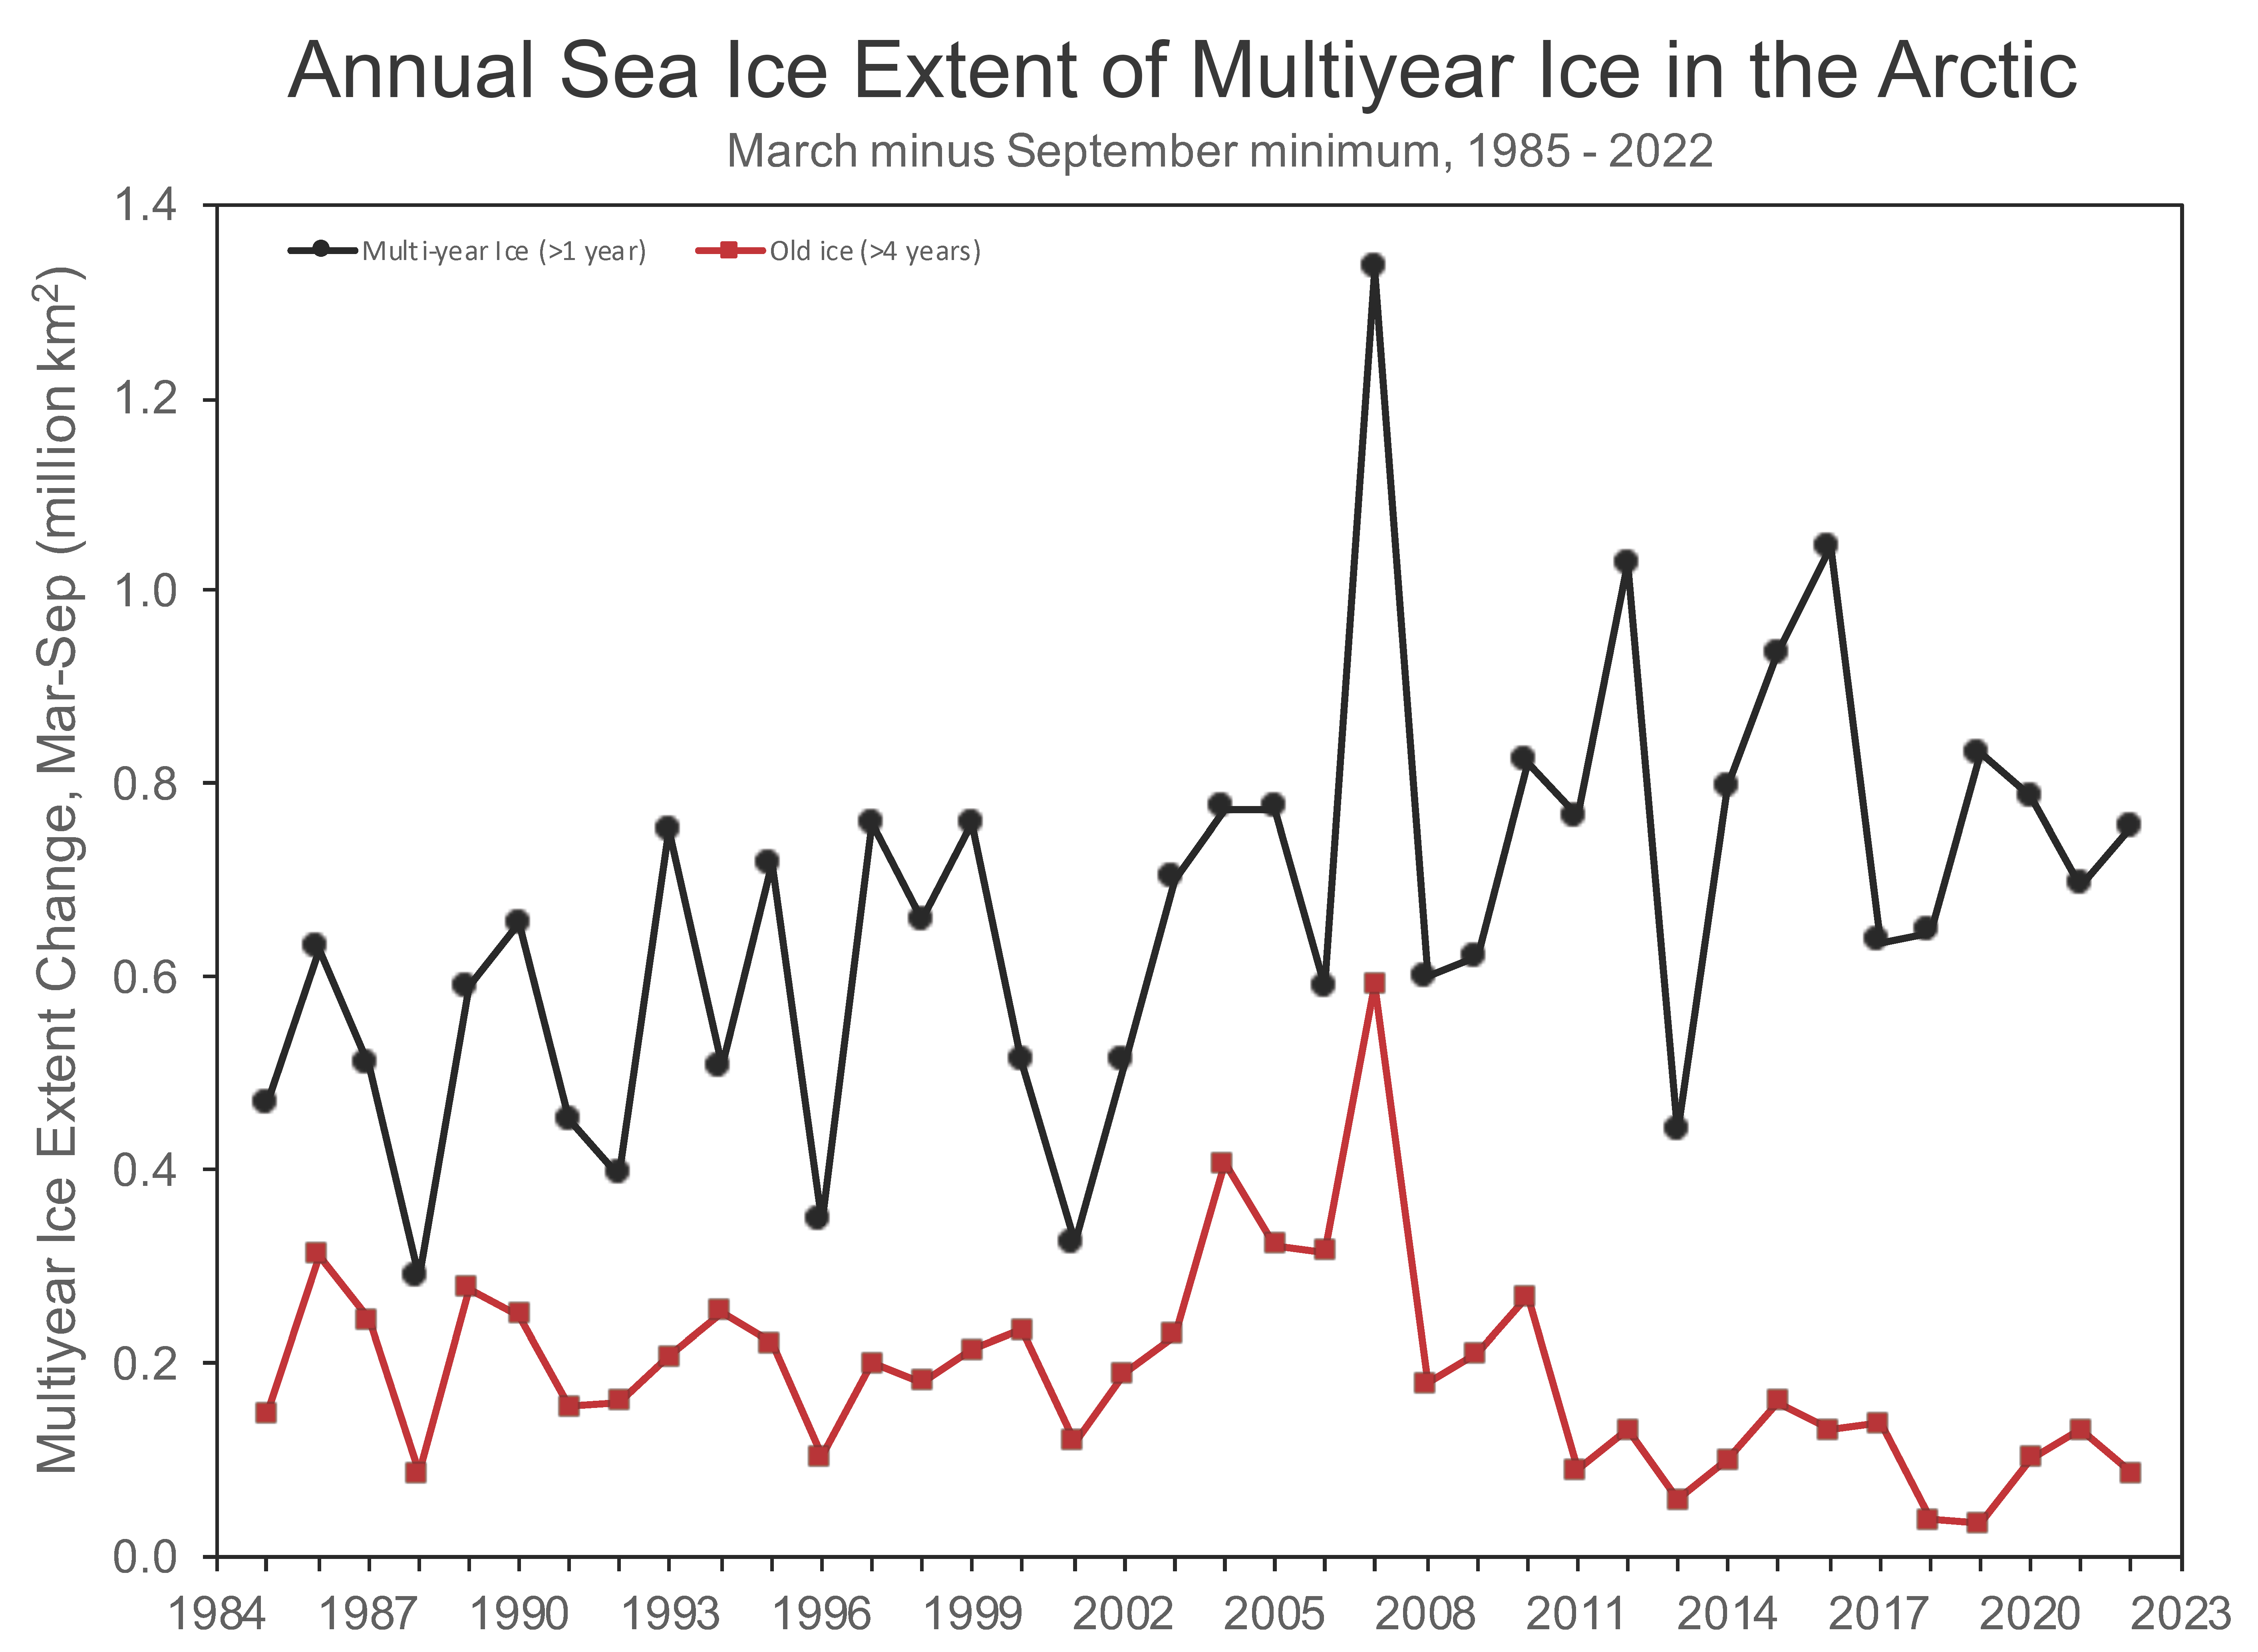
Figure 4d. This graph shows the annual change of multiyear and 4+ year-old ice over the summer melt season (mid-March to the September minimum) for 1985 to 2022. The black line depicts multiyear ice; the red line depicts 4+ year-old ice.
Credit: Tschudi et al., 2019
High-resolution image
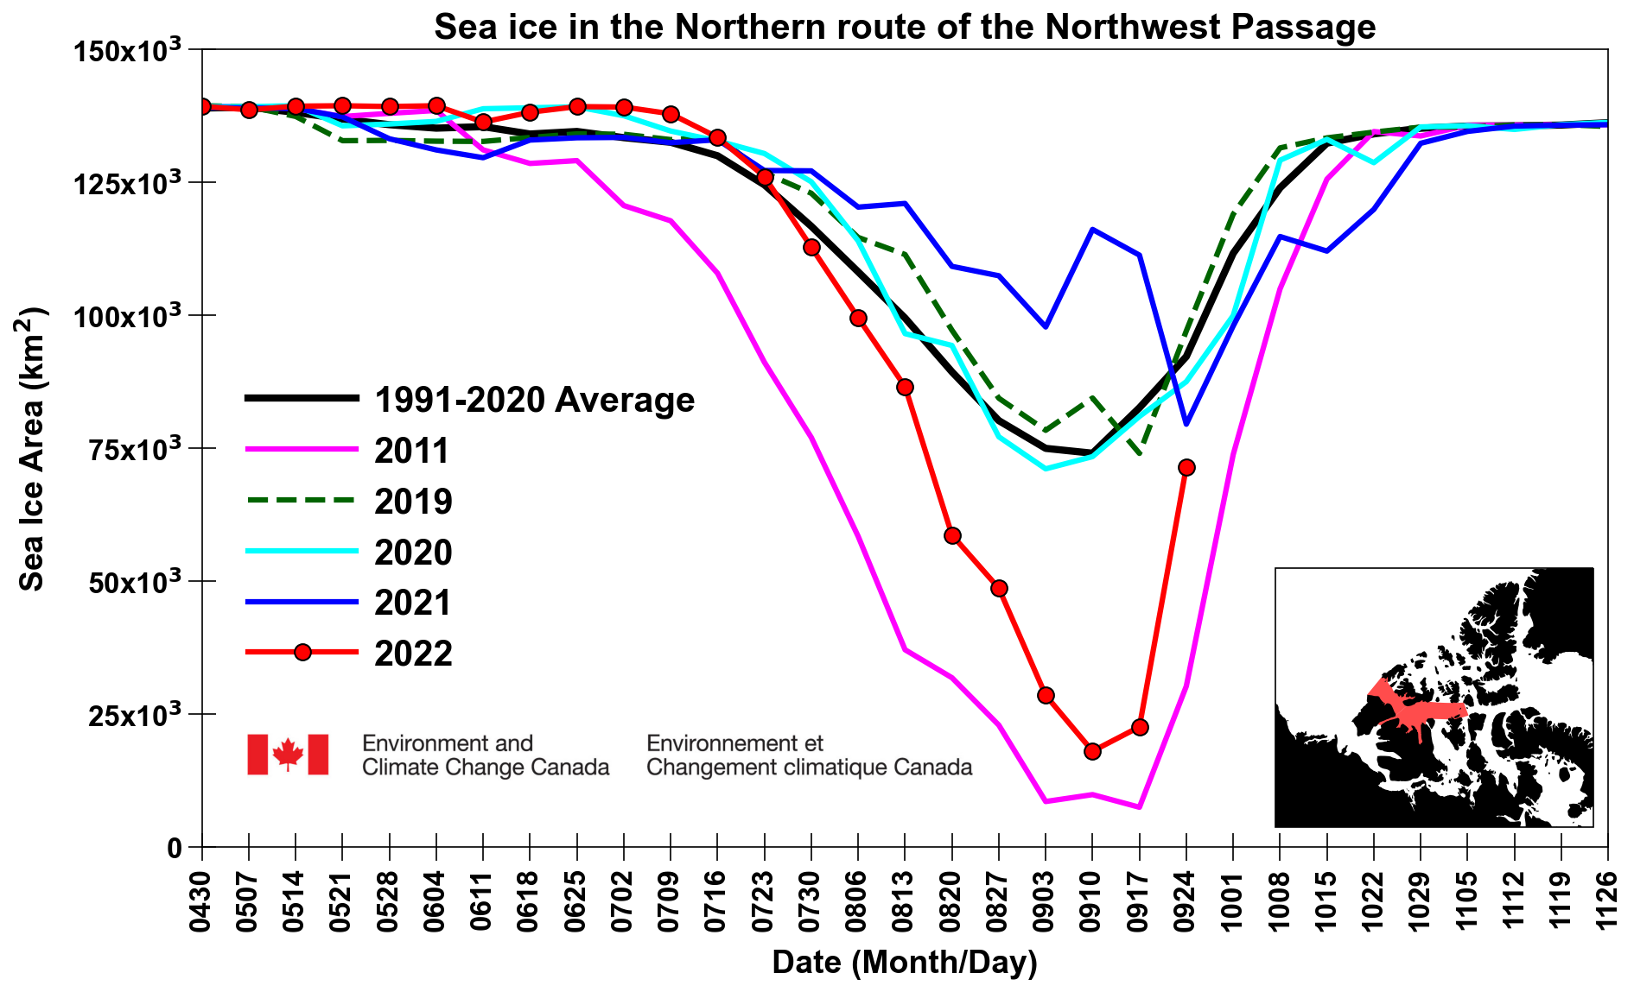
Figure 4e. This graph shows weekly sea ice extent in the Parry Channel, the red highlighted region in inset, based on Canadian Ice Service analyses for last four years, 2019 to 2022, the 2011 record low year, and the 1991 to 2020 average.
Credit: Steve Howell, Environment and Climate Change Canada
High-resolution image

Figure 4f. Clink on this animation to view the 2022 seasonal ice retreat. Images are from sea ice concentration data from NSIDC’s Sea Ice Index. The timeline is not uniform. The animation shows one image per week from May 2 to August 1, and then every other day through August, and every day in September until September 18, the seasonal ice minimum.
Credit: Michon Scott, NSIDC
High-resolution image
The summer 2022 melt season had some noteworthy highlights. Extent loss was less extreme than recent years through much of the summer; for the first time since 2014, extent briefly sat within the 1981 to 2010 lower interdecile range. However, late season ice loss was strong, pushing the September average to eleventh lowest in the passive microwave satellite record. No region of the Arctic was extreme in terms of how far north the ice edge retreated, though compared to average conditions, the ice edge was quite far north in the Laptev and Chukchi Seas. Surface melt onset was also variable, with earlier-than-average melt along the Siberian coast, particularly in the Kara and Barents Seas, but later-than-average melt in much of the central Arctic Ocean.
Air temperatures at the 925 millibar level (about 2,500 feet above sea level) were above average over much of the Arctic Ocean, but not as extreme as in many recent summers. Much of the Arctic Ocean experienced summer (June, July, August) temperatures 1 to 3 degrees Celsius (2 to 5 degrees Fahrenheit) above average (Figure 4a). Only in parts of the Barents Sea did 2022 summer air temperatures reach up to 4 degrees Celsius (7 degrees Fahrenheit) above average. In the southern Chukchi and northern Bering Seas, temperatures were 1 degree Celsius (2 degrees Fahrenheit) below average.
During June through August, average sea level pressure was low over much of the Siberian side of the Arctic, as well as over eastern Canada, and east of Greenland, with a small and weak Beaufort Sea High that primarily manifested itself in June (Figure 4b). Summer-averaged pressure gradients were slack, particularly in July and August, albeit with intermittent stronger gradients caused by passing weather systems. Weak pressure gradients resulted in relatively weak surface winds and sea ice circulation through much of the summer.
Of particular note was the formation of polynyas north of the Kara Sea, at about 87 degrees North latitude. These started to form in early July and were observed intermittently through the end of August. These unusual polynyas likely opened at least in part because of divergent ice motion, but their formation and general persistence is also an indication of thin, young, and uncompacted ice. It is also possible that deep ocean waters were churned toward the surface as currents flowed over the Lomonosov Ridge beneath some of the polynya areas.
The distribution of sea ice age at the end of summer 2022 shows a dominance of first and second-year ice (Figure 4c). Some of this second-year ice extends south into the East Siberian Sea and is one reason why the Northern Sea Route maintained ice until later in the summer. A thin ribbon of old ice (3 to 4 and 4+ years age) extends along the northern shore of the Canadian Arctic Archipelago. The summertime loss of the multiyear ice has generally increased since the mid 1980s, but with large variations from one summer to the next (Figure 4d). The 4+ year-old ice shows less summertime change, especially since 2012, because so little of that ice remains in the Arctic. The most notable feature in both ice age classes is the large spike in loss during the 2007 summer.
The evolution of sea ice concentration during the 2022 melt season is presented in an animation, which begins on May 2 and ends at the sea ice minimum on September 18 (Figure 4f). Rapid early loss is noticeable in the Kara Sea with large retreats also occurring in the Laptev and Beaufort Seas. By August, a tongue of somewhat older and thicker ice is left behind in the East Siberian Sea. Retreat was generally ahead of the average date for ice extent through the summer. Also shown is the unusually persistent low sea ice concentration in the high Arctic north of the Severnaya Zemlaya islands, eventually leading to the opening of two high-latitude polynyas in late August into early September. Melt events are shown as brief drops in concentration, but the regions around the polynyas remained low throughout the second half of the summer.
The Northwest Passage (NWP)—a shortcut between Europe and Asia through the channels of the Canadian Arctic Archipelago—was the dream of explorers and financiers for centuries. The southern NWP route was first navigated by Roald Amundsen over three summers, 1905 to 1908. In recent years, his circuitous route, winding through narrow and shallow channels, has often opened for at least part of the summer. However, even in recent years, the more direct northern route through Parry Channel, with wide and deep channels more suitable for shipping, has remained choked with ice. This is partly because of an influx of thick, multiyear ice into the channel from the Arctic Ocean to the north. This year the northern route largely opened. While operational analysis showed the region with 10 to 80 percent ice cover, high resolution maps of the ice cover, indicated a continuous path through open water starting in late August until mid-September. Overall, the ice area in the northern route reached the fourth lowest in the 55-year record of Canadian Arctic sea ice conditions analyzed by the Canadian Ice Service; the NWP information was provided by Steve Howell of Environment and Climate Change Canada (Figure 4e).
Top ten lowest sea ice extents in northern route of the Northwest Passage
| Rank | Year | Sea Ice Area (km2) | Date |
| 1 | 2011 | 7,506 | 2011-09-19 |
| 2 | 2015 | 12,695 | 2015-09-14 |
| 3 | 2012 | 14,613 | 2012-10-01 |
| 4 | 2022 | 18,050 | 2022-09-12 |
| 5 | 2010 | 18,583 | 2010-09-06 |
| 6 | 2008 | 28,745 | 2008-09-08 |
| 7 | 1998 | 33,663 | 1998-09-28 |
| 8 | 1999 | 36,608 | 1999-09-13 |
| 9 | 2007 | 36,703 | 2007-09-10 |
| 10 | 2016 | 44,936 | 2016-08-22 |
The view down south
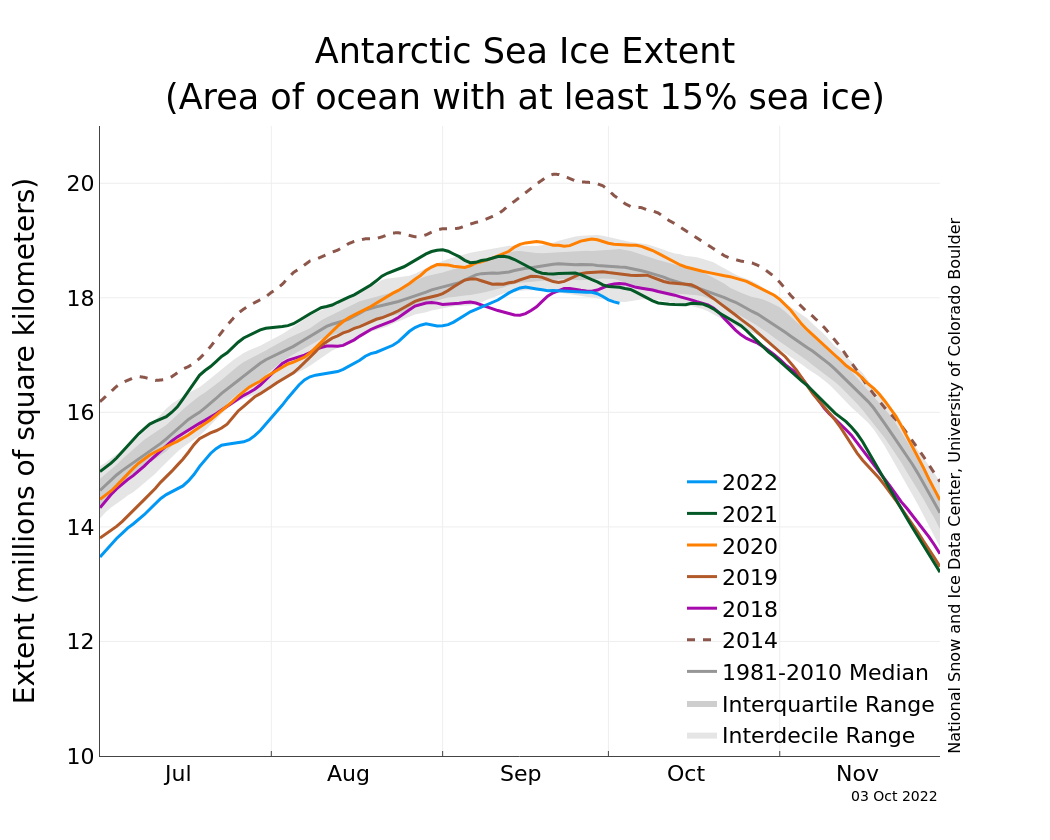
Figure 5. The graph above shows Antarctic sea ice extent as of October 3, 2022, along with daily ice extent data for four previous years and the record high year. 2022 is shown in blue, 2021 in green, 2020 in orange, 2019 in brown, 2018 in magenta, and 2014 in dashed brown. The 1981 to 2010 median is in dark gray. The gray areas around the median line show the interquartile and interdecile ranges of the data. Sea Ice Index data.
Credit: National Snow and Ice Data Center
High-resolution image
As the Arctic makes its journey into autumn, Antarctic sea ice extent is nearing its winter maximum. On September 16, extent stood at 18.19 million square kilometers (7.02 million square miles), which may represent the seasonal maximum. However, extent may yet rise above that value. After record and near-record low extent earlier in the year, late ice growth increased the extent within the inter-decile range by mid-September.
Antarctic sea ice extent has exhibited extreme interannual variability with record highs and record lows within the past decade. There is also strong regional variability, with some areas showing long-term trends of ice loss, with others showing gains. One region with a notable downward trend in extent is the Bellingshausen Sea, west of the Antarctic Peninsula. The Peninsula region has also experienced a strong multi-decade warming trend, which has resumed after a decade-long hiatus. One factor in these changes is a strengthening of the Amundsen Low the brings southward winds to the region, which raise air temperatures and compact the ice. A new study by Dalaiden et al. suggests that this Amundsen Low strengthening is caused by an anthropogenic forcing, and a coupling to the general temperature pattern and trends in the Pacific Ocean.
Update
On October 5, 2022, the Arctic Sea Ice News & Analysis team decided to add the animation of sea ice loss through the melt season and corresponding text (Figure 4f).
References
Dalaiden, Q., A. P. Schurer, M. C. Kirchmeier-Young, H. Goosse, and G. C. Hegerl, G. 2022. West Antarctic surface climate changes since the mid-20th century driven by anthropogenic forcing. Geophysical Research Letters, 49, e2022GL099543. doi:10.1029/2022GL099543.
Tschudi, M., W. N. Meier, J. S. Stewart, C. Fowler, and J. Maslanik. 2019. EASE-Grid Sea Ice Age, Version 4 [Data Set]. Boulder, Colorado USA. NASA National Snow and Ice Data Center Distributed Active Archive Center. doi:0.5067/UTAV7490FEPB. Date Accessed 10-04-2022.
Tschudi, M., W. N. Meier, and J. S. Stewart. 2019. Quicklook Arctic Weekly EASE-Grid Sea Ice Age, Version 1 [Data Set]. Boulder, Colorado USA. NASA National Snow and Ice Data Center Distributed Active Archive Center. doi:10.5067/2XXGZY3DUGNQ. Date Accessed 10-04-2022.

