The summer melt season has come to a modest end. The summer of 2021 was relatively cool compared to the most recent years and September extent was the highest since 2014. It was nevertheless an eventful summer, with many twists and turns.
Overview of conditions
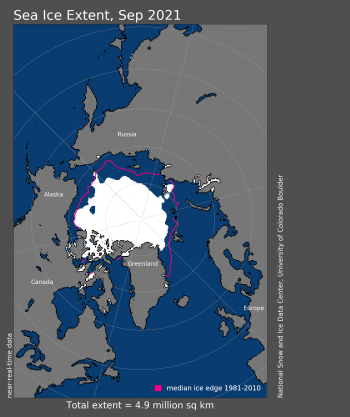
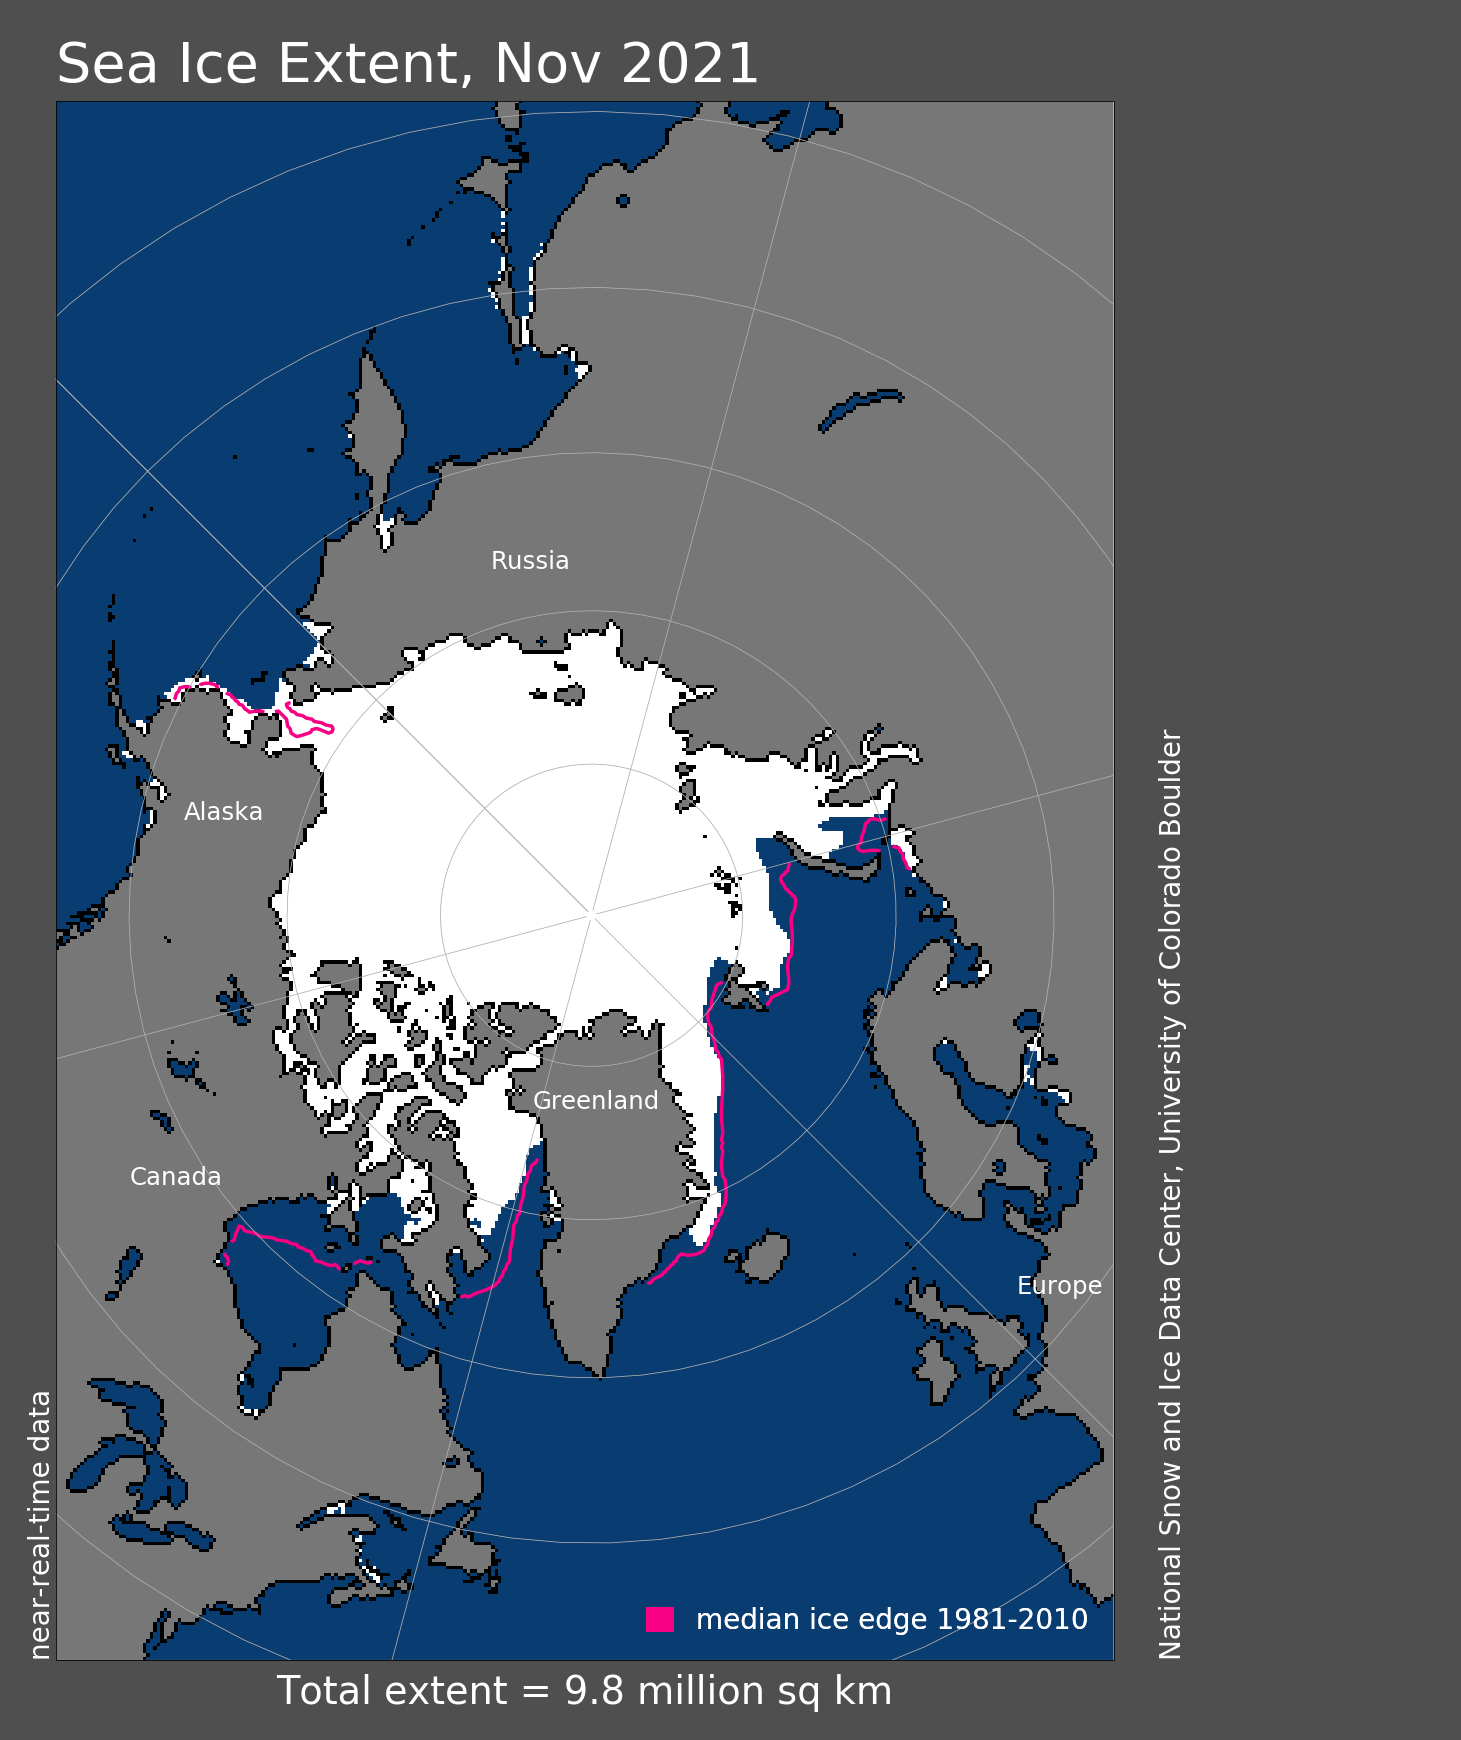
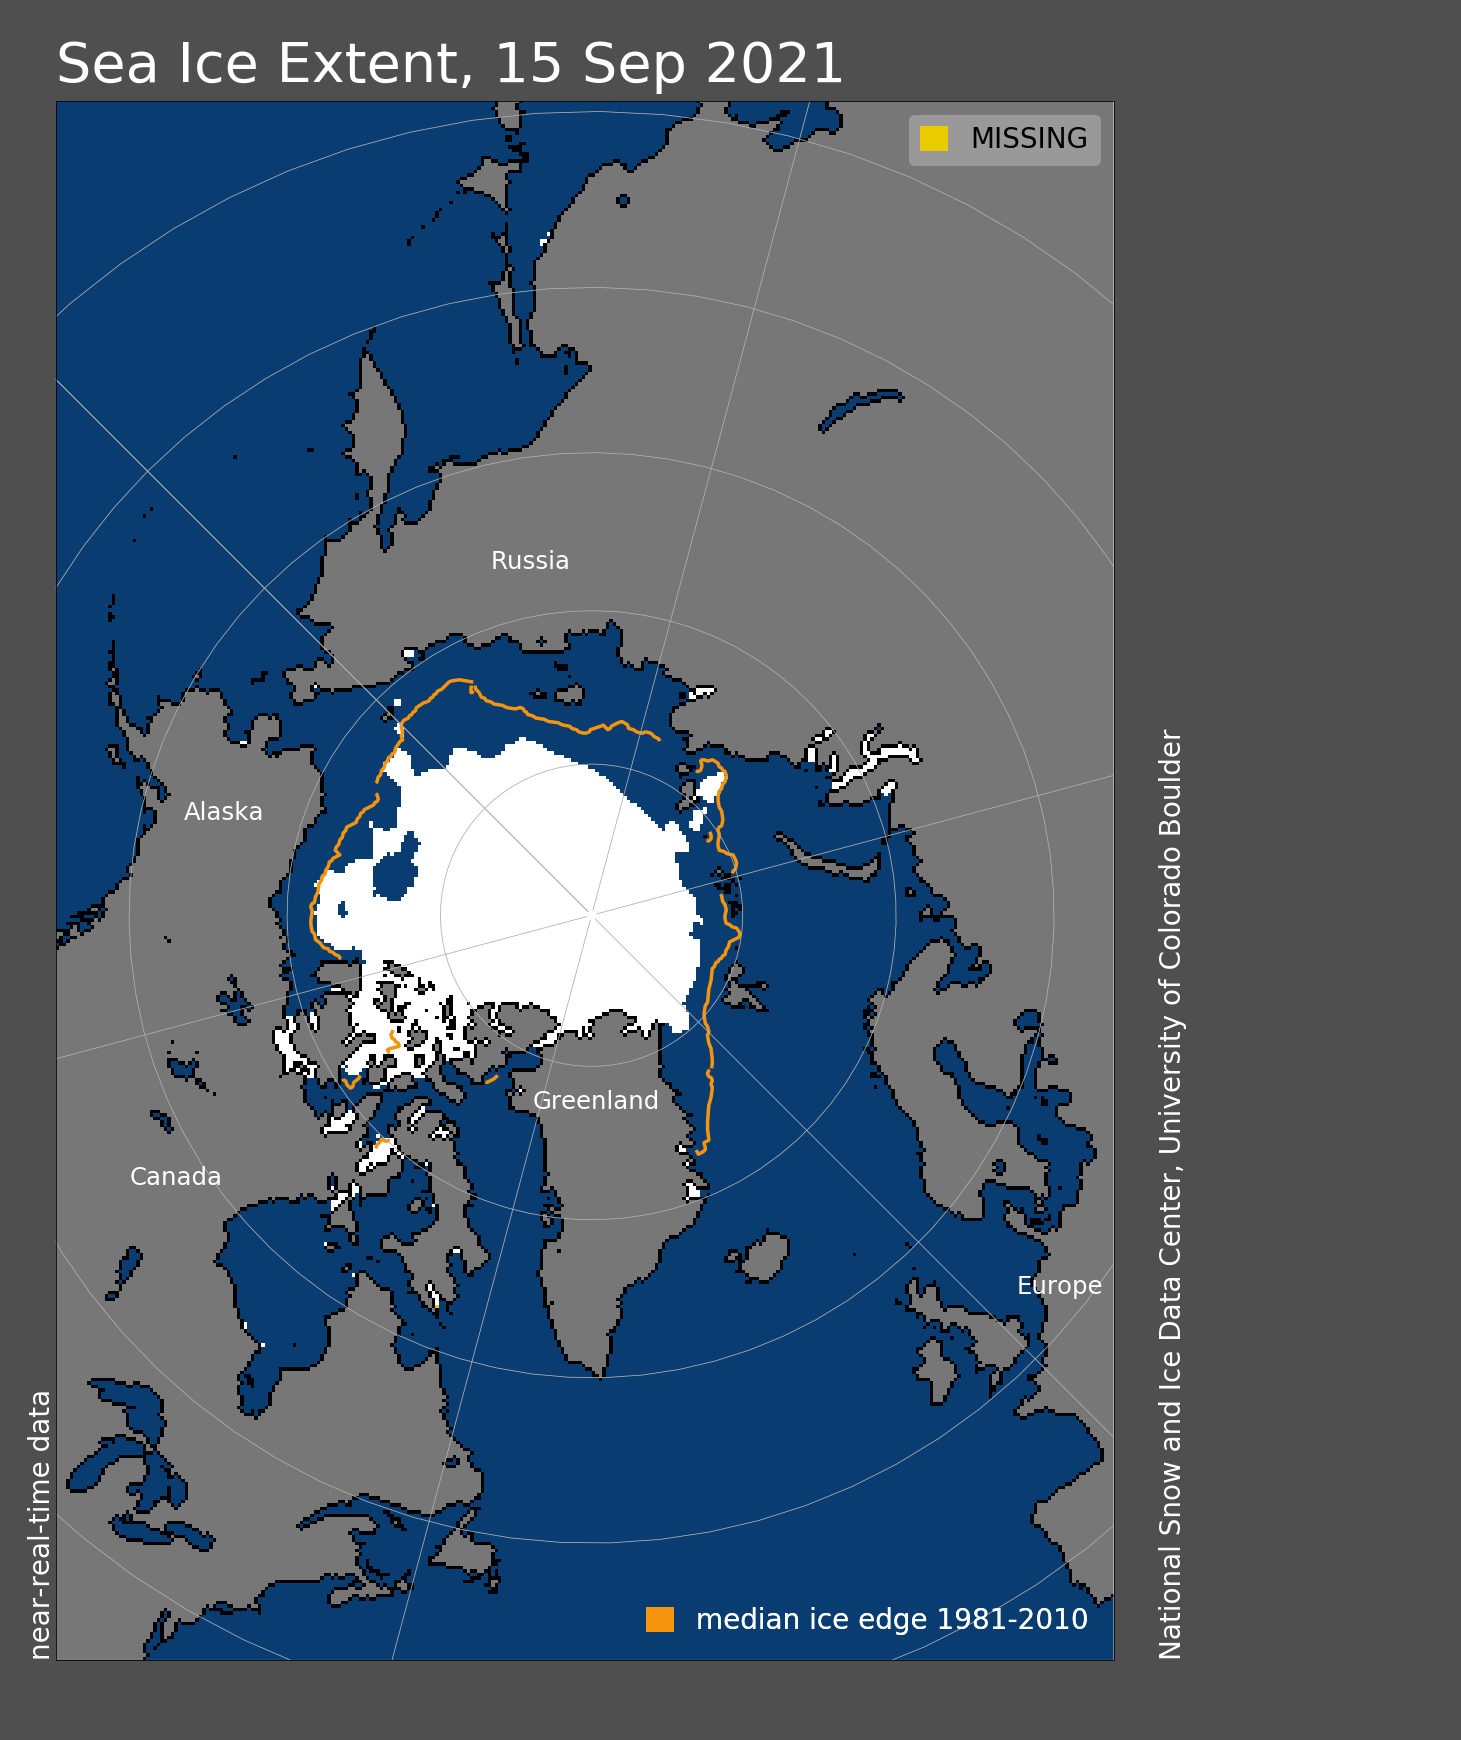
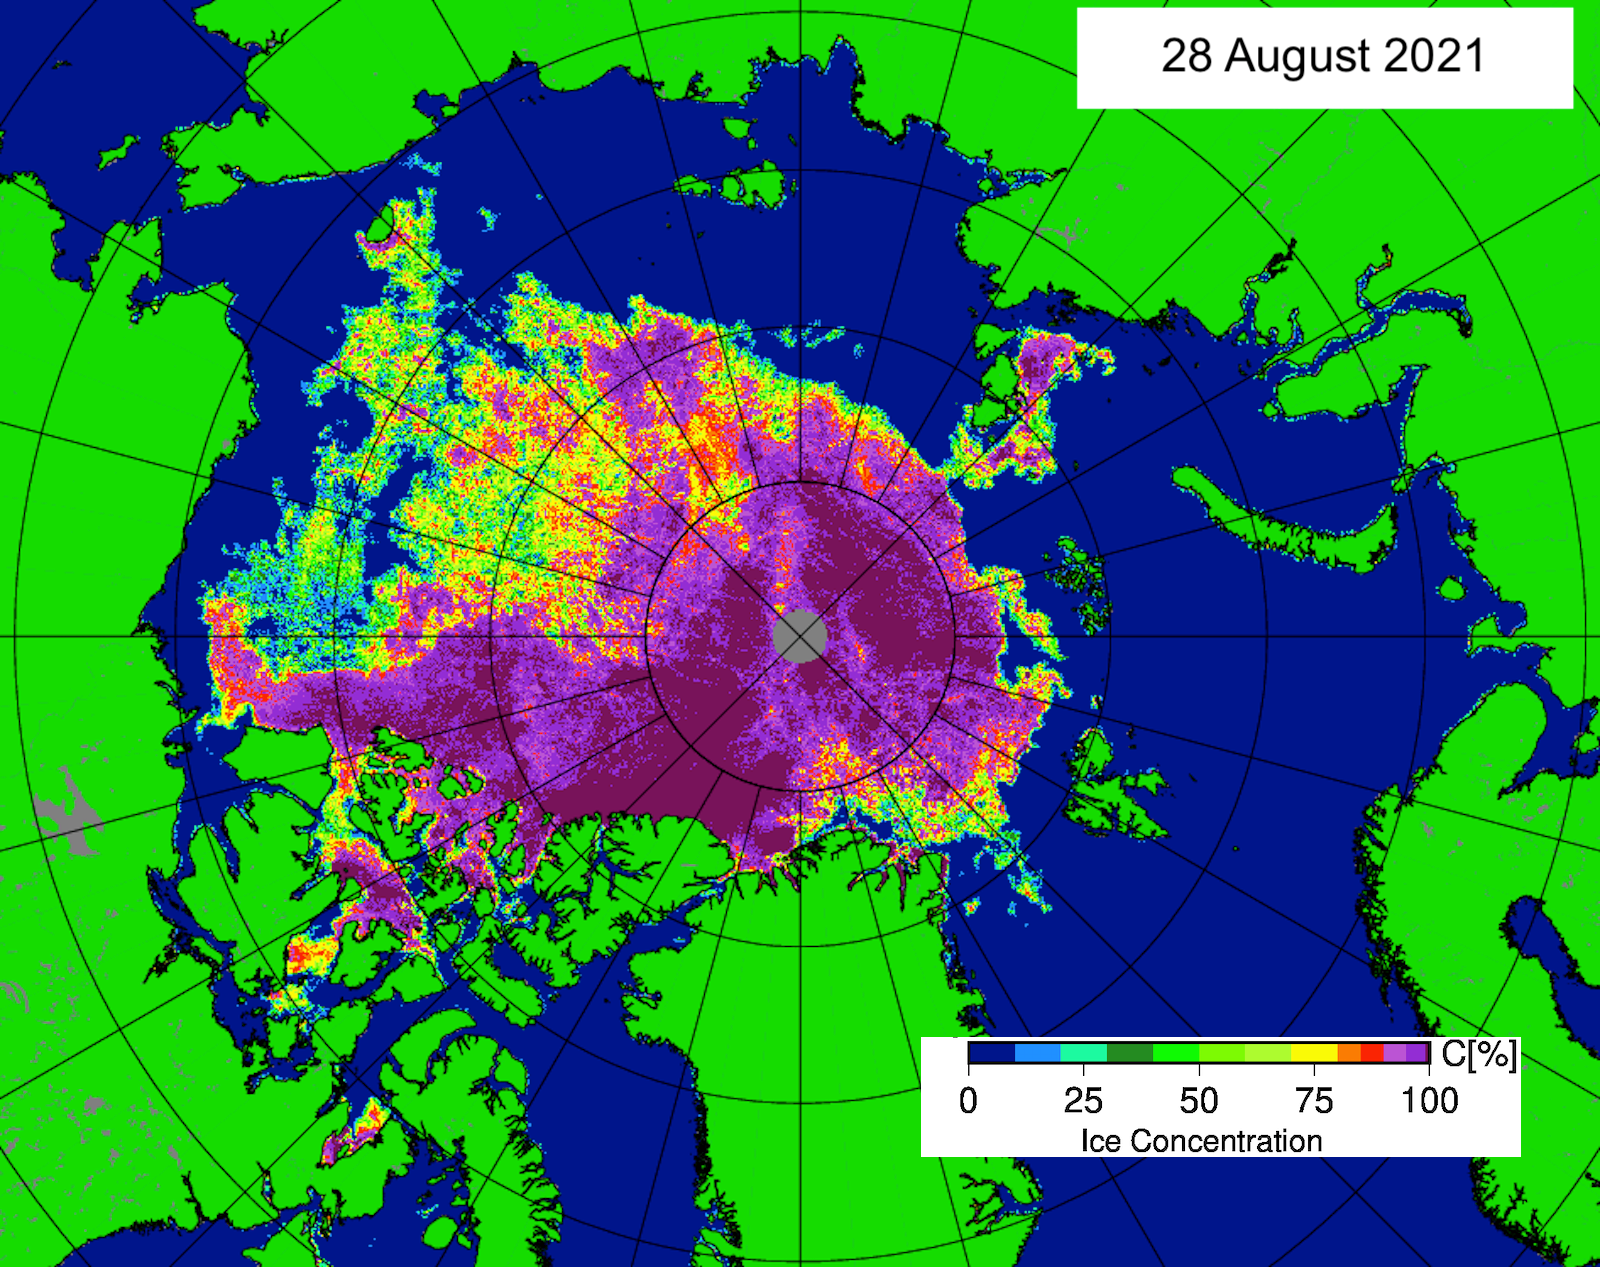
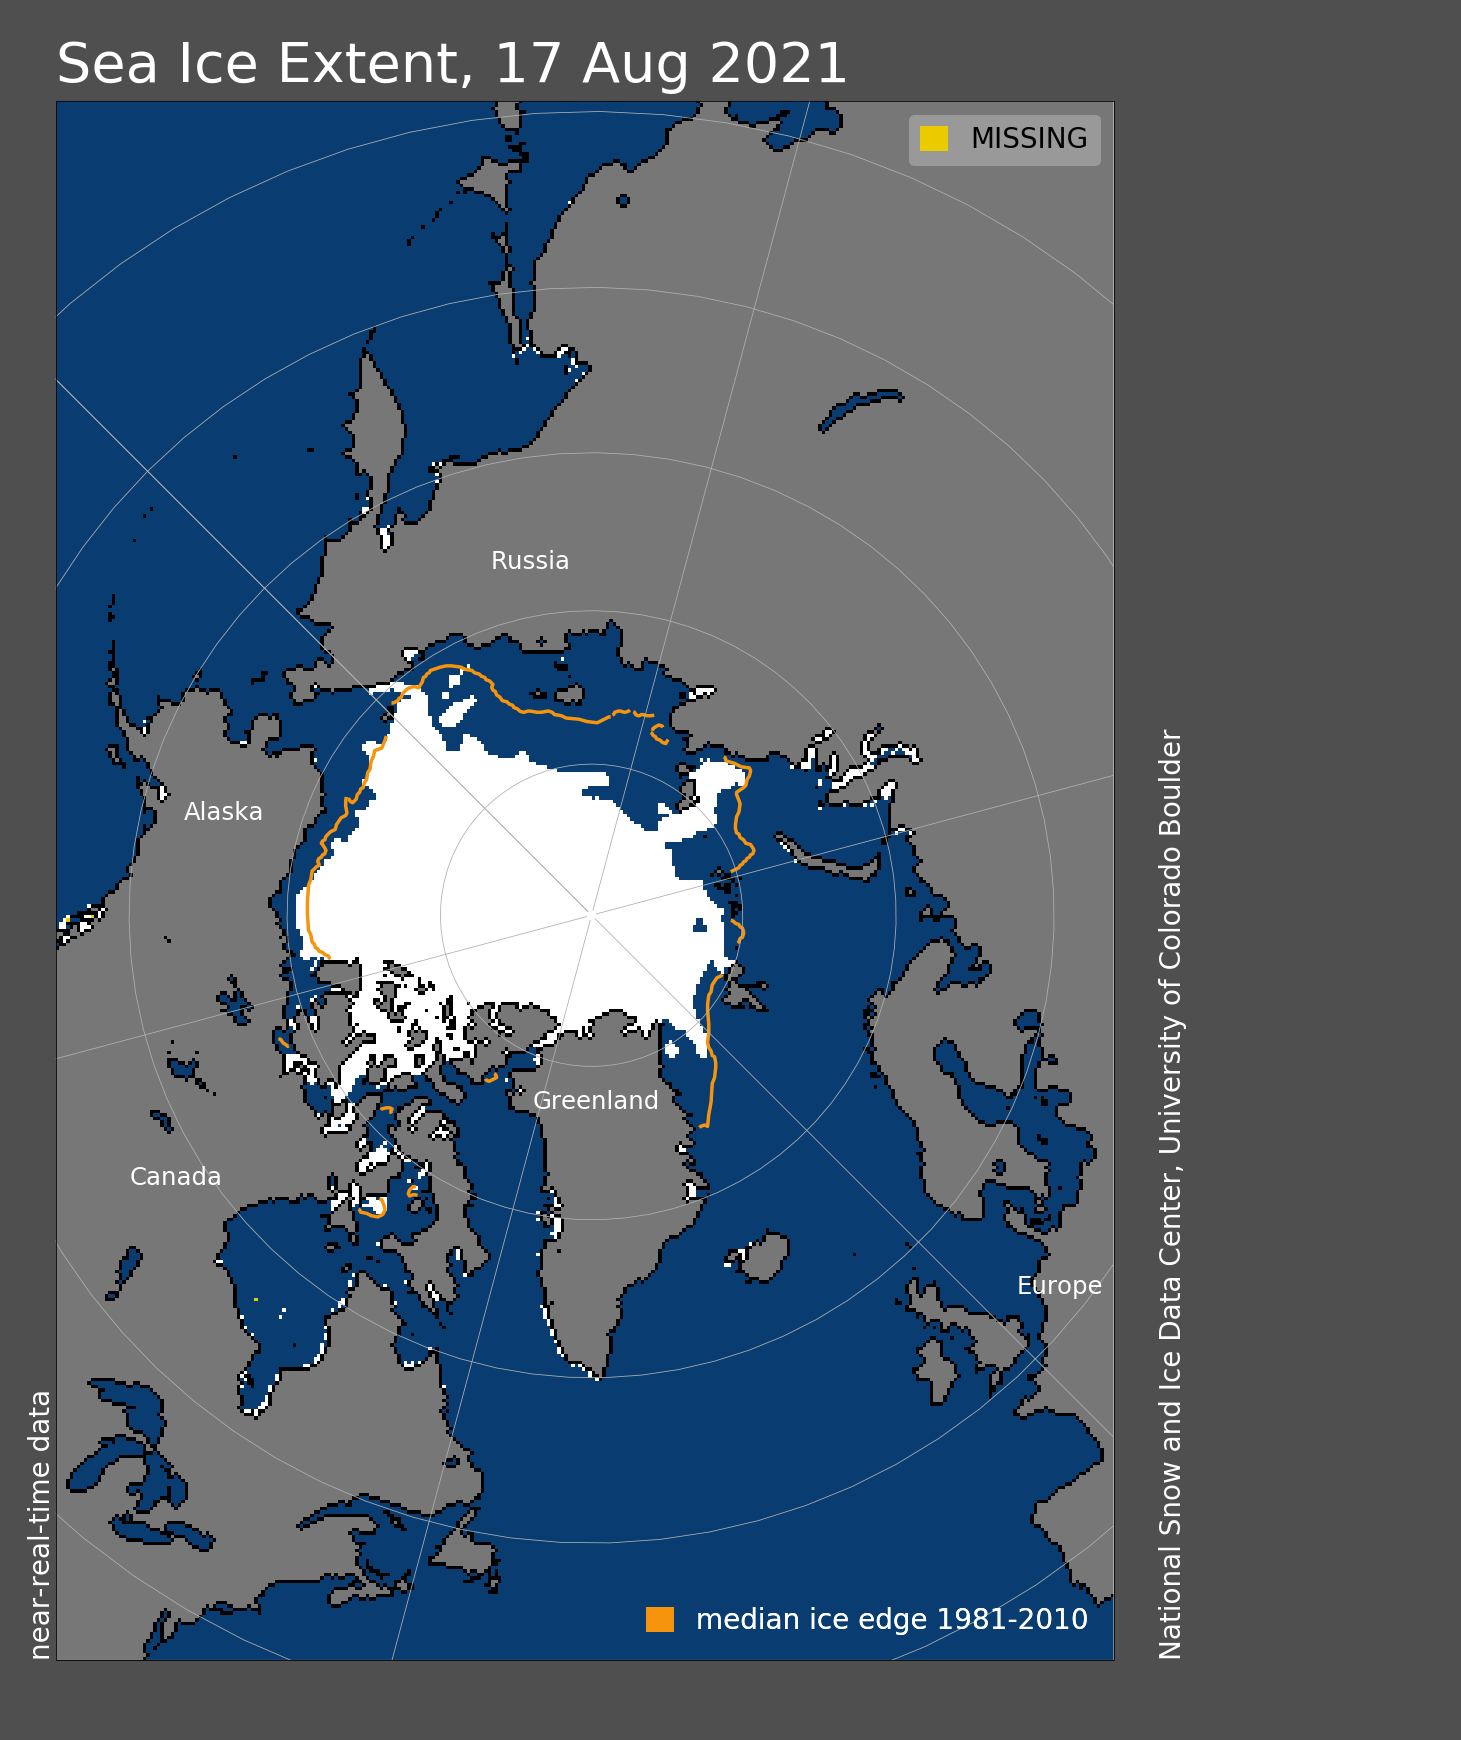
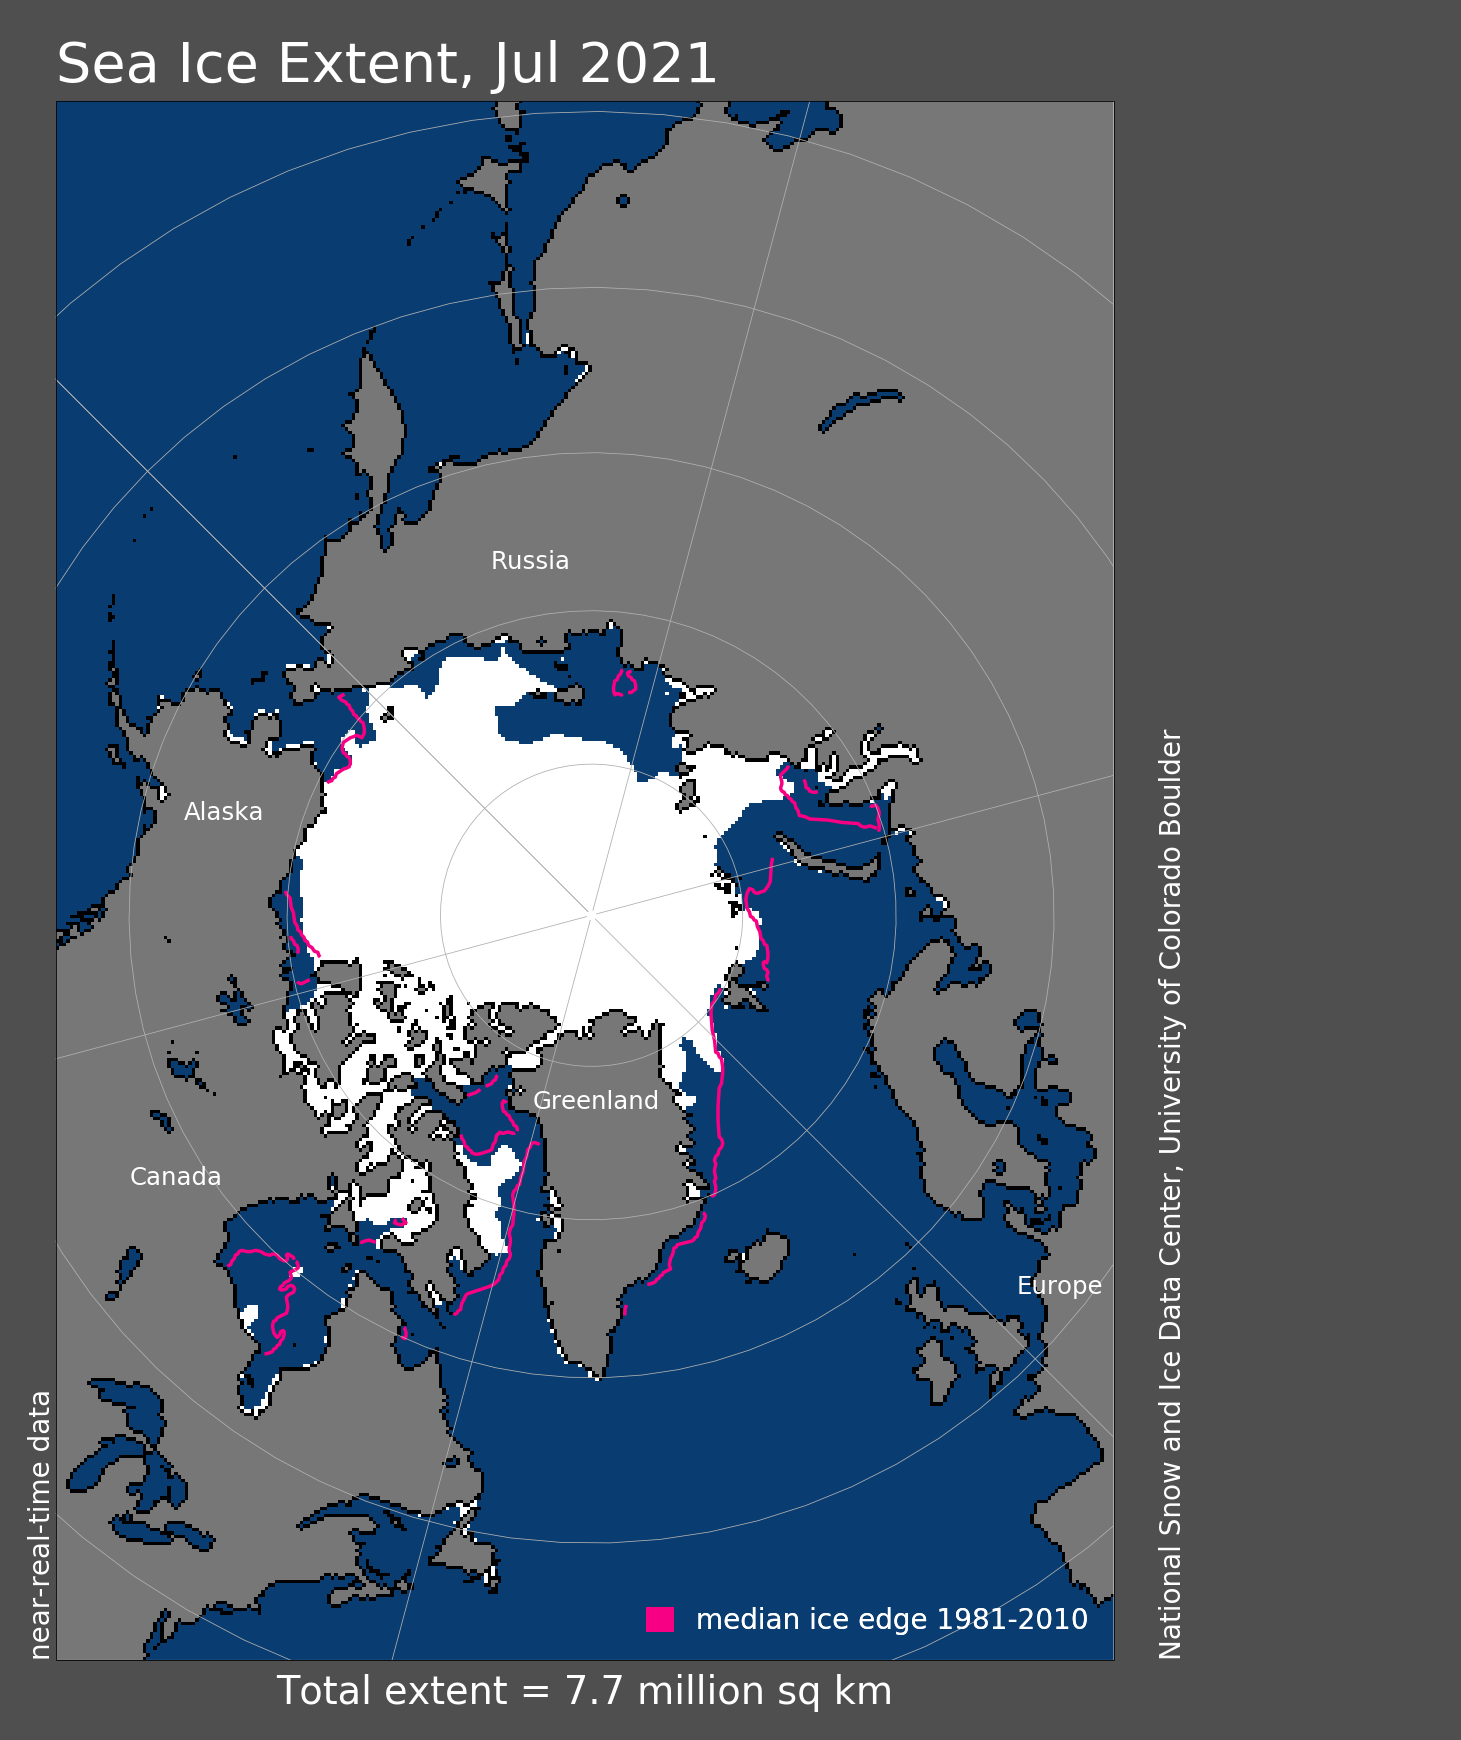
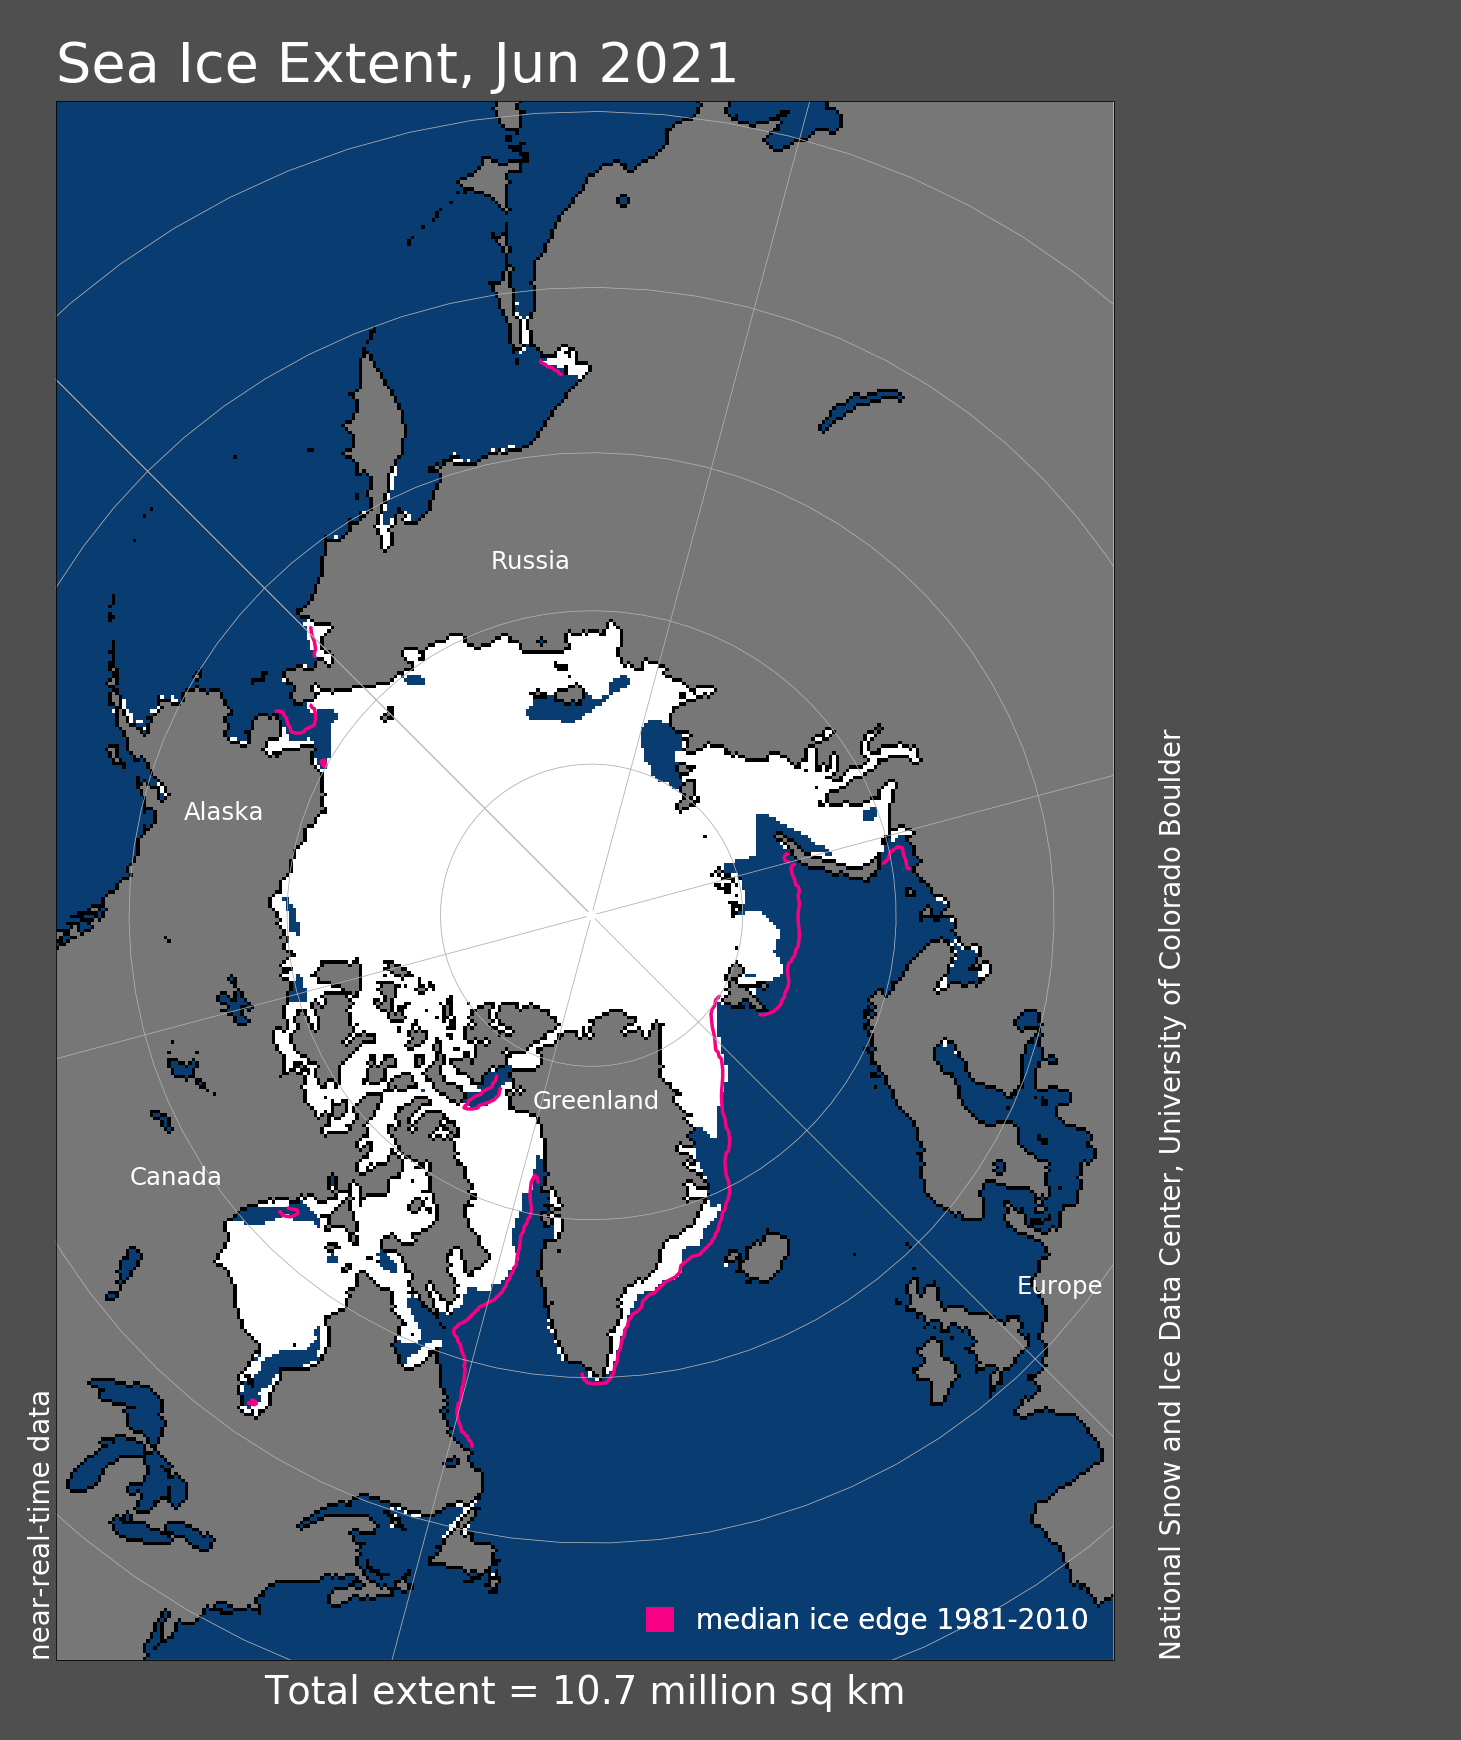
Figure 1a. Arctic sea ice extent for September 2021 was 4.92 million square kilometers (1.90 million square miles). The magenta line shows the 1981 to 2010 average extent for that month. Sea Ice Index data. About the data
Credit: National Snow and Ice Data Center
High-resolution image

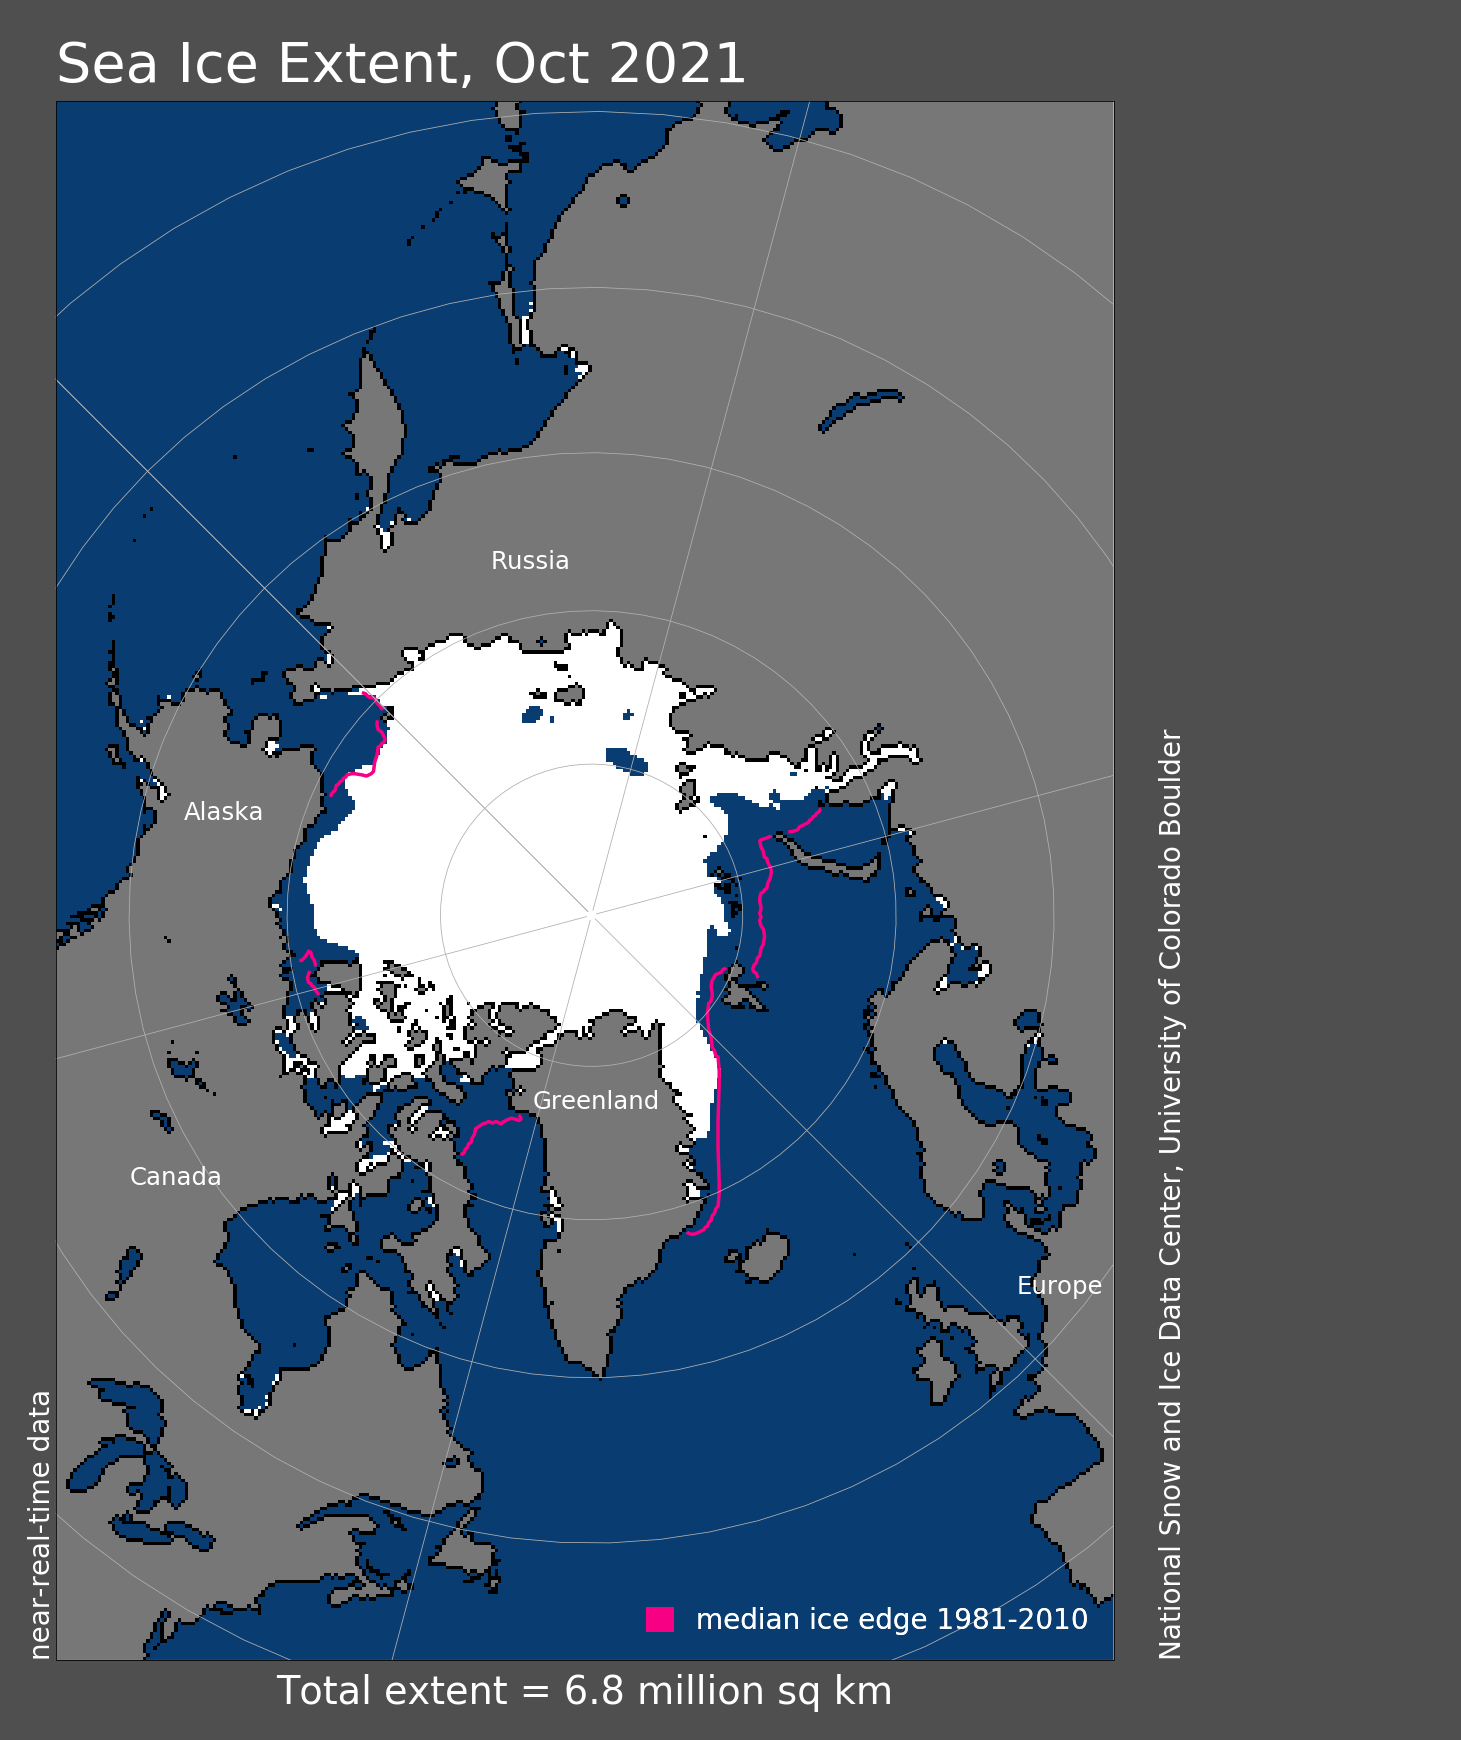
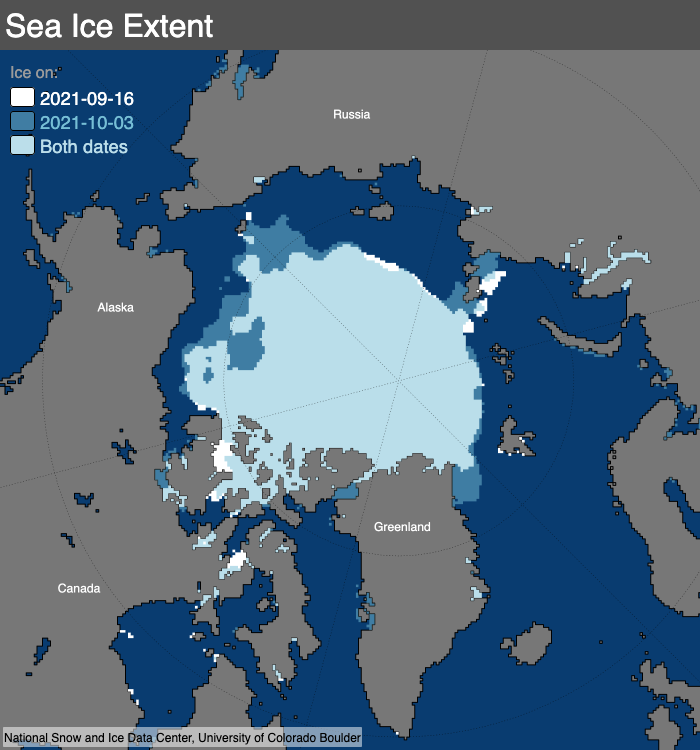
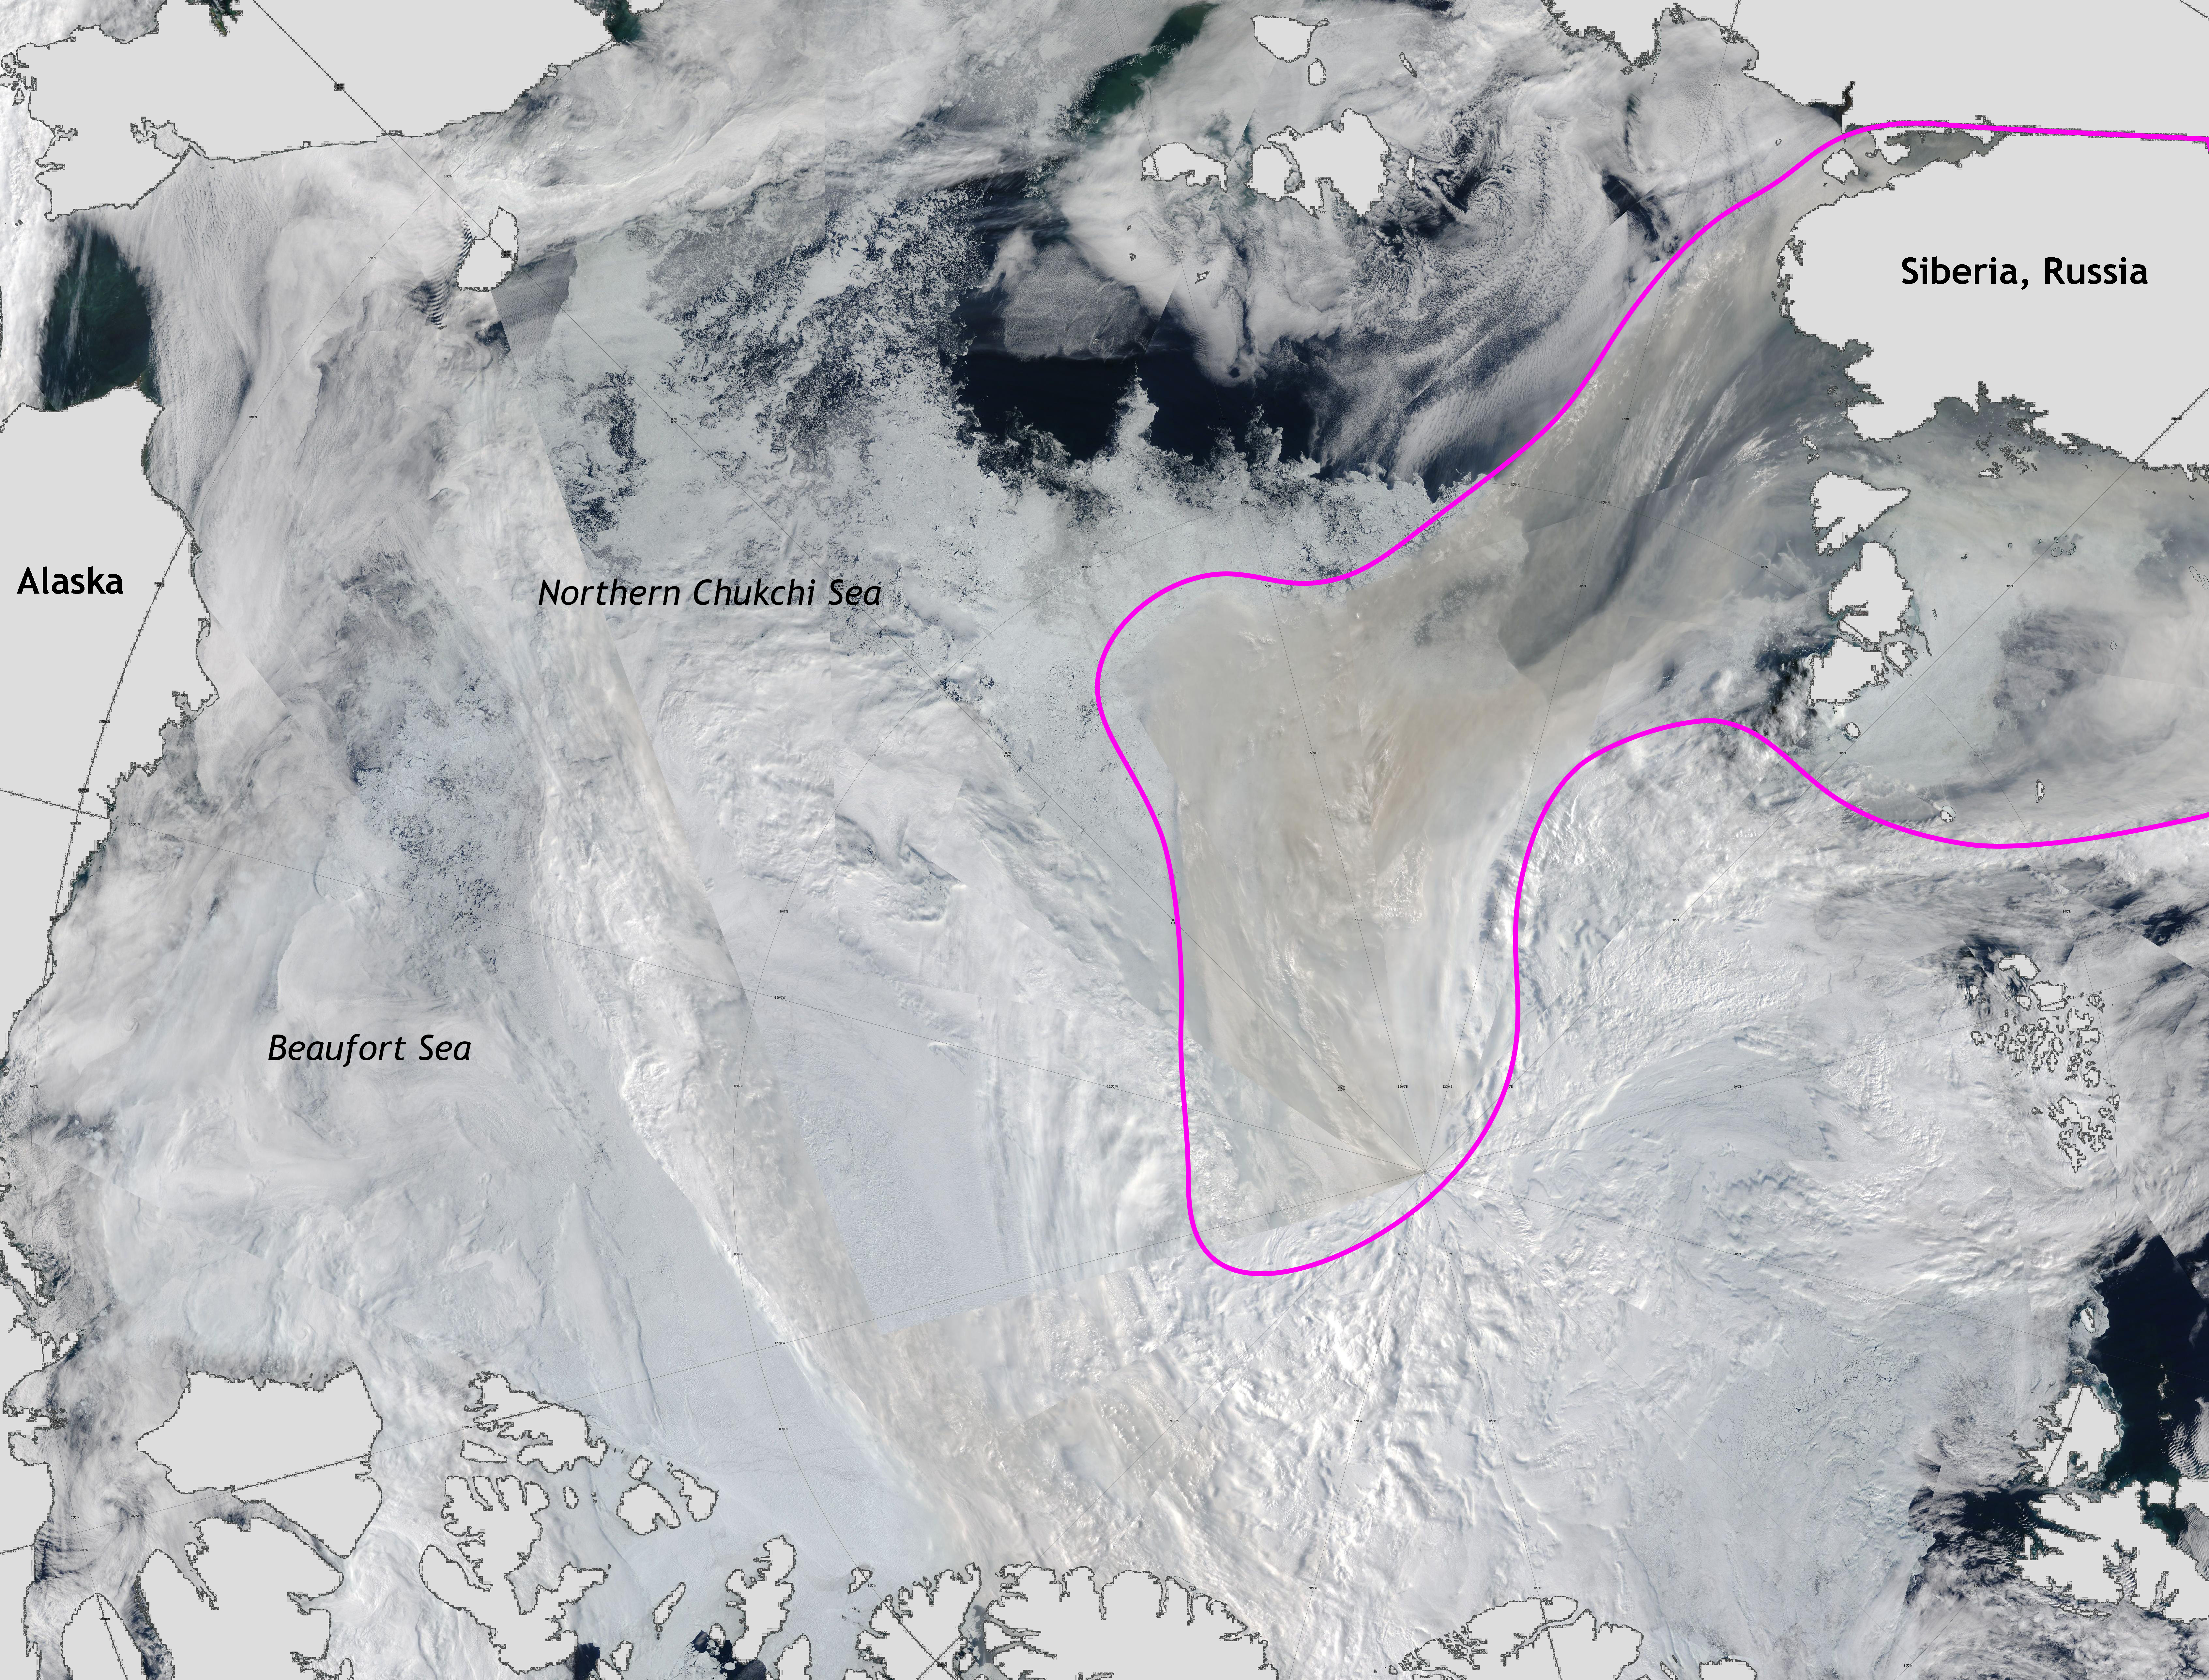
Figure 1b. The map above compares the annual minimum set on September 16, 2021, with October 3, 2021. Light blue shading indicates the region where ice occurred on both dates, while white and medium blue areas show ice cover unique to September 16, 2021 and October 3, 2021, respectively. Sea Ice Index data. About the data
Credit: National Snow and Ice Data Center
High-resolution image
Arctic sea ice extent for September averaged 4.92 million square kilometers (1.90 million square miles), the twelfth lowest in the 43-year satellite record. This is 1.35 million square kilometers (521,000 square miles) above the record low set in September 2012, and 1.49 million square kilometers (575,000 square miles) below the 1981 to 2010 average. The last 15 years (2007 to 2021) have had the 15 lowest September extents in the record.
The annual minimum extent occurred on September 16 and was the twelfth lowest minimum in the satellite record. Afterwards, ice extent increased primarily in the Beaufort Sea region, with the large irregular open water region that existed in mid-September filling in with ice (Figure 1b). The ice edge also expanded in the East Siberian Sea. The East Greenland Sea has been largely ice free for much of the summer, but sea ice is now expanding southward.
Conditions in context
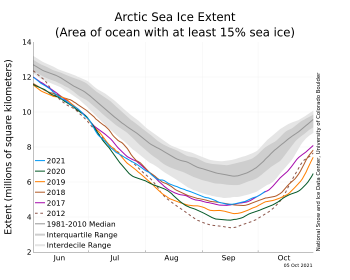
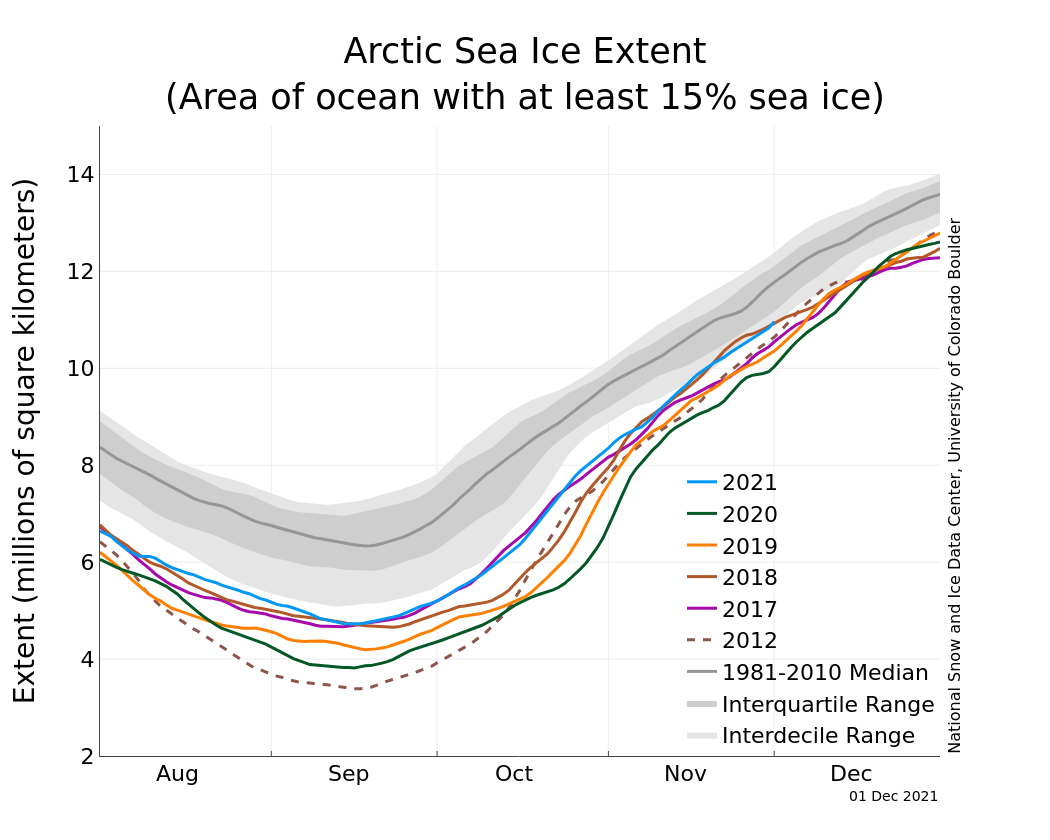
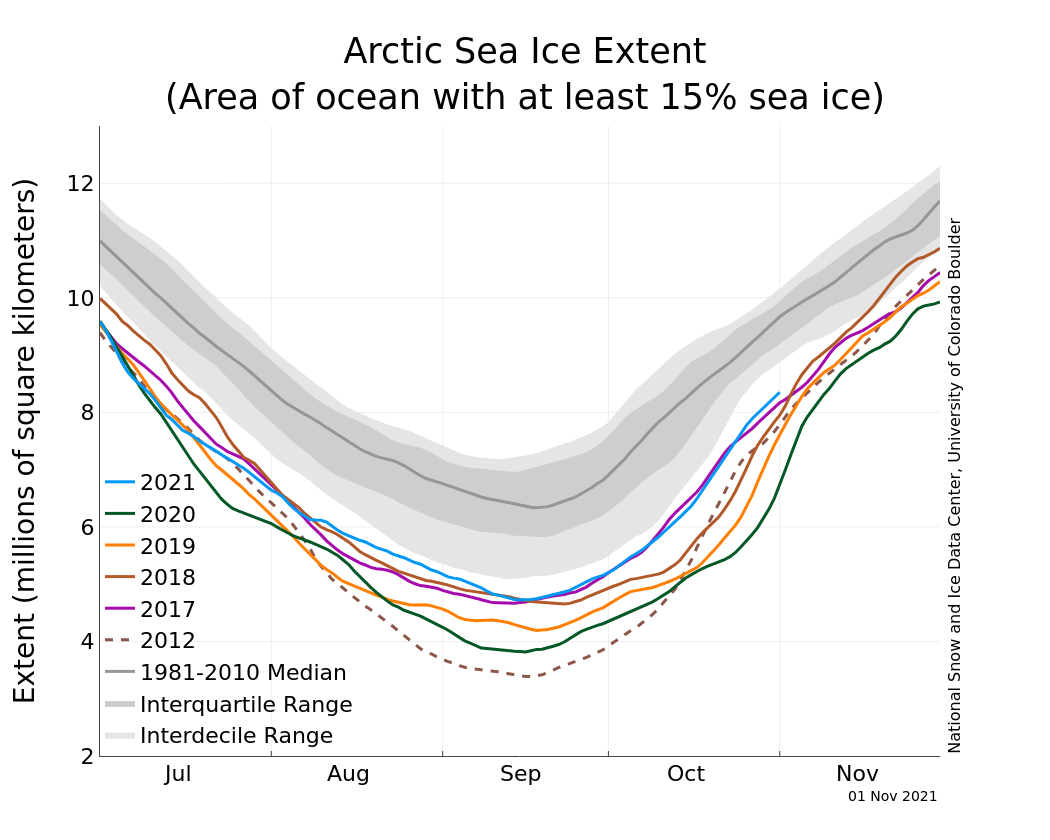
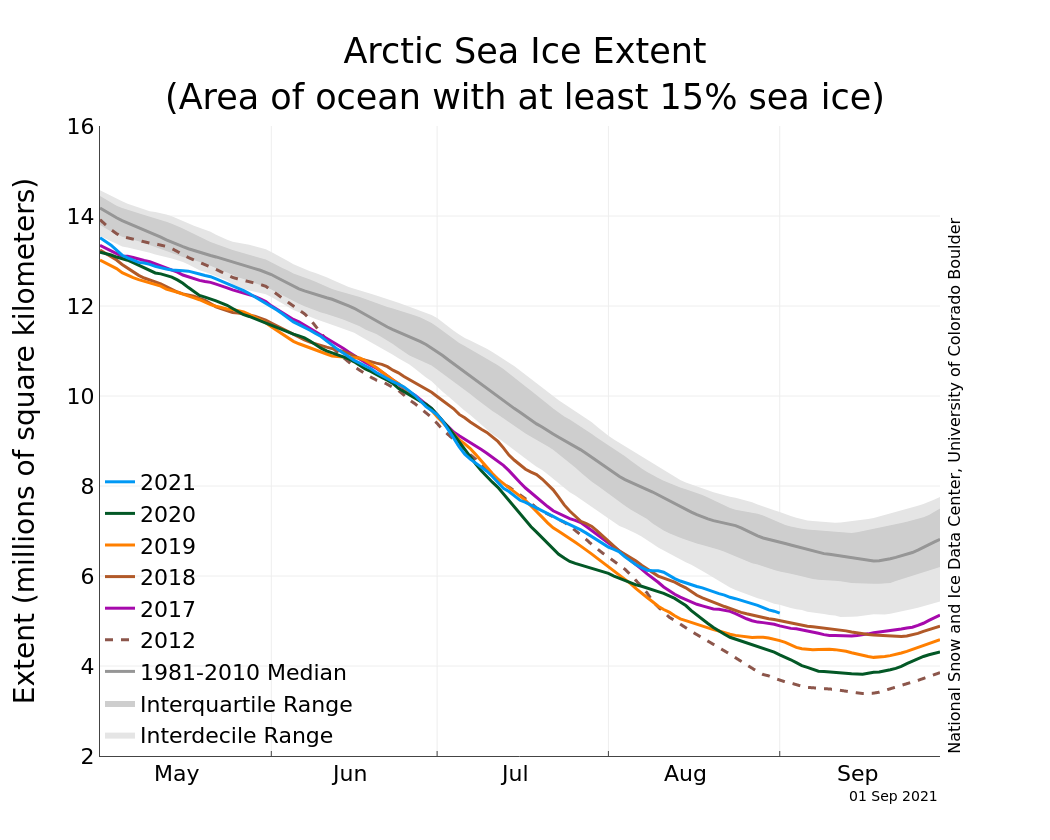
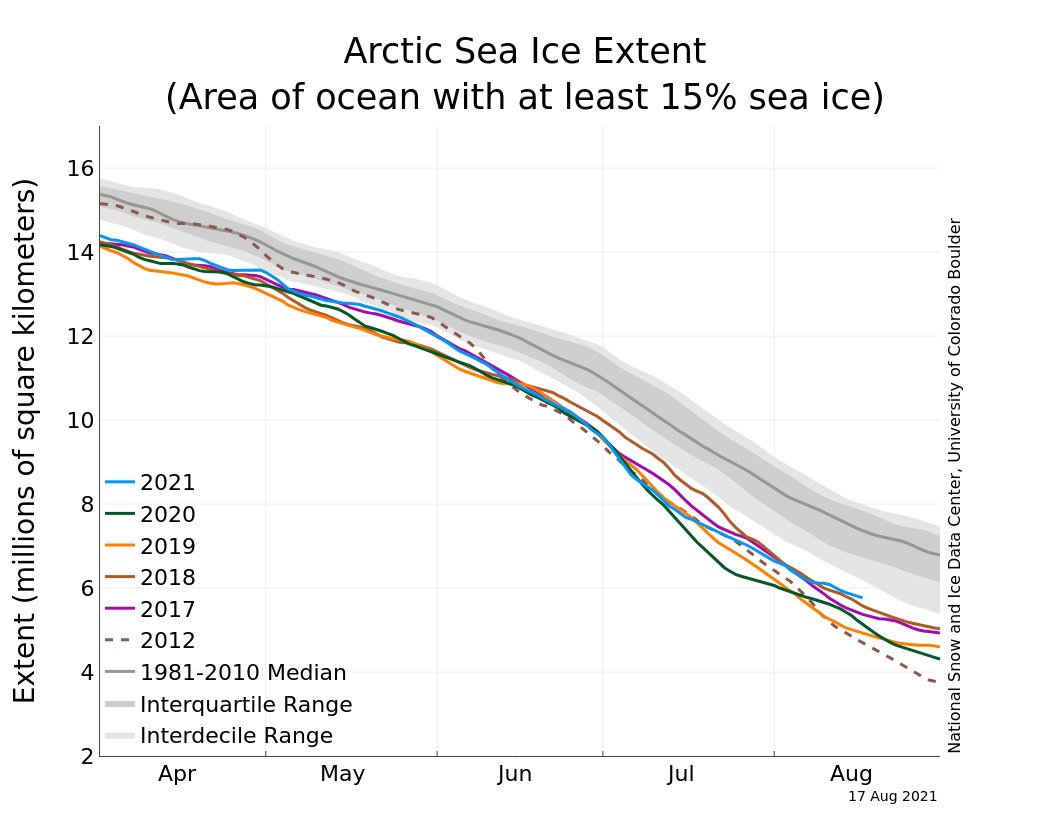
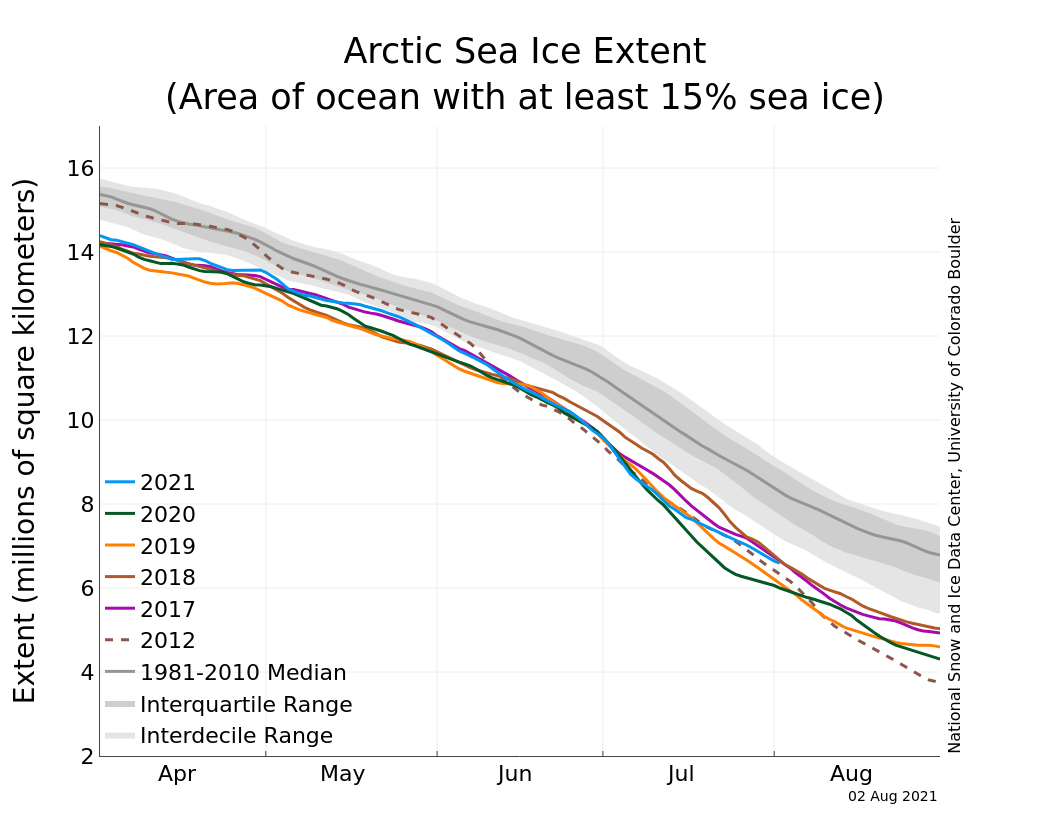
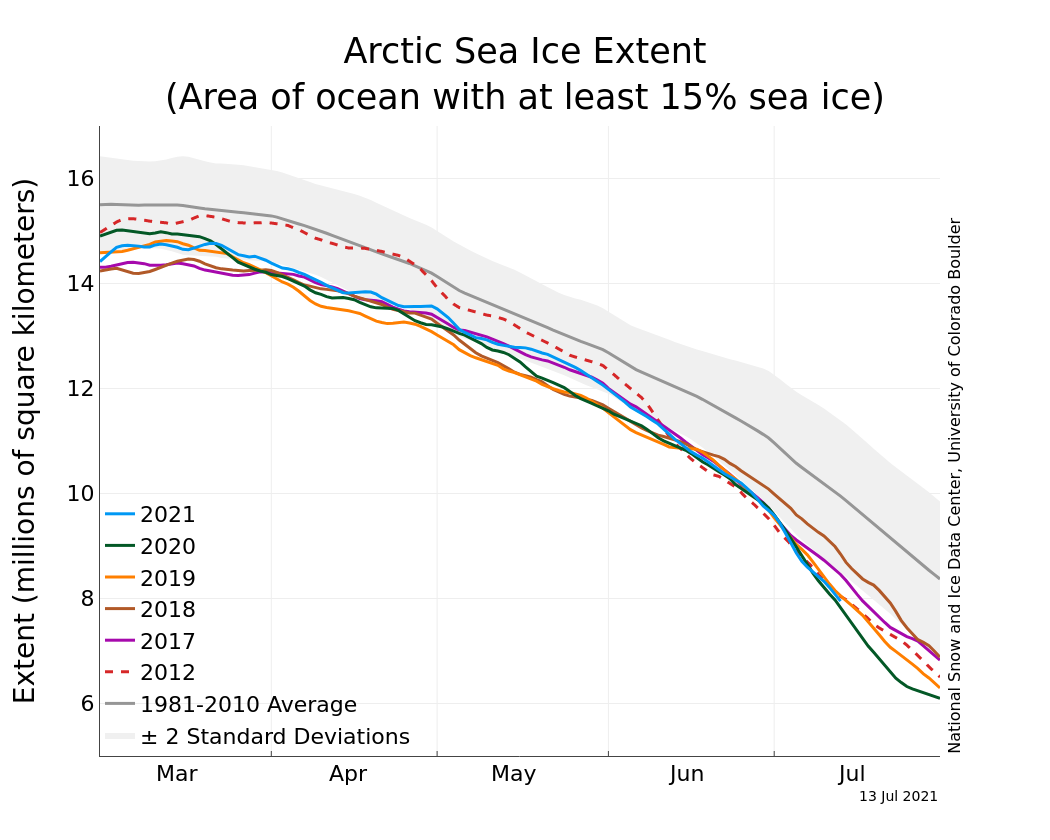
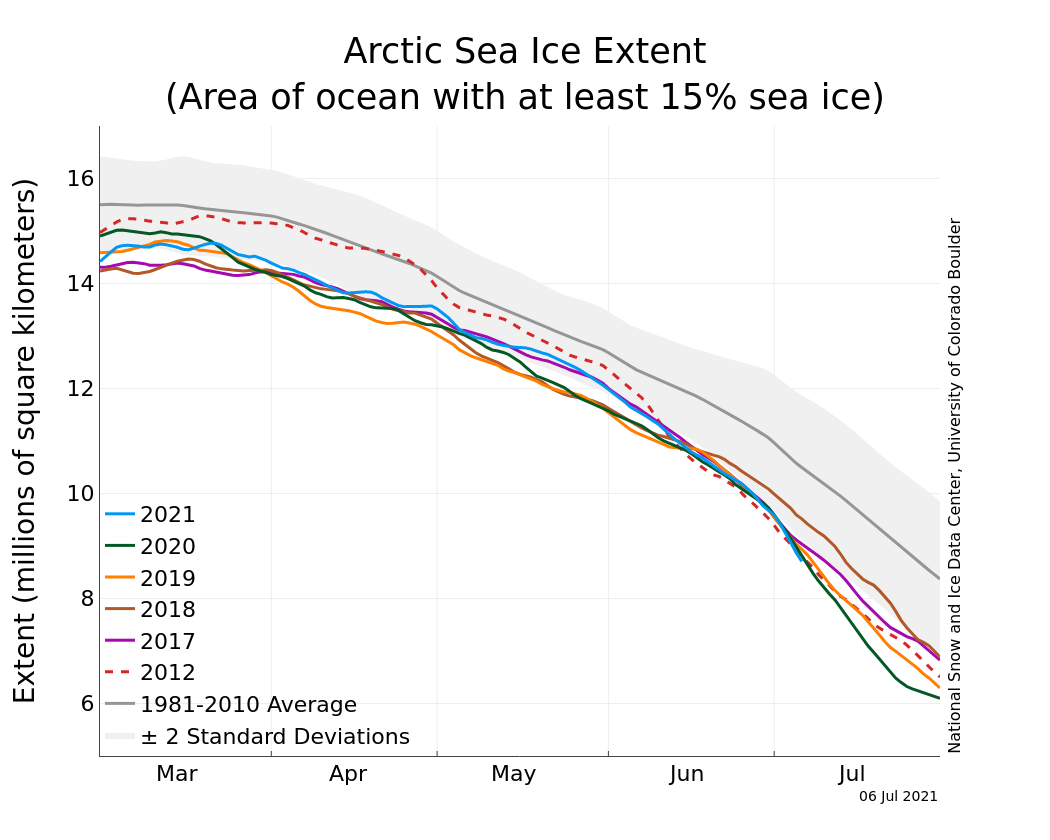
Figure 2a. The graph above shows Arctic sea ice extent as of October 5, 2021, along with daily ice extent data for four previous years and the record low year. 2021 is shown in blue, 2020 in green, 2019 in orange, 2018 in brown, 2017 in magenta, and 2012 in dashed red. The 1981 to 2010 median is in dark gray. The gray areas around the median line show the interquartile and interdecile ranges of the data. Sea Ice Index data.
Credit: National Snow and Ice Data Center
High-resolution image
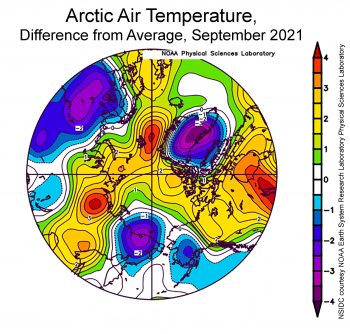
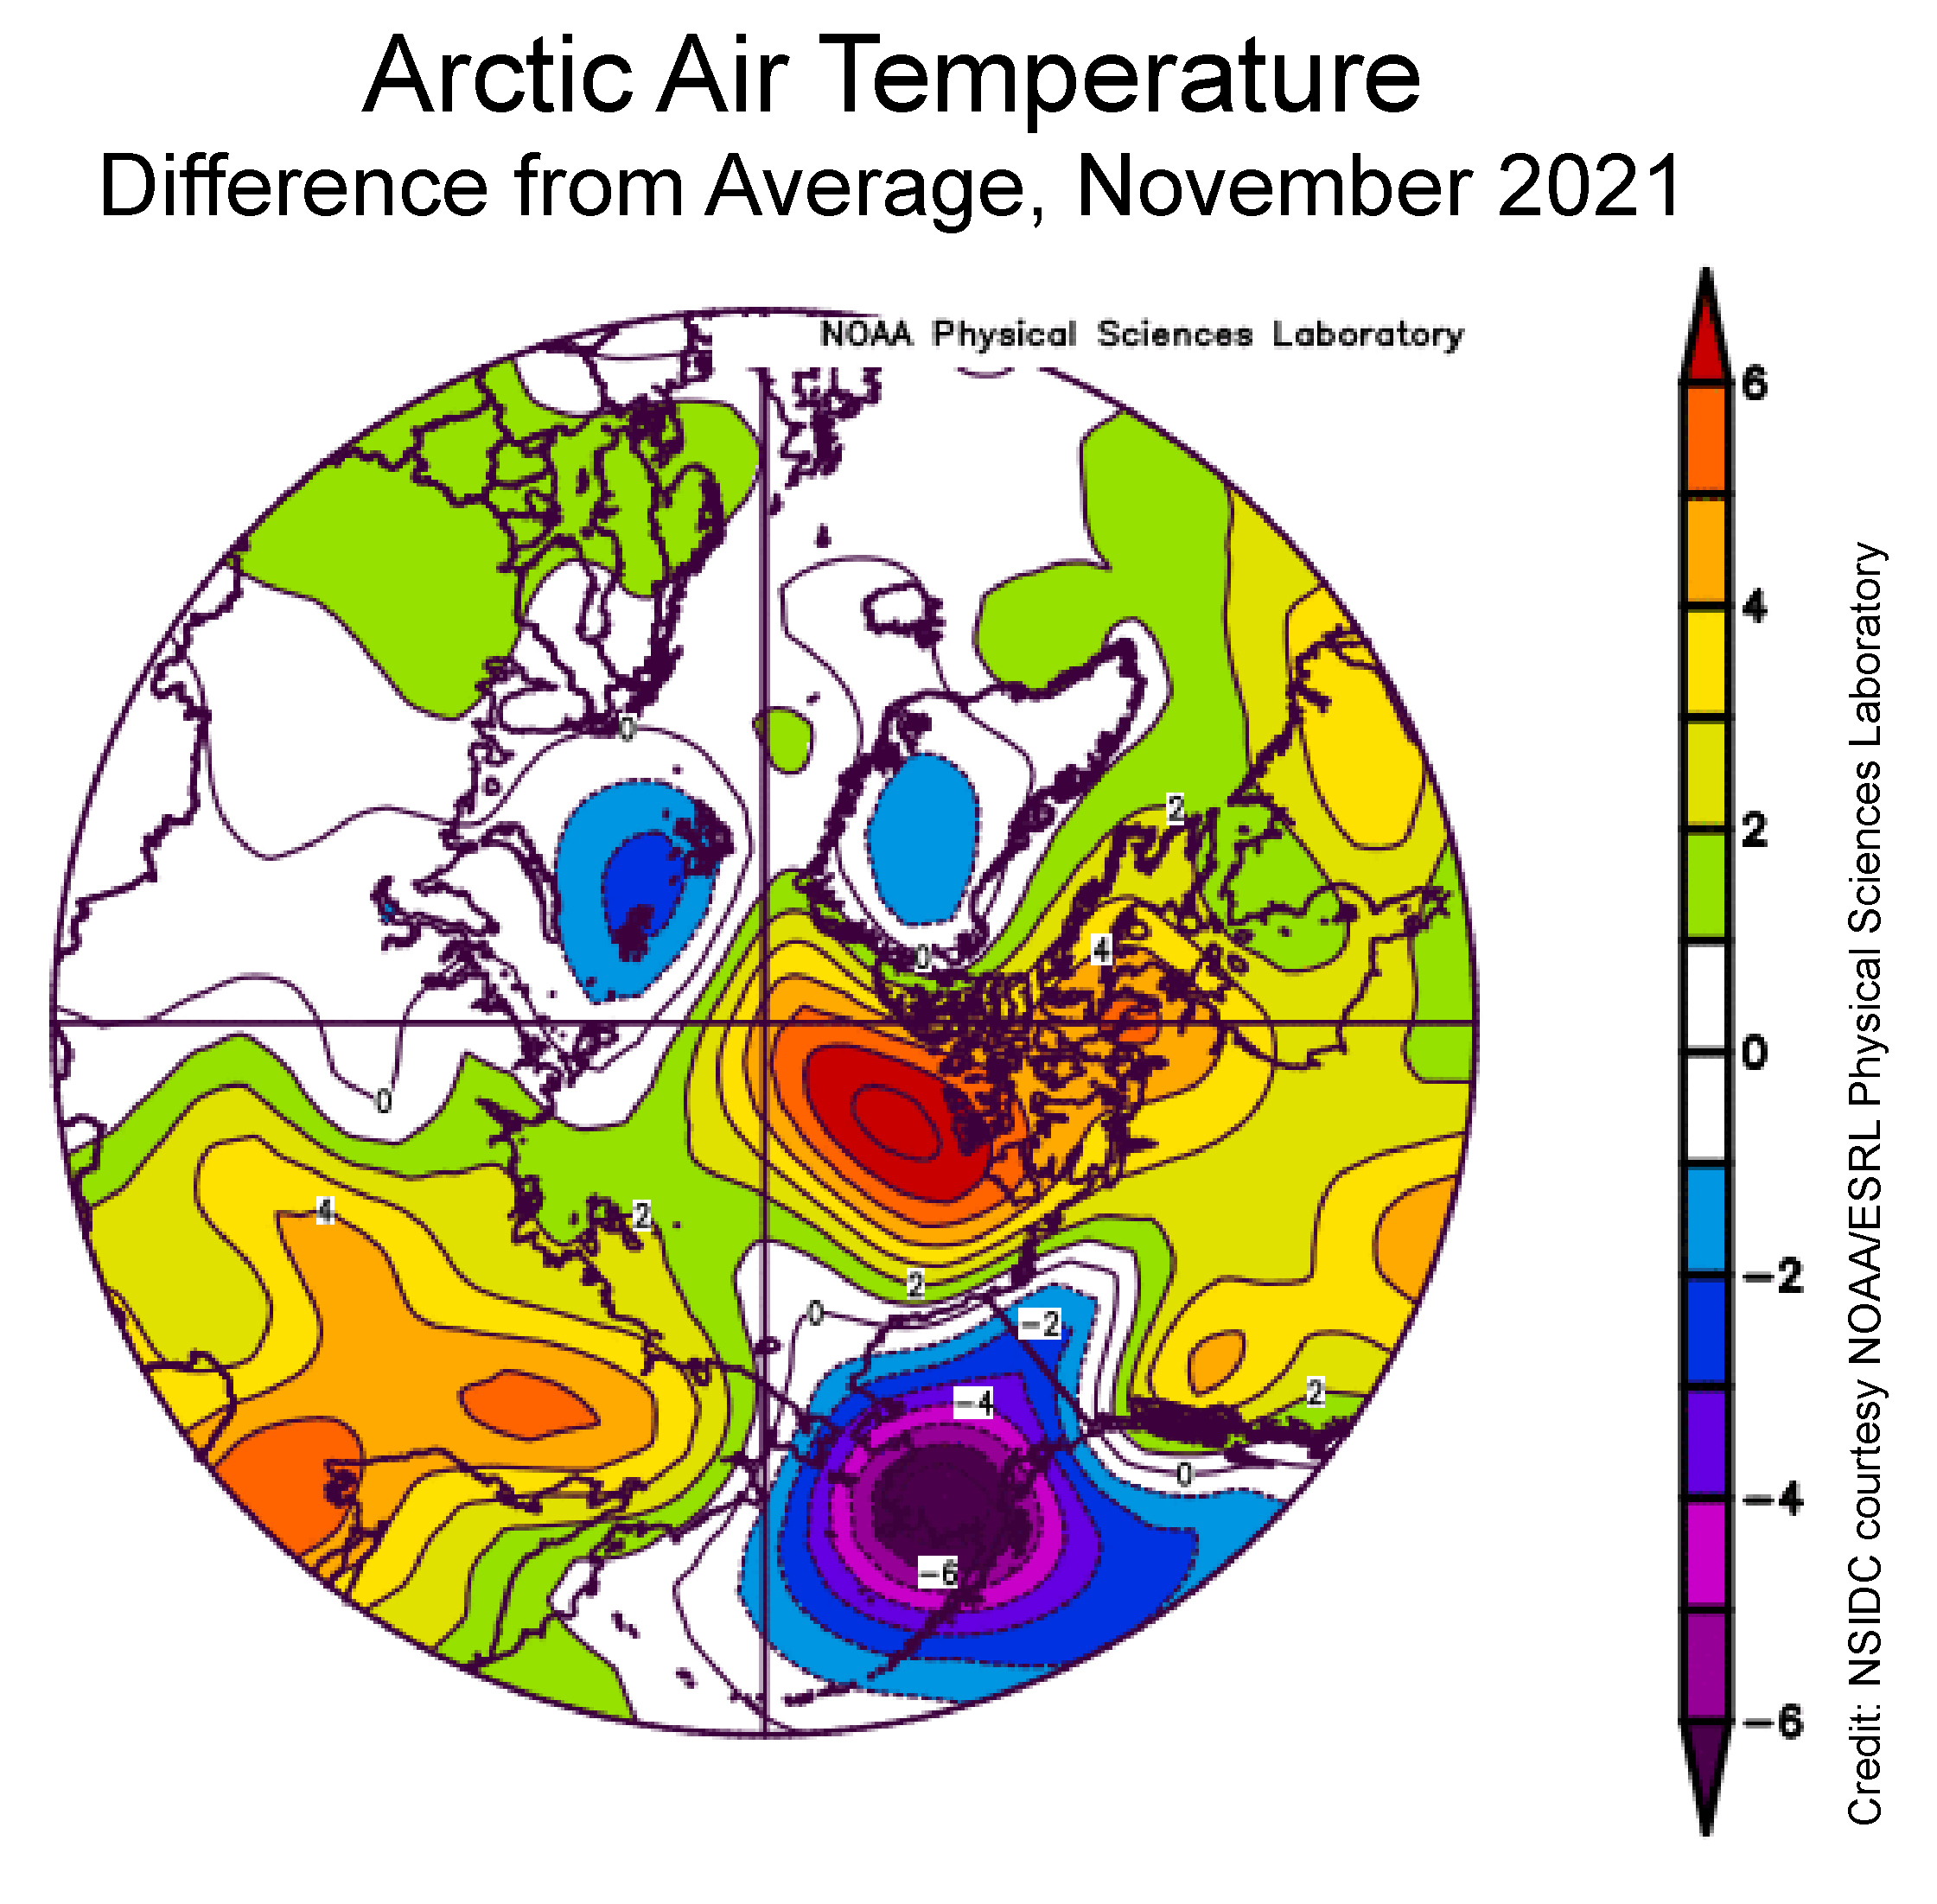
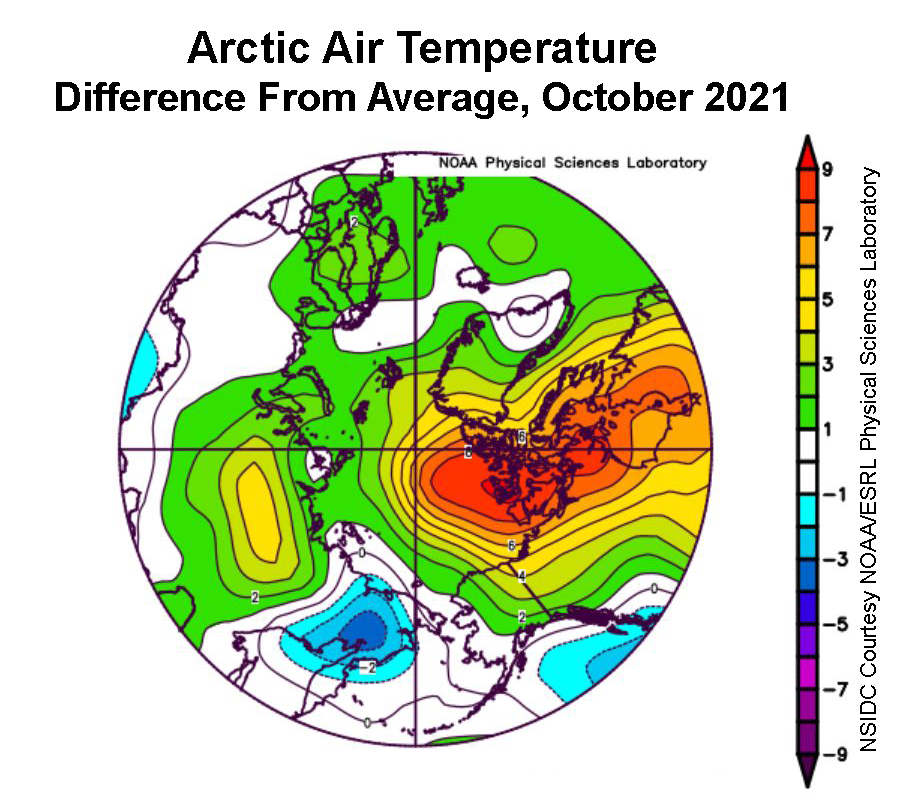
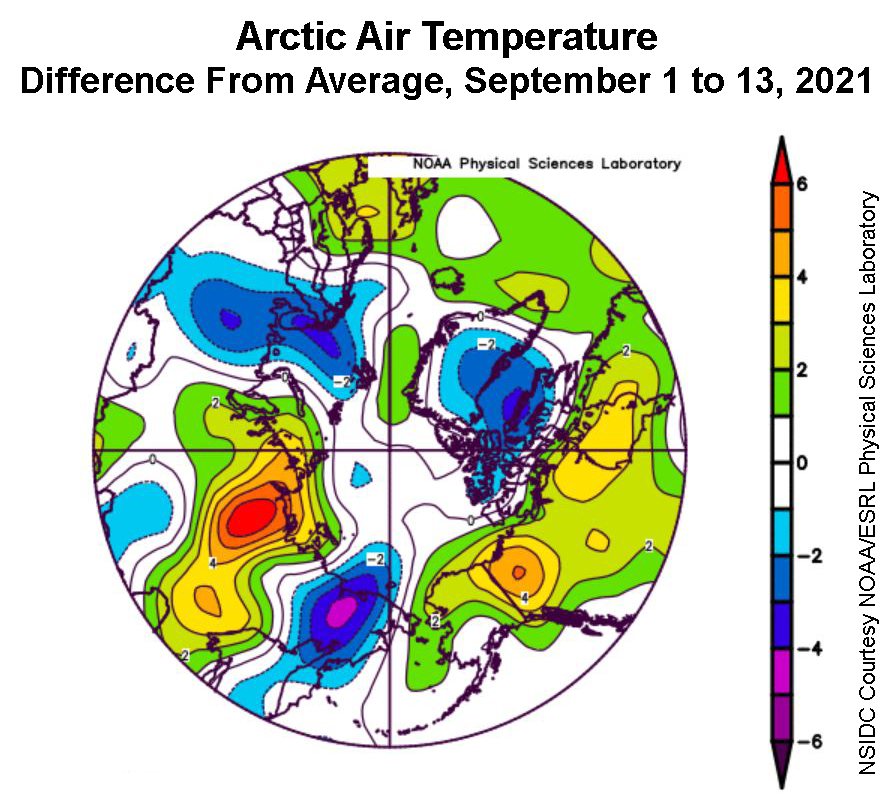
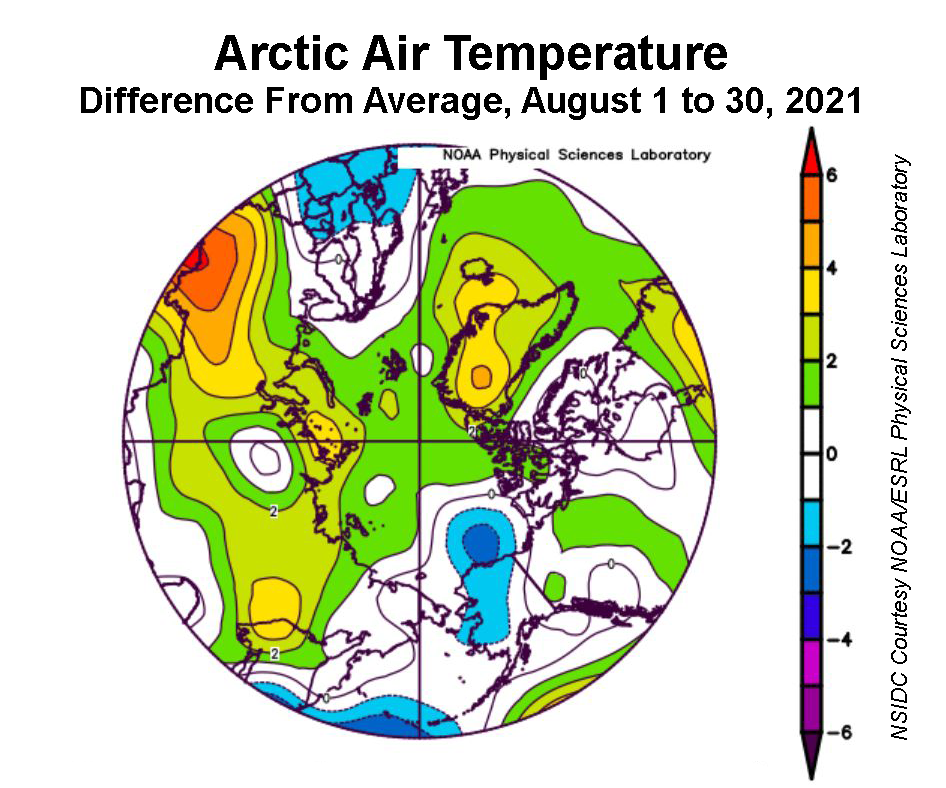
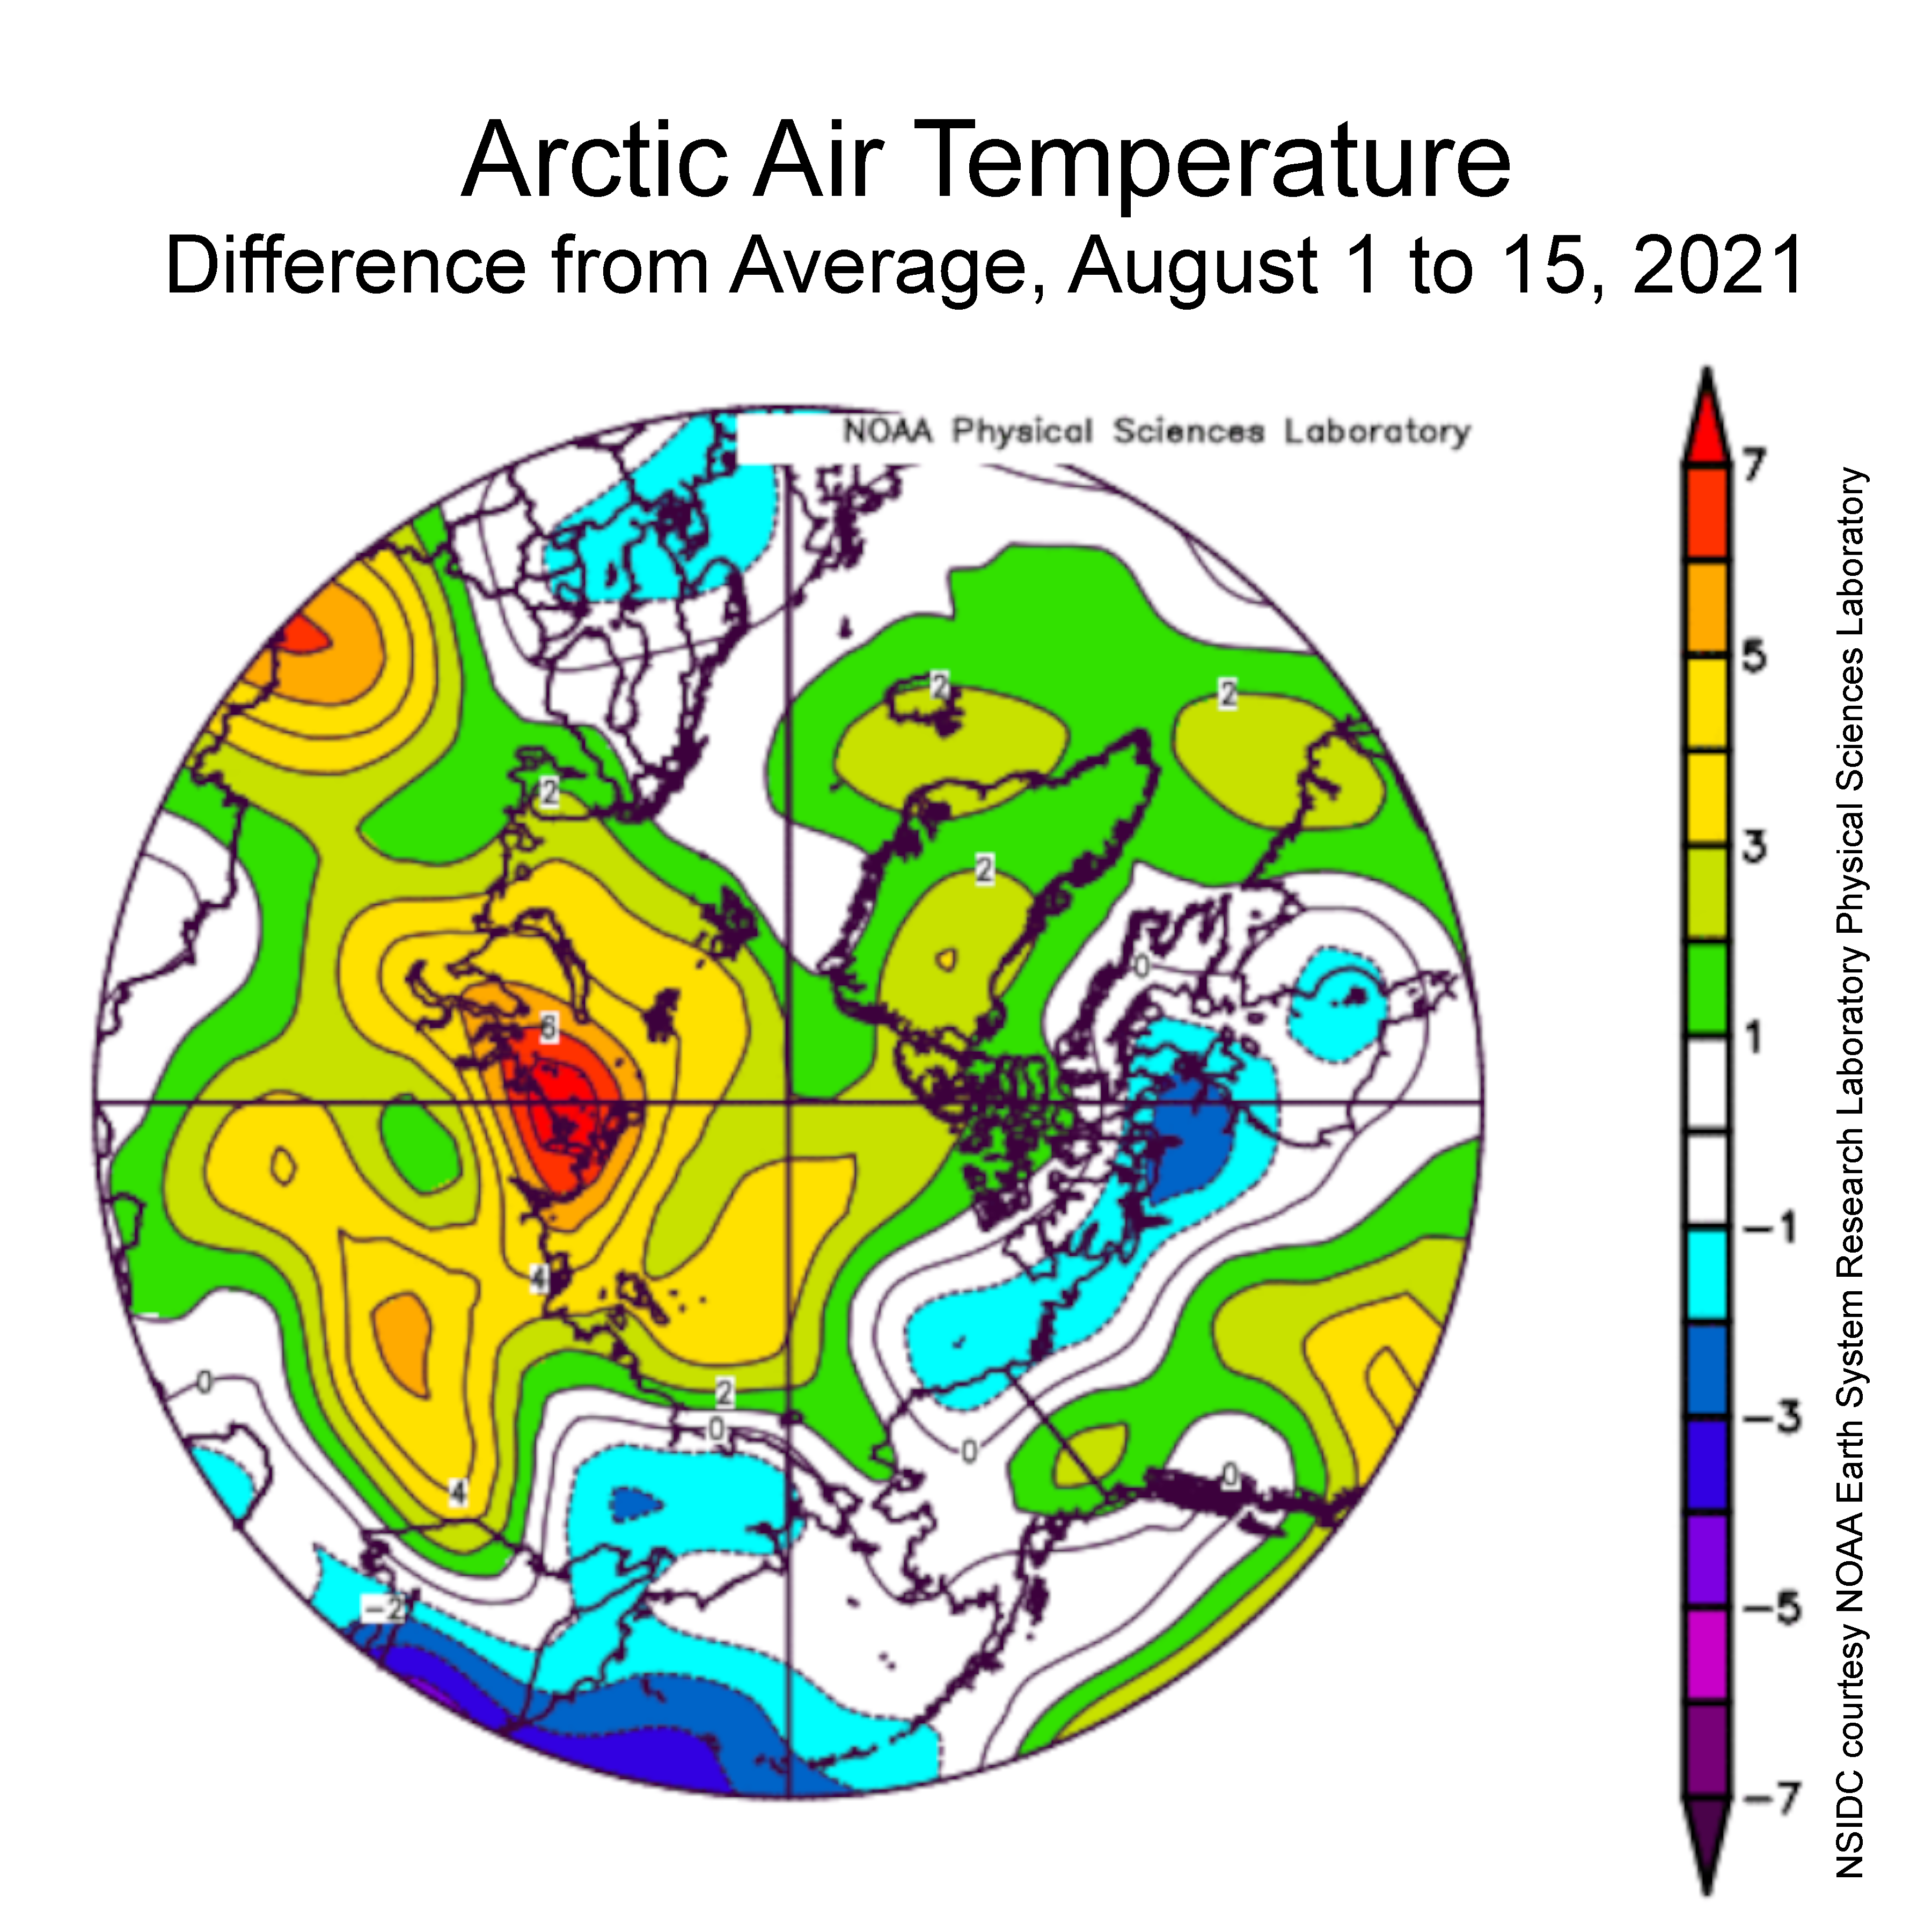
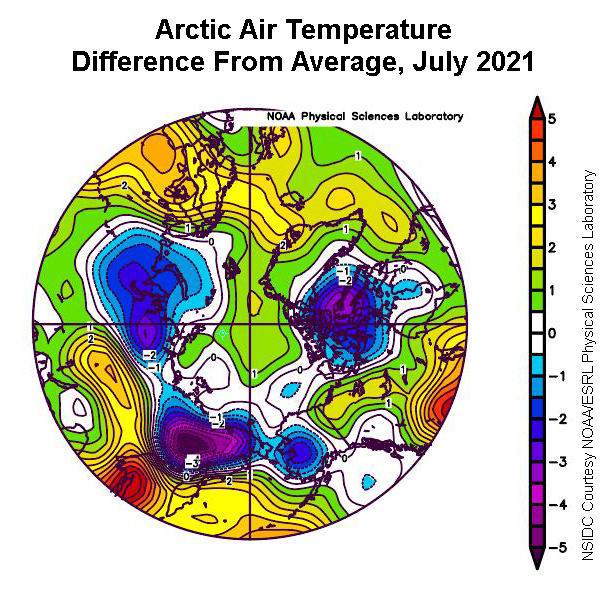
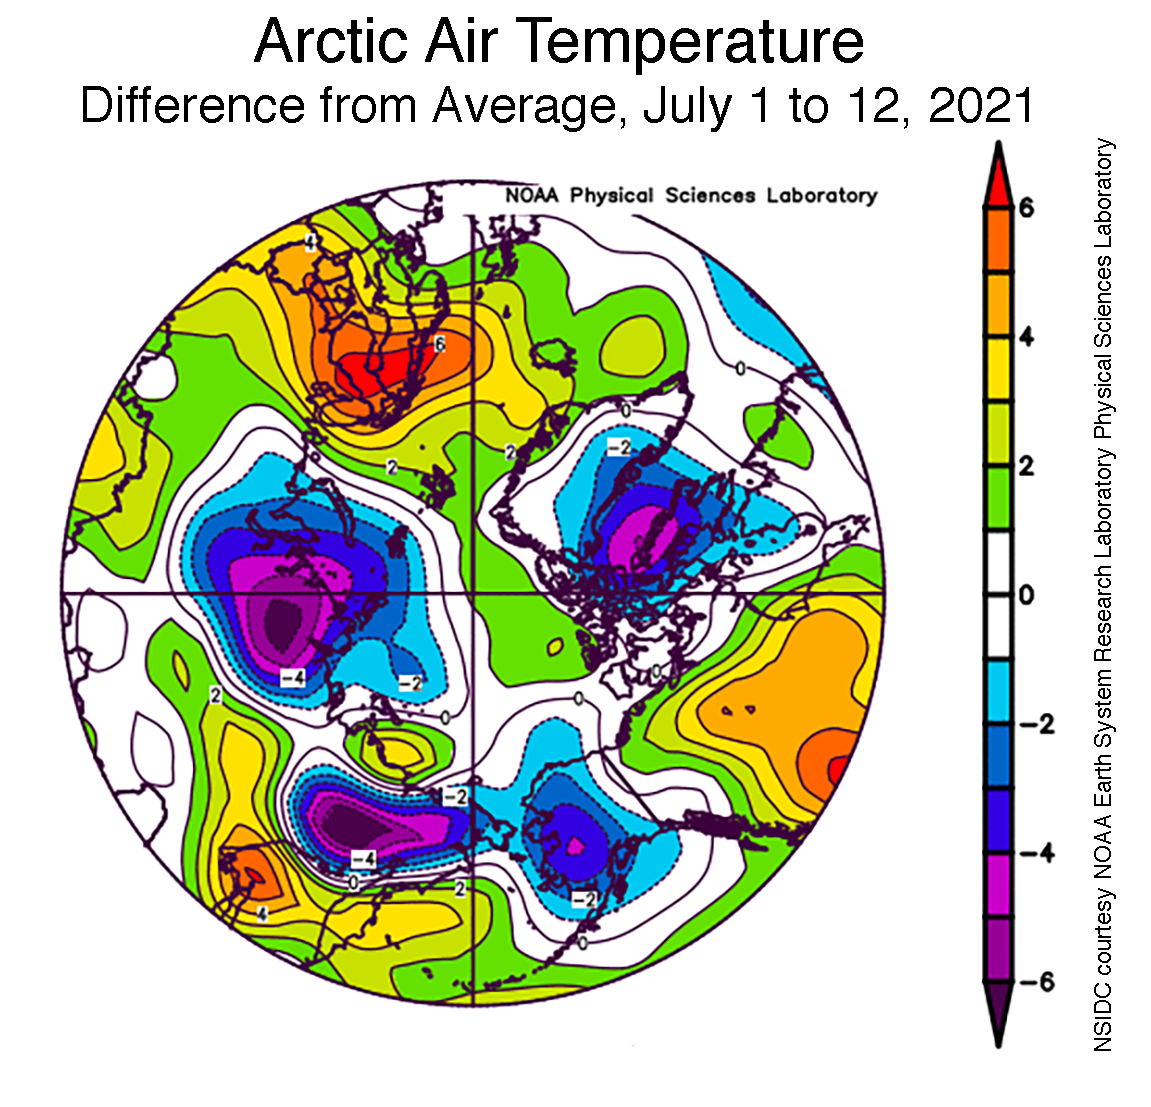
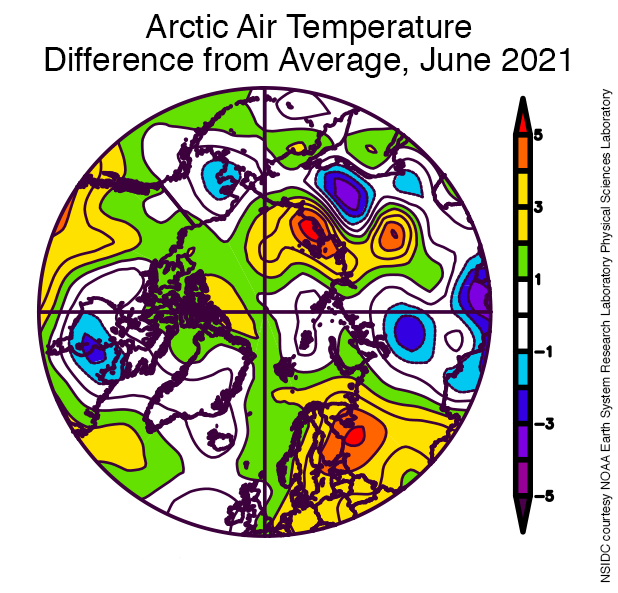
Figure 2b. This plot shows the departure from average air temperature in the Arctic at the 925 hPa level, in degrees Celsius, for September 2021. Yellows and reds indicate higher than average temperatures; blues and purples indicate lower than average temperatures.
Credit: NSIDC courtesy NOAA Earth System Research Laboratory Physical Sciences Laboratory
High-resolution image
After the minimum set on September 16, extent began rising fairly rapidly as the scattered open water areas in the Beaufort and Chukchi Seas began to fill in (Figure 2a). Ocean temperatures remained low in this region because of the late ice retreat that limited the amount of solar insolation absorbed by the ocean. The cooler ocean allowed a quick freeze up as air temperatures dropped below freezing. Overall, extent increased 430,000 square kilometers (166,000 square miles) between the 16 and the end of the month, about the same as the increase for the 1981 to 2010 average.
During September, air temperatures at the 925 mb (about 2,500 feet above the surface) were higher than average over most of the Arctic Ocean (Figure 2b). Temperatures were up to 4 degrees Celsius (7 degrees Fahrenheit) above average in the East Greenland Sea, likely reflecting the unusual lack of ice in the region, allowing ocean heat to warm the lower atmosphere. The one notable cold region was in the East Siberian Sea; temperatures in the last two weeks of September were 3 to 4 degrees Celsius (5 to 7 degrees Fahrenheit) below average.
September 2021 compared to previous years
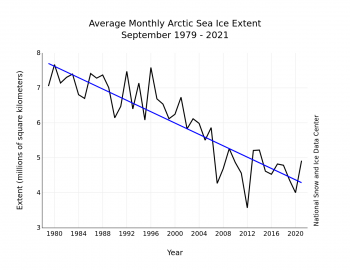
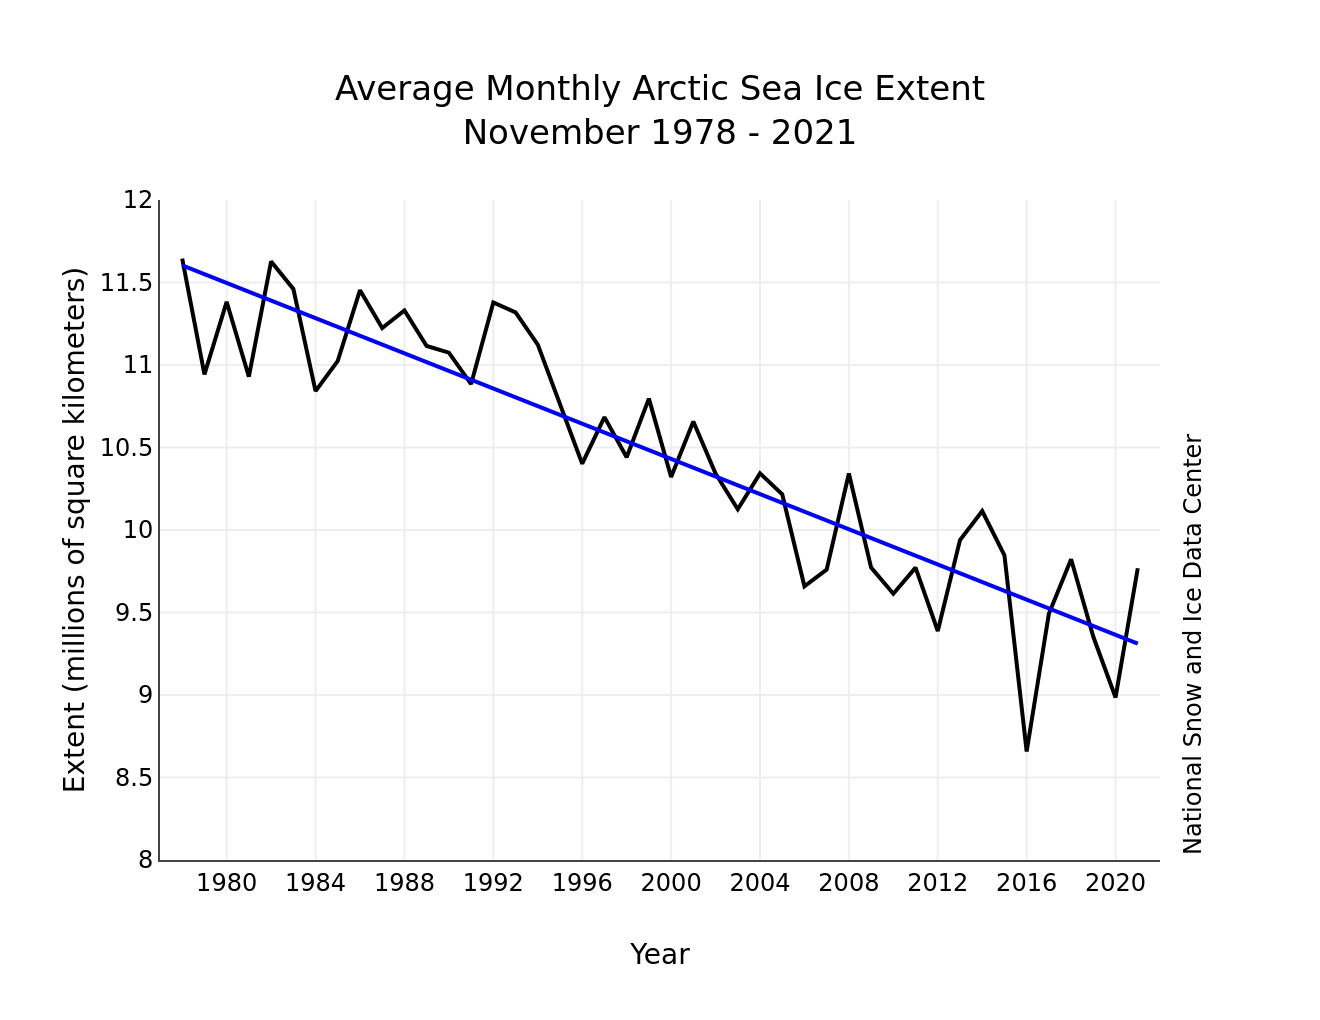
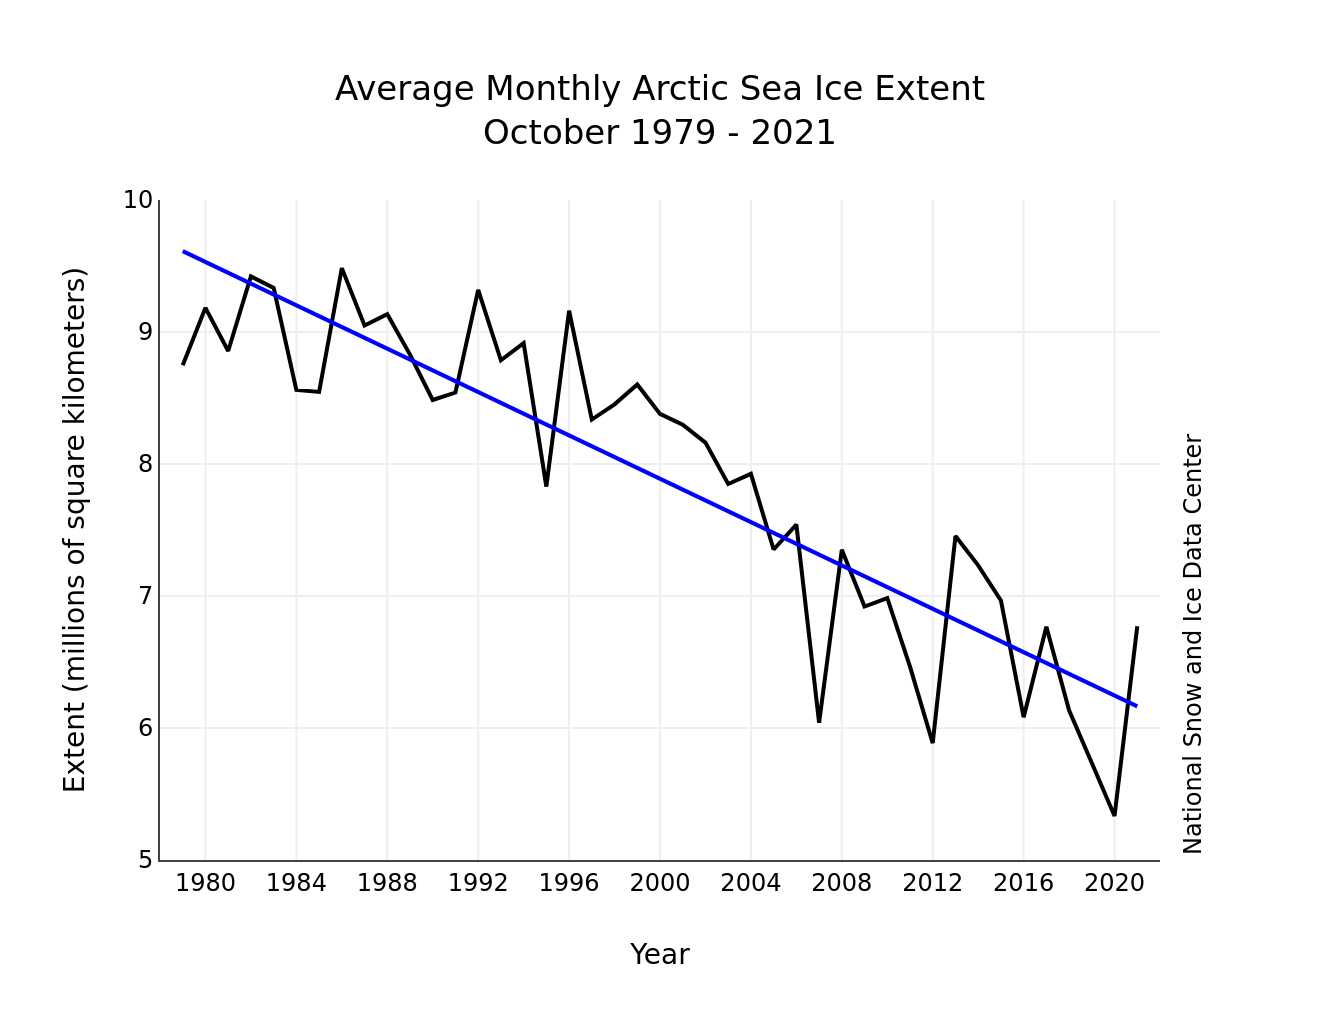
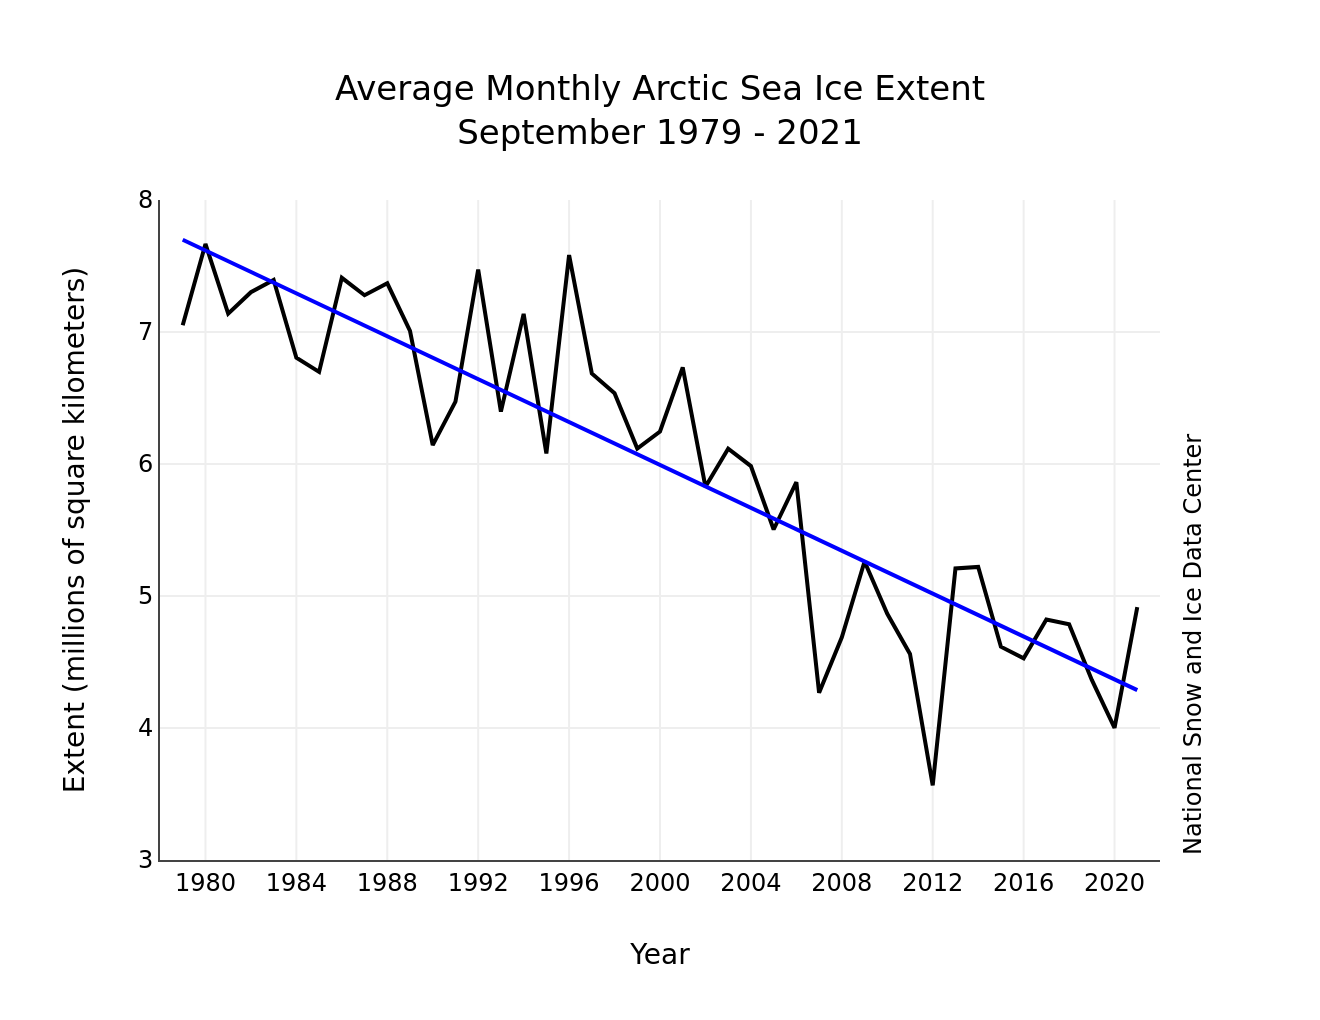
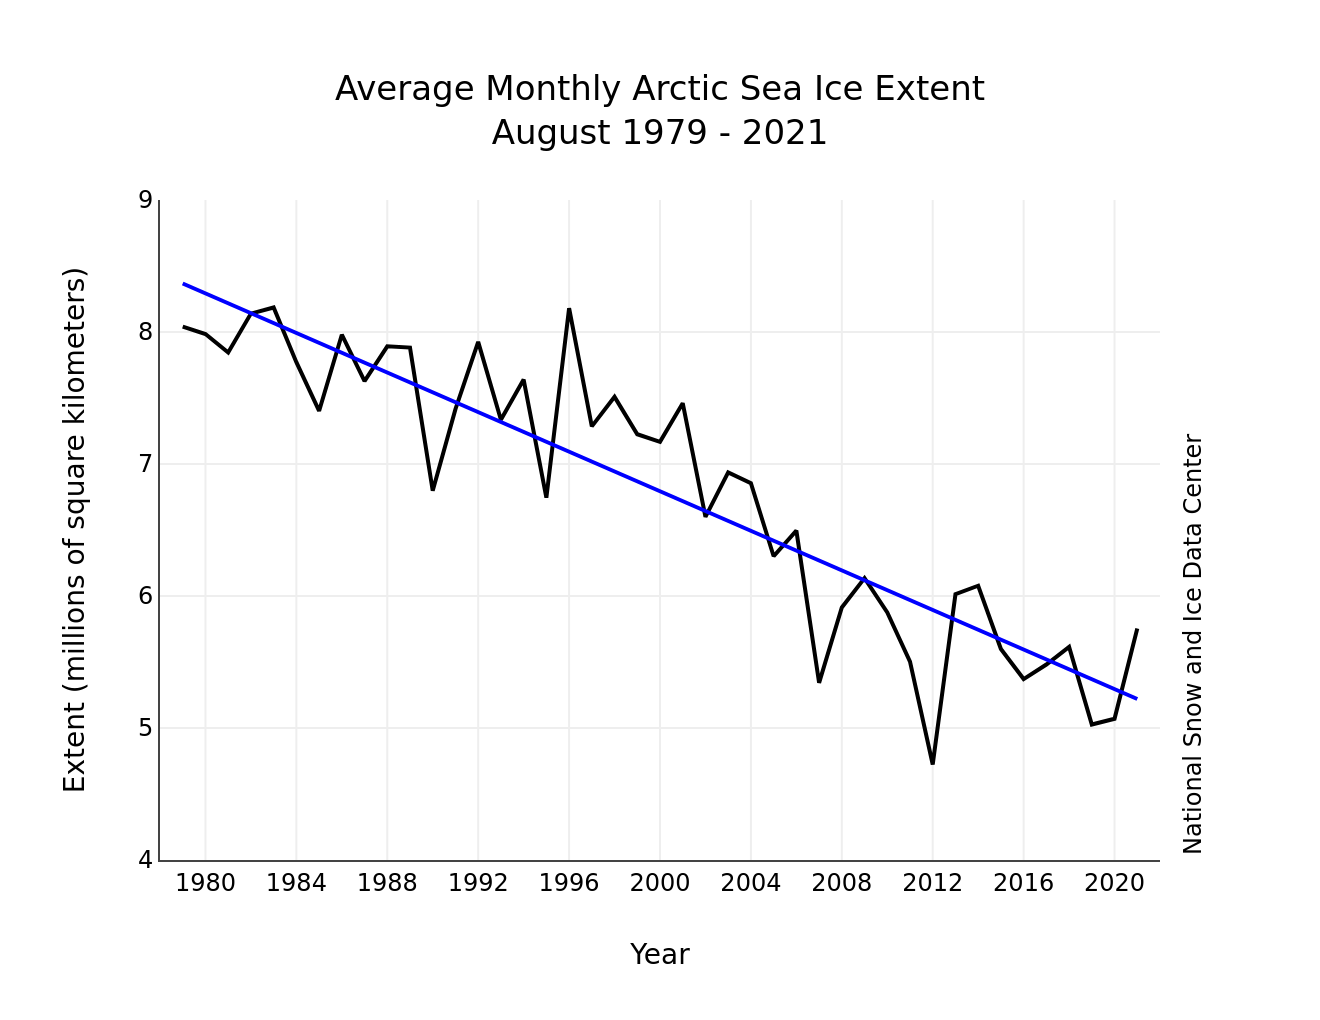
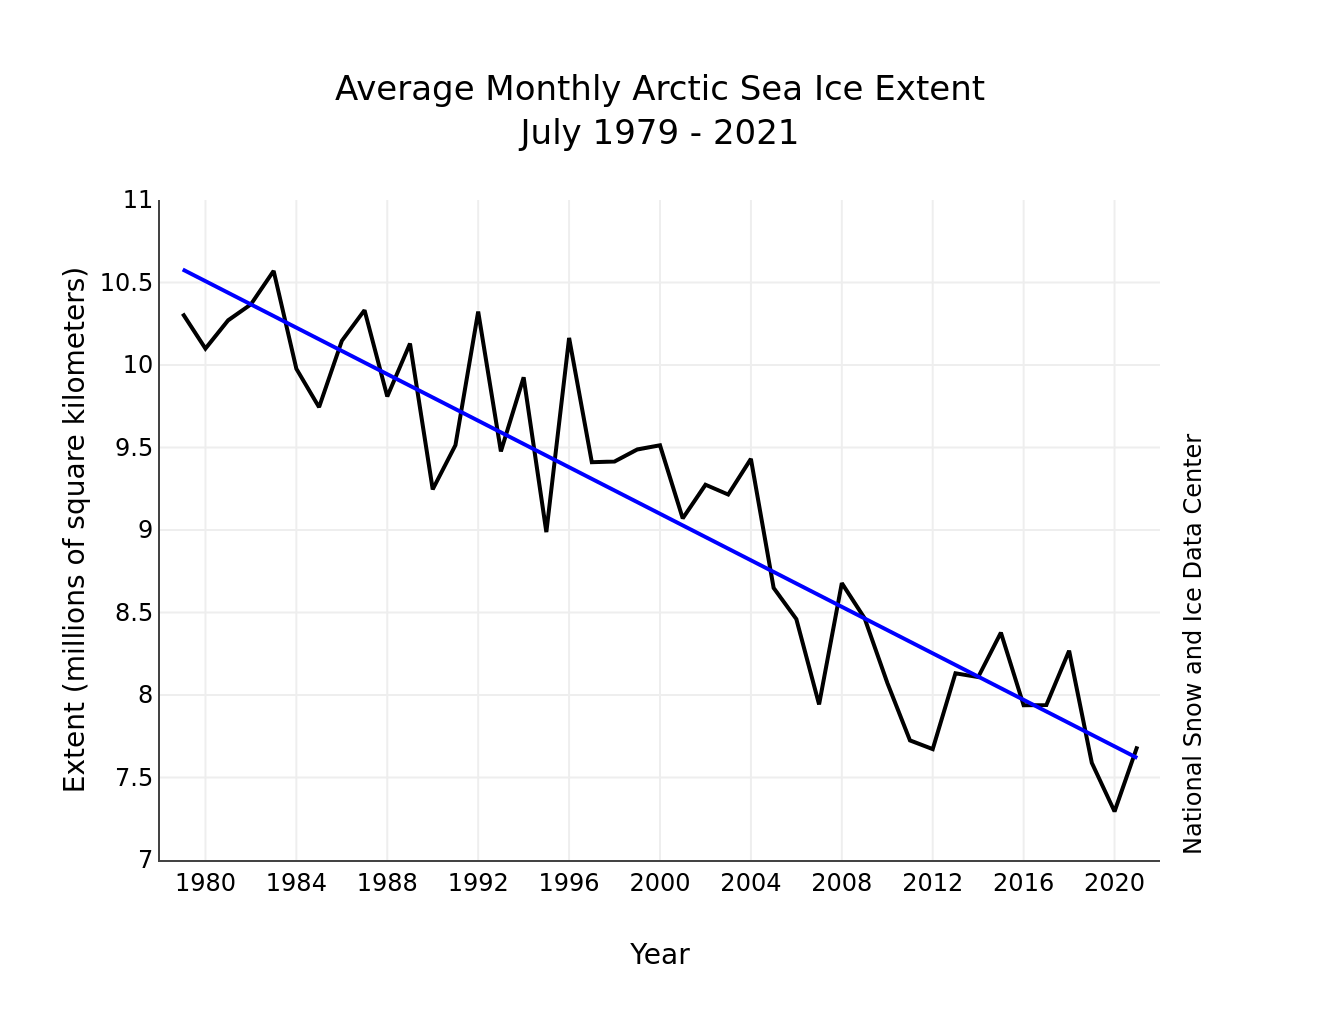
Figure 3. Monthly September ice extent for 1979 to 2021 shows a decline of 12.7 percent per decade.
Credit: National Snow and Ice Data Center
High-resolution image
The downward linear trend in September sea ice extent over the satellite records is 81,200 square kilometers (31,400 square miles) per year, or 12.7 percent per decade relative to the 1981 to 2010 average (Figure 3). September marks the month of the largest linear trend in ice extent, both in absolute terms and percentage loss. Overall, since 1979, September has lost 3.49 million square kilometers (1.35 million square miles) of ice, based on the linear trend values. This is equivalent to about twice the size of Alaska.
There was little net change in extent over the month of September—extent declined during the first half of the month and then increased in the second half. This year, extent was 5.17 million square kilometers (2.00 million square miles) on September 1 and 5.15 million square kilometers (1.99 million square miles) on September 30.
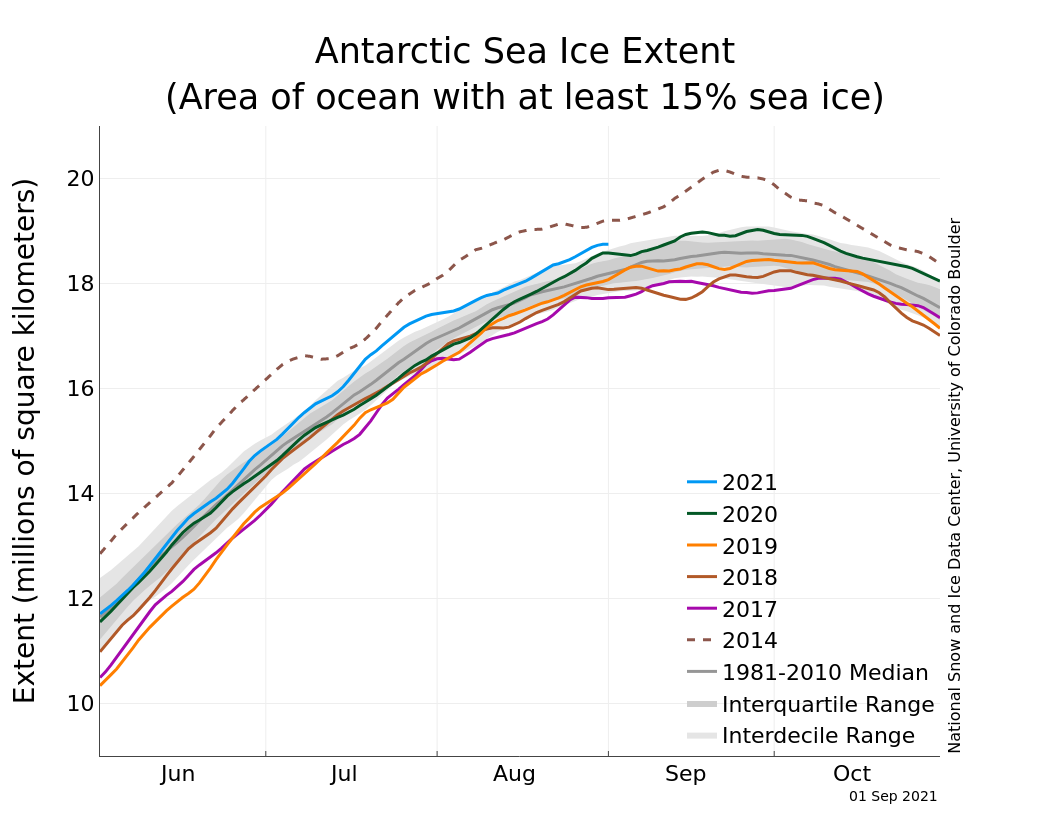
Antarctica’s unusual sea ice maximum
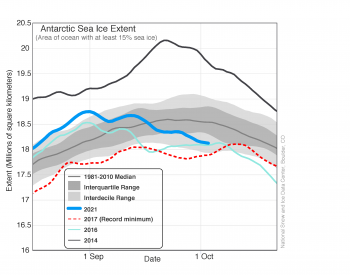
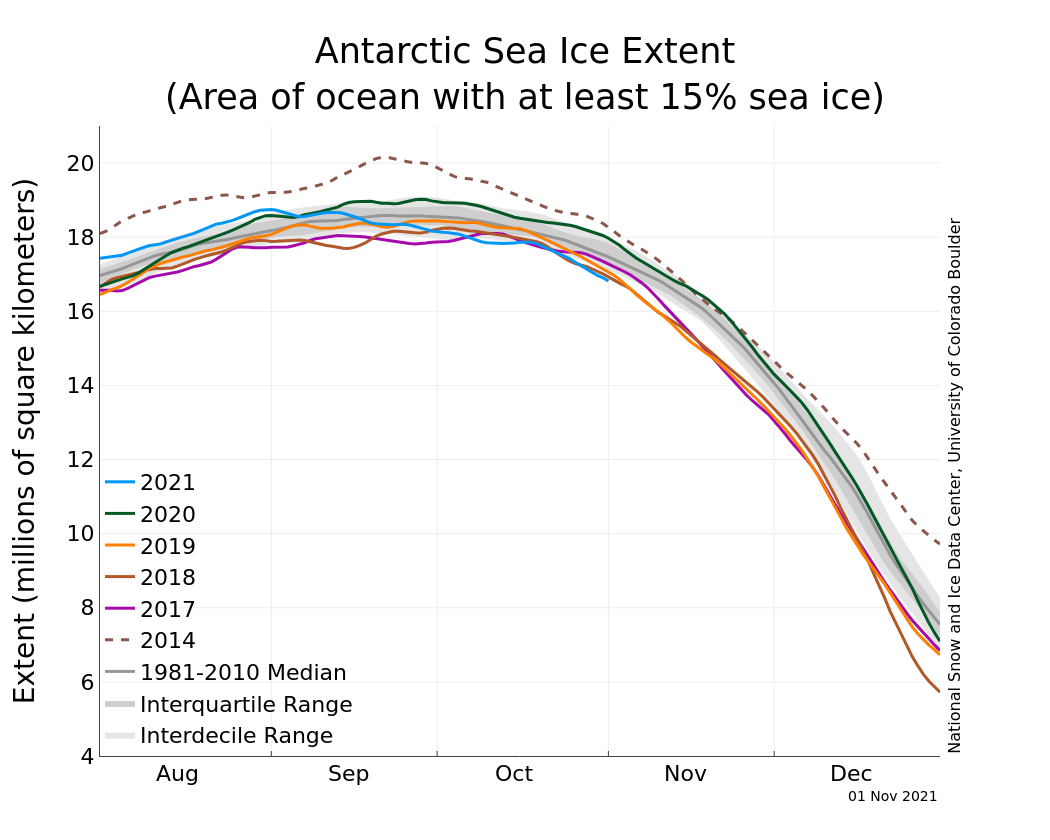
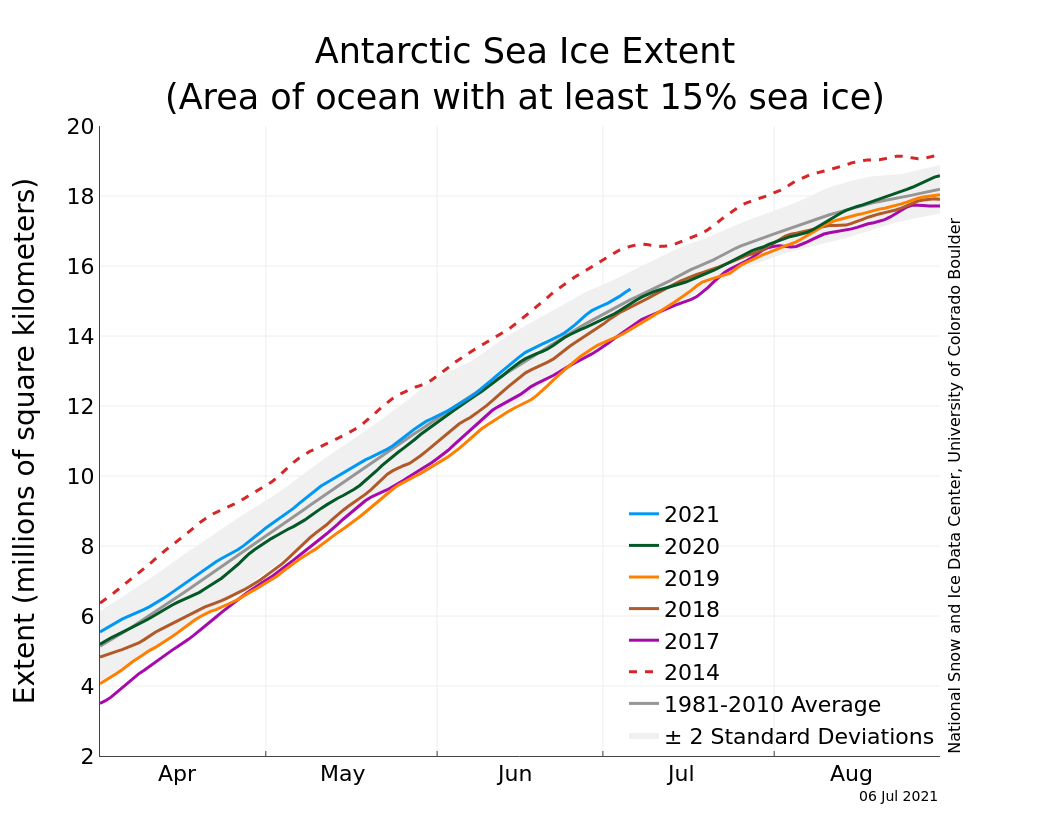
Figure 4a. The graph above shows Antarctic sea ice extent as of October 3, 2021, along with daily ice extent data for three previous years including the record low year. 2021 is shown in blue, 2016 in green, 2014 in black, and 2017 in dashed red. The 1981 to 2010 median is in dark gray. The gray areas around the median line show the interquartile and interdecile ranges of the data. Sea Ice Index data.
Credit: National Snow and Ice Data Center
High-resolution image
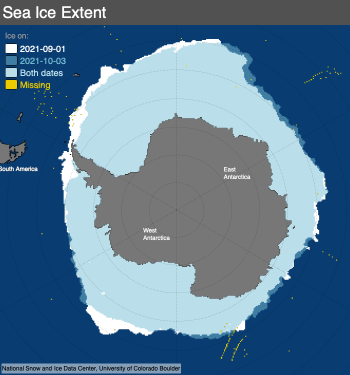
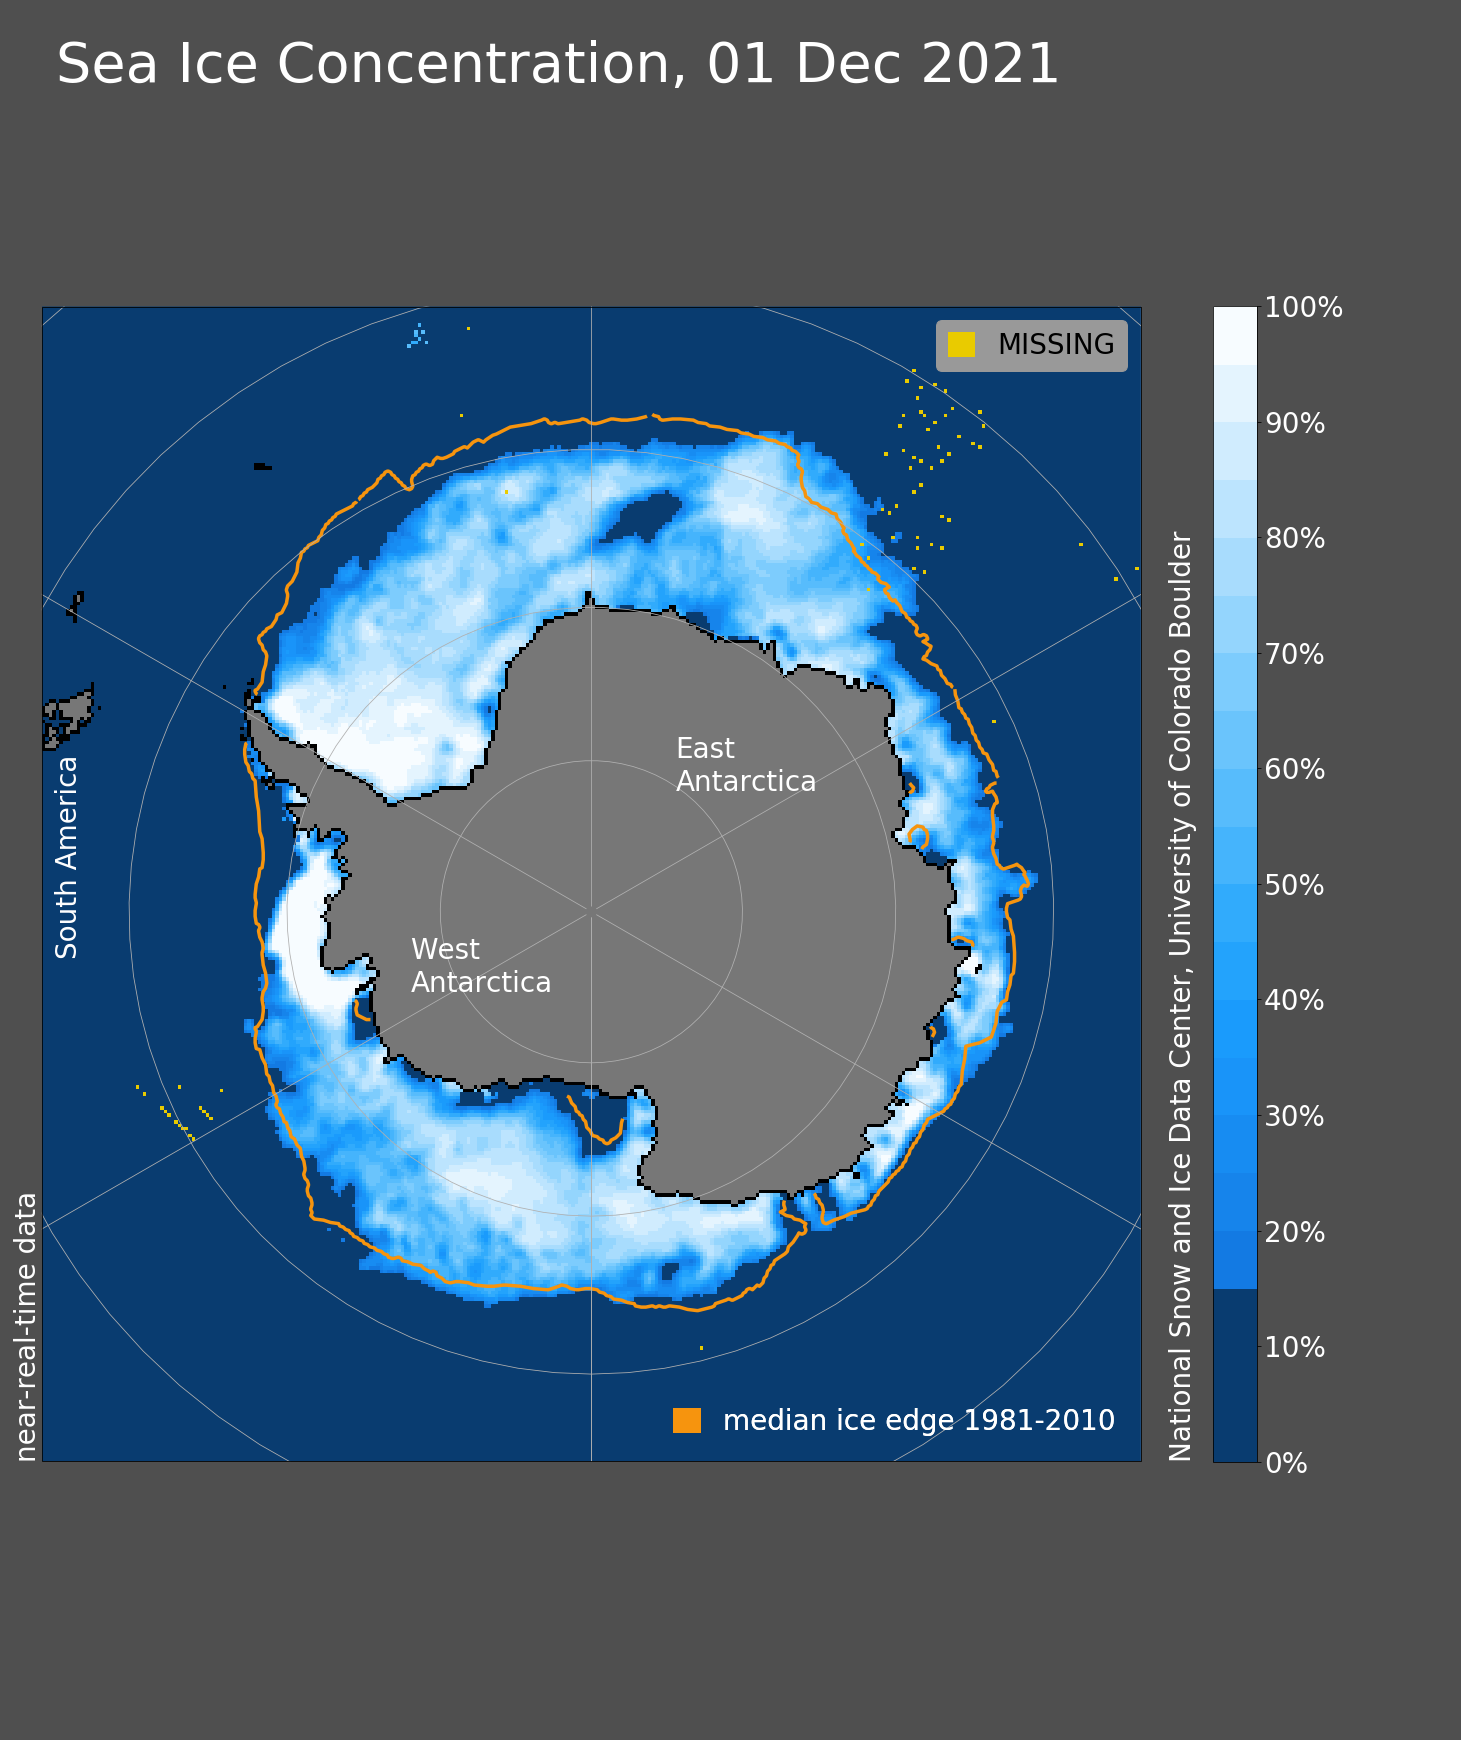
Figure 4b. This map compares Antarctic sea ice extent for September 1, 2021, with October 3, 2021. Light blue shading indicates the region where ice occurred on both dates, while white and medium blue areas show ice cover unique to September 1, 2021 and October 3, 2021, respectively. Sea Ice Index data. About the data
Credit: National Snow and Ice Data Center
High-resolution image
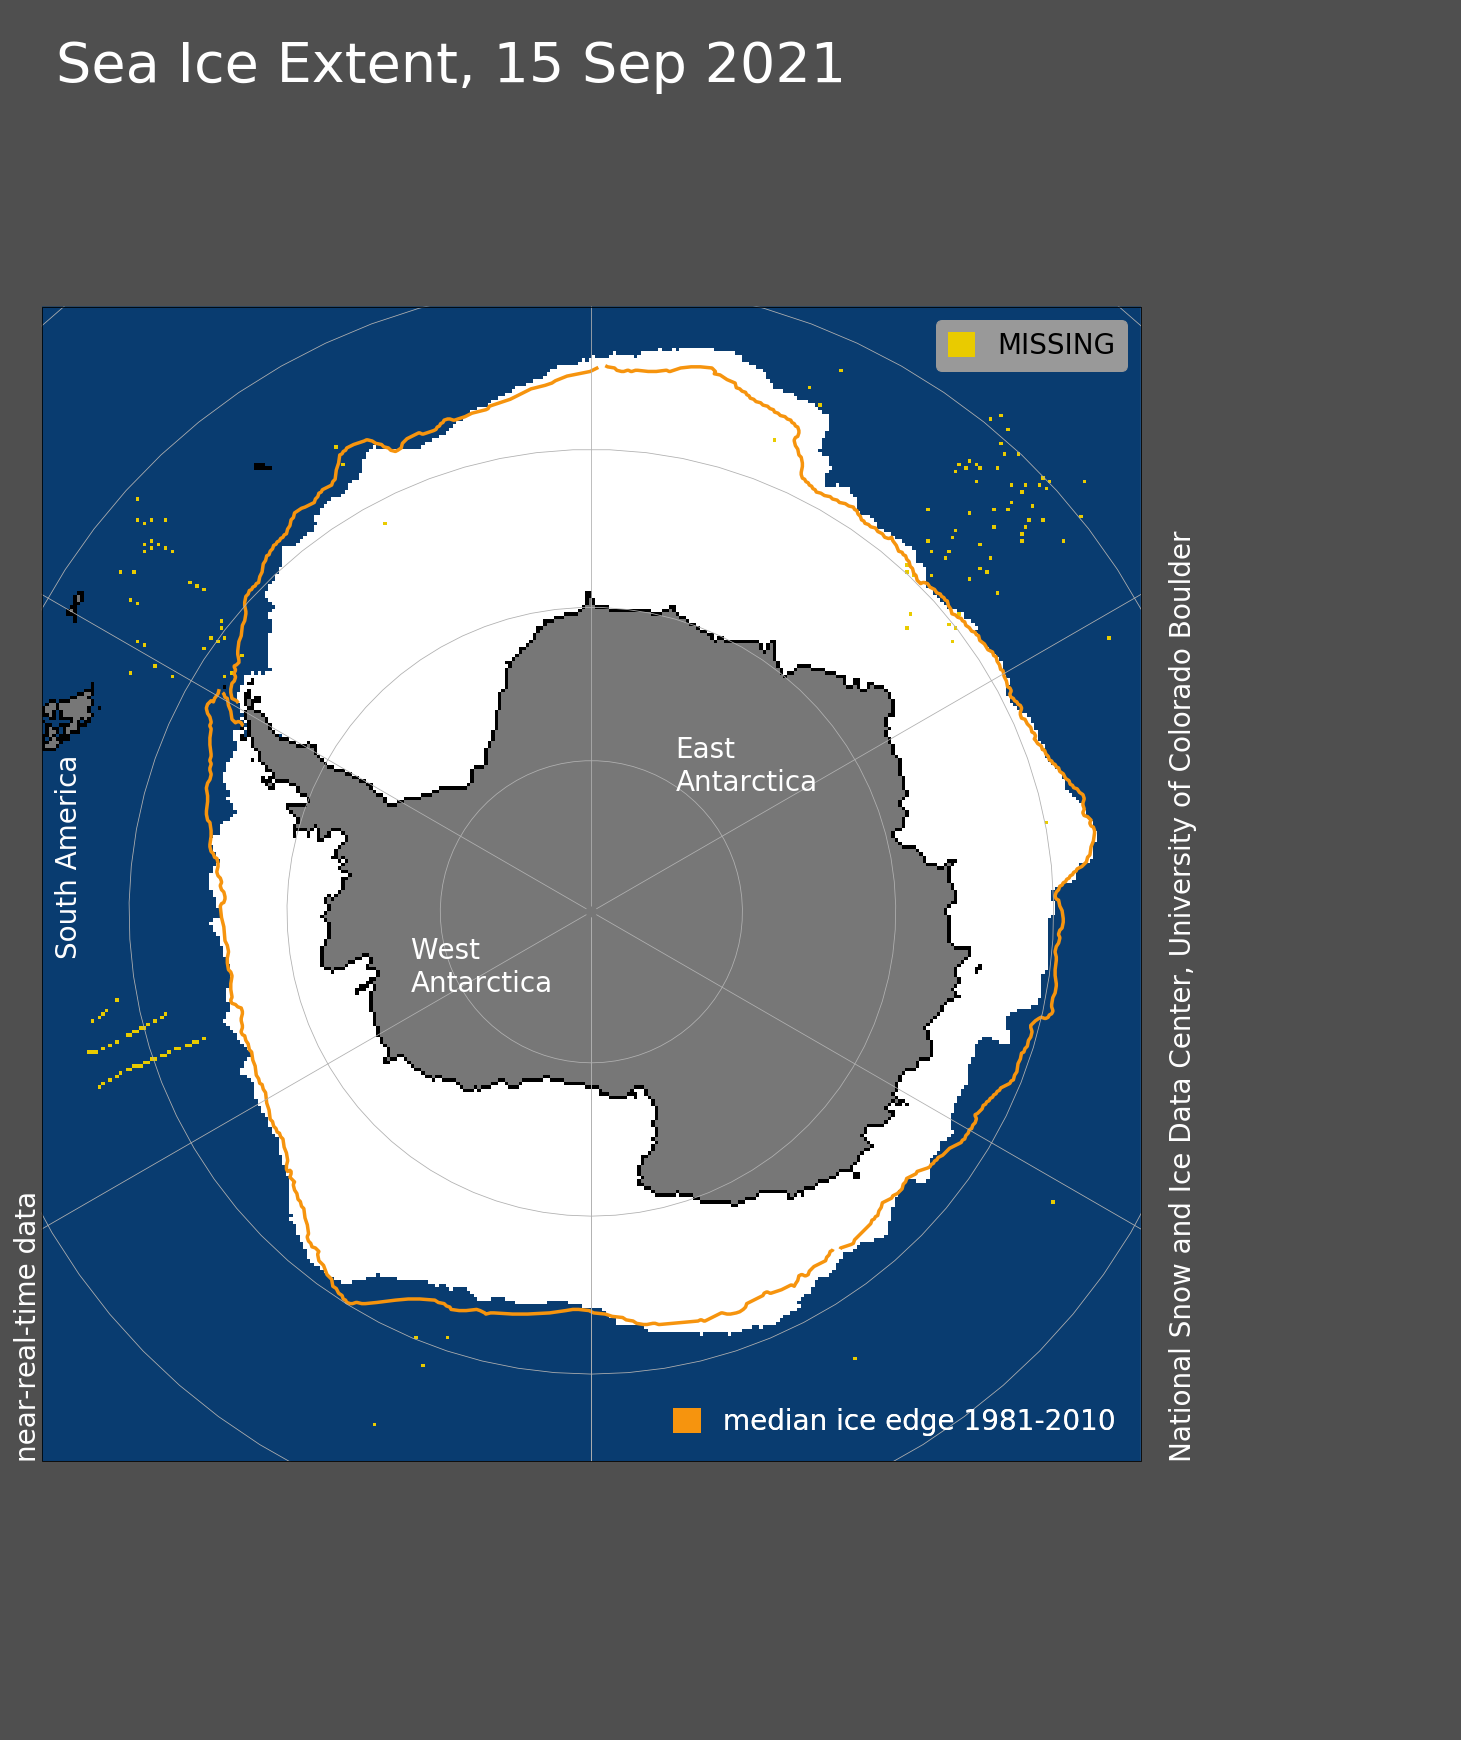
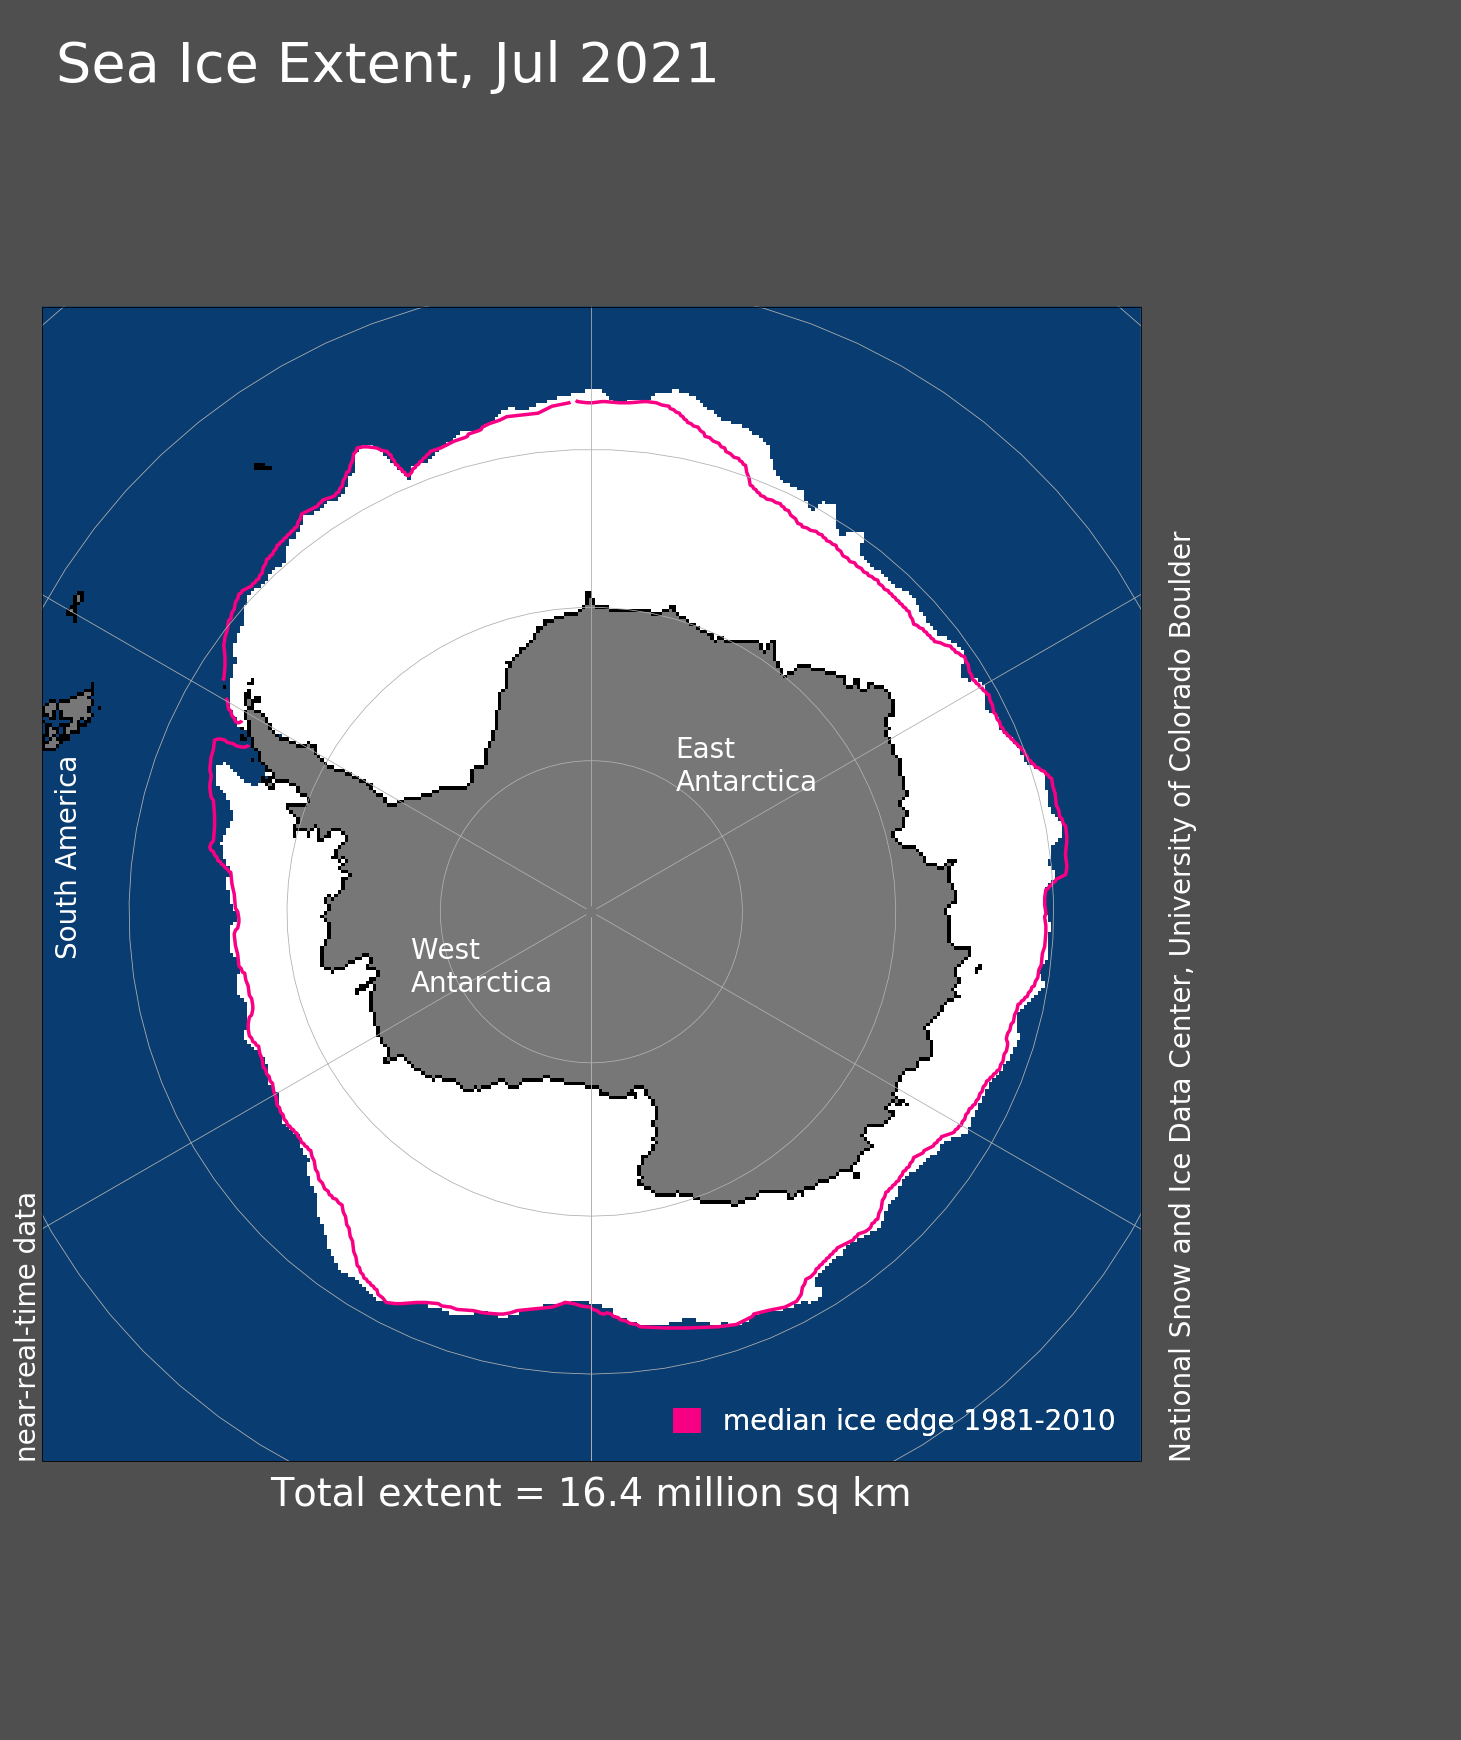
As noted in our earlier posts, Antarctic sea ice extent has been above average for the past several months, culminating in late August when extent was the fifth highest in the satellite record (Figure 4a). However, since peaking on September 1, sea ice extent has declined steeply. At the beginning of October, Antarctic sea ice extent was nearly 600,000 square kilometers (232,000 square miles) lower than the beginning of the month (Figure 4a). The maximum observed on September 1 was 18.75 million square kilometers (7.24 million square miles) is very likely to be the annual maximum for the year, marking the second-earliest seasonal maximum in the 43-year satellite record. Sea ice loss since September 1 has been greatest in the Ross Sea, Bellingshausen Sea, and Weddell Sea sectors (Figure 4b).
For the interior of the Antarctic continent, specifically the region near the South Pole, the winter of 2021 was among the coldest on record. At the National Science Foundation’s Amundsen-Scott South Pole Station, temperatures for June, July, and August were 3.4 degrees Celsius (6.1 degrees Fahrenheit) lower than the 1981-to-2010 average at -62.9 degrees Celsius (-81.2 degrees Fahrenheit). This is the second coldest winter (June-July-August months) on record, behind only 2004 in the 60-year weather record at the South Pole Station. For the polar darkness period, from April through September, the average temperature was -60.9 degrees Celsius (-77.6 degrees Fahrenheit), a record for those months. The unusual cold was attributed to two extended periods of stronger-than-average encircling winds around the continent, which tend to isolate the ice sheet from warmer conditions. A strong upper-atmosphere polar vortex was observed as well, leading to a significant ozone hole. The ozone hole appears to have peaked as of this post, with initial measurements reporting that it is in the upper quartile (top 25 percent) of ozone reduction events since 1979.
2021 Arctic summer in review
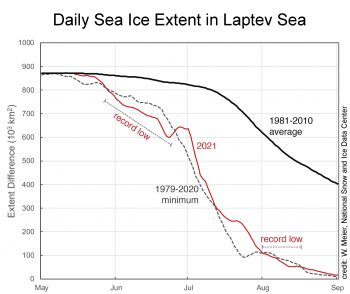
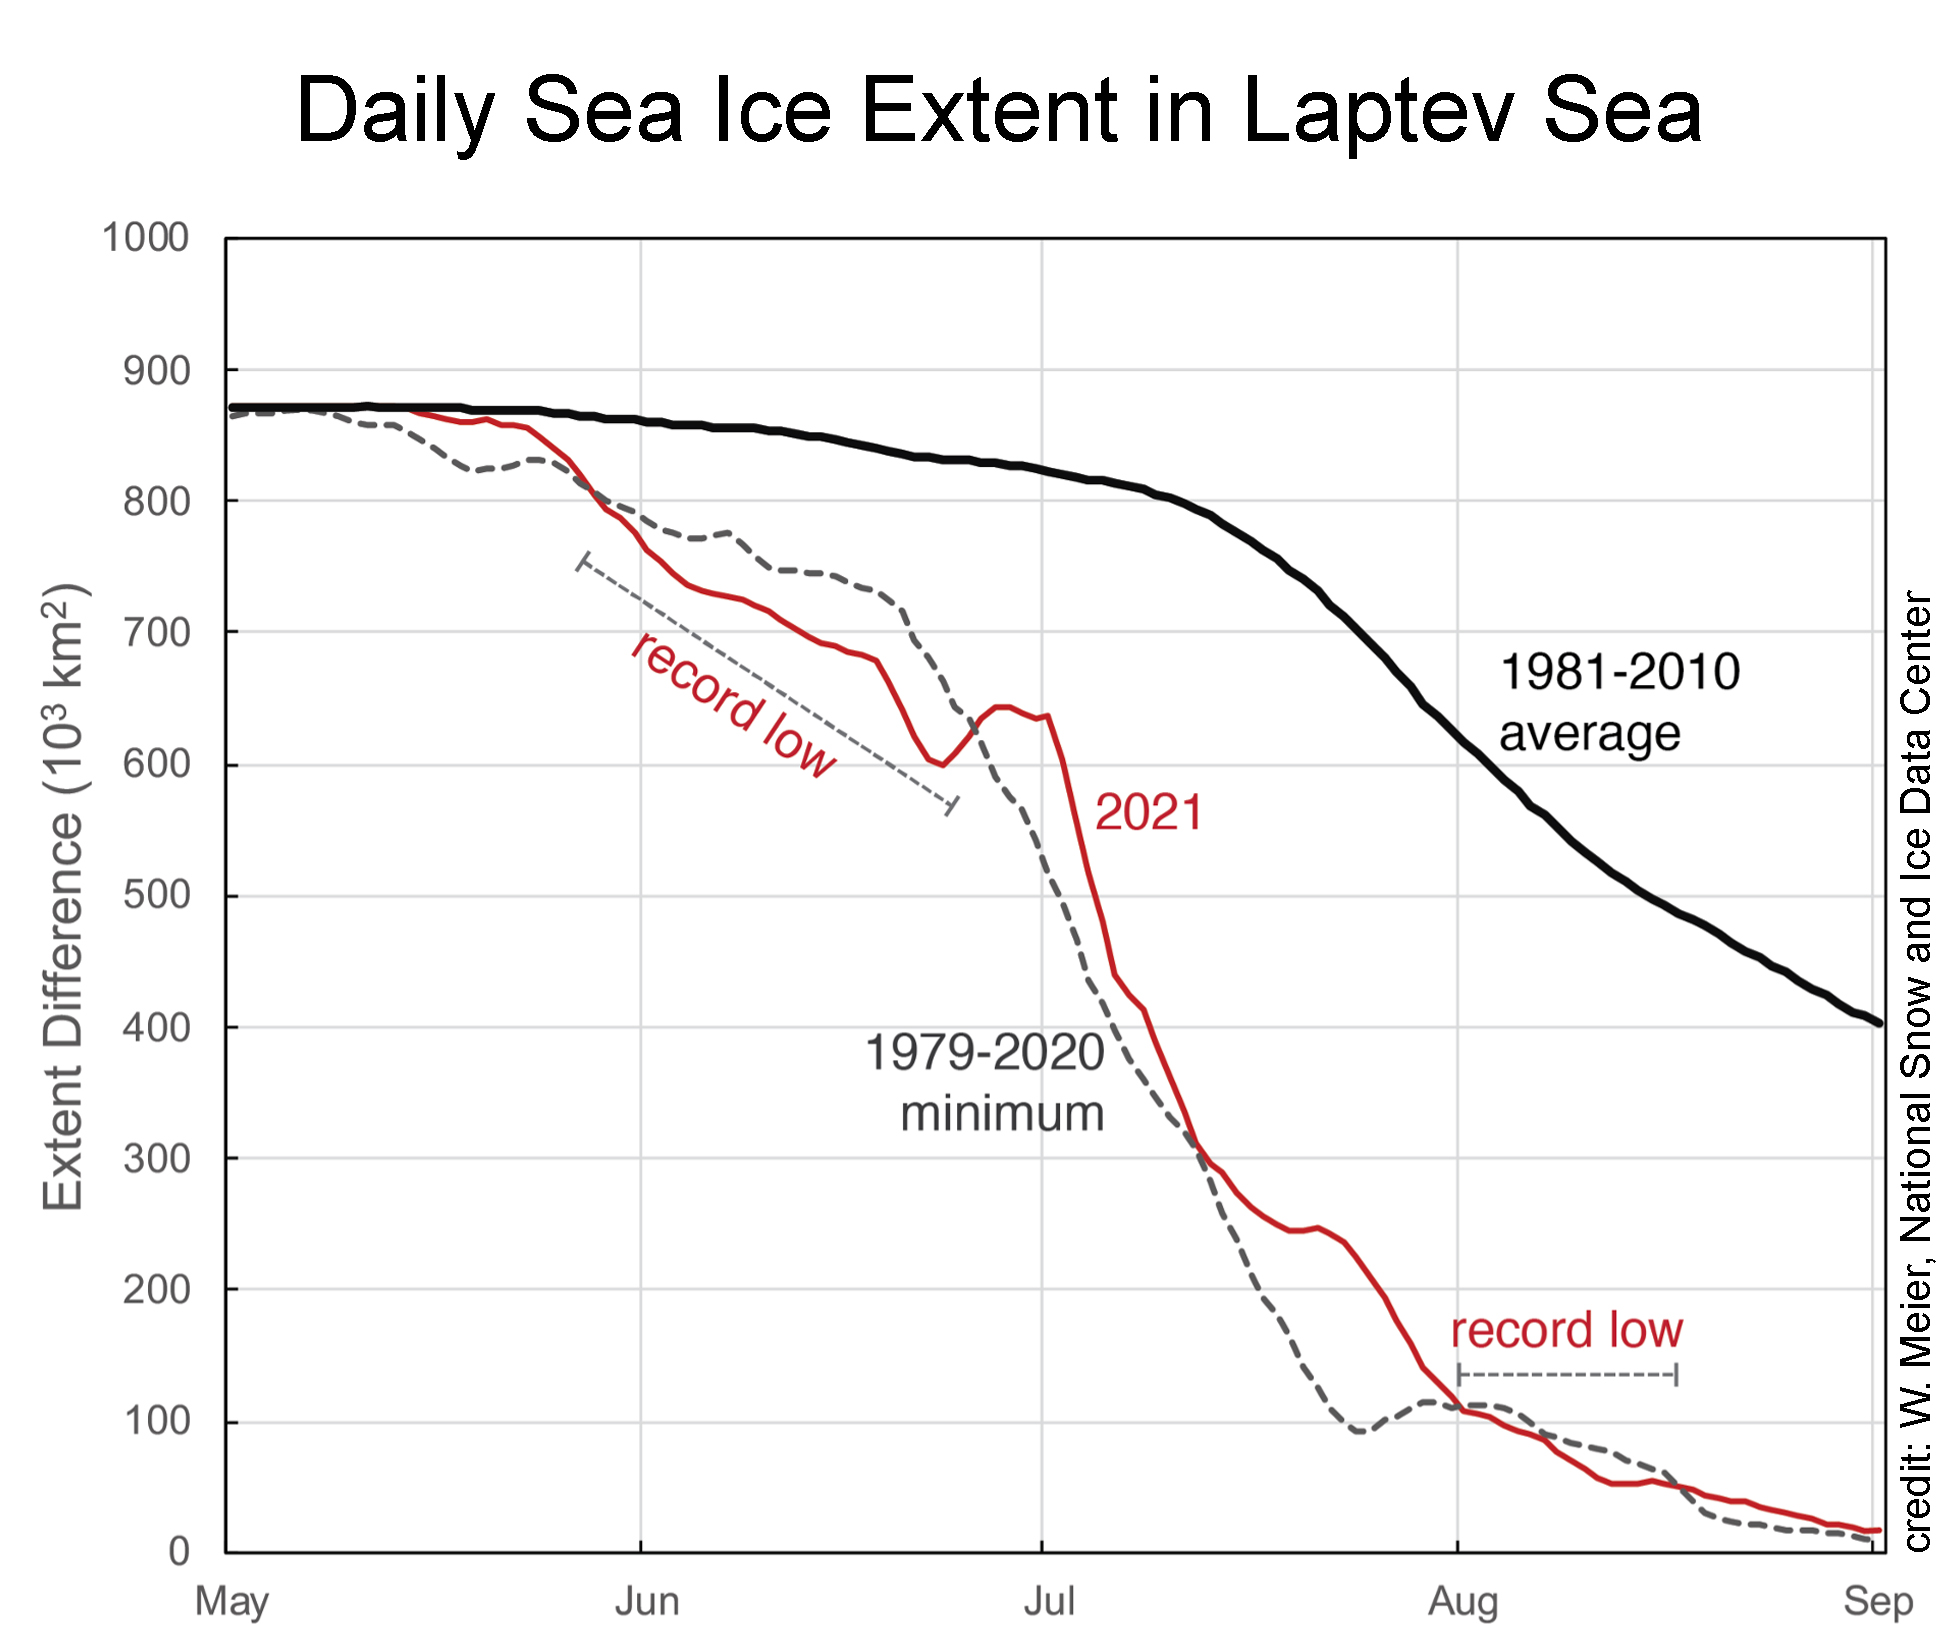
Figure 5a. This graph shows daily sea ice extent in the Laptev Sea for May through September for 2021 (red) and the 1979 to 2020 minimum (dashed gray) as compared to the 1981 to 2010 average. At two periods in time the Laptev sea ice extent in 2021 fell to the lowest extent in the satellite record, as marked in red “record low.”
Credit: W. Meier, National Snow and Ice Data Center
High-resolution image

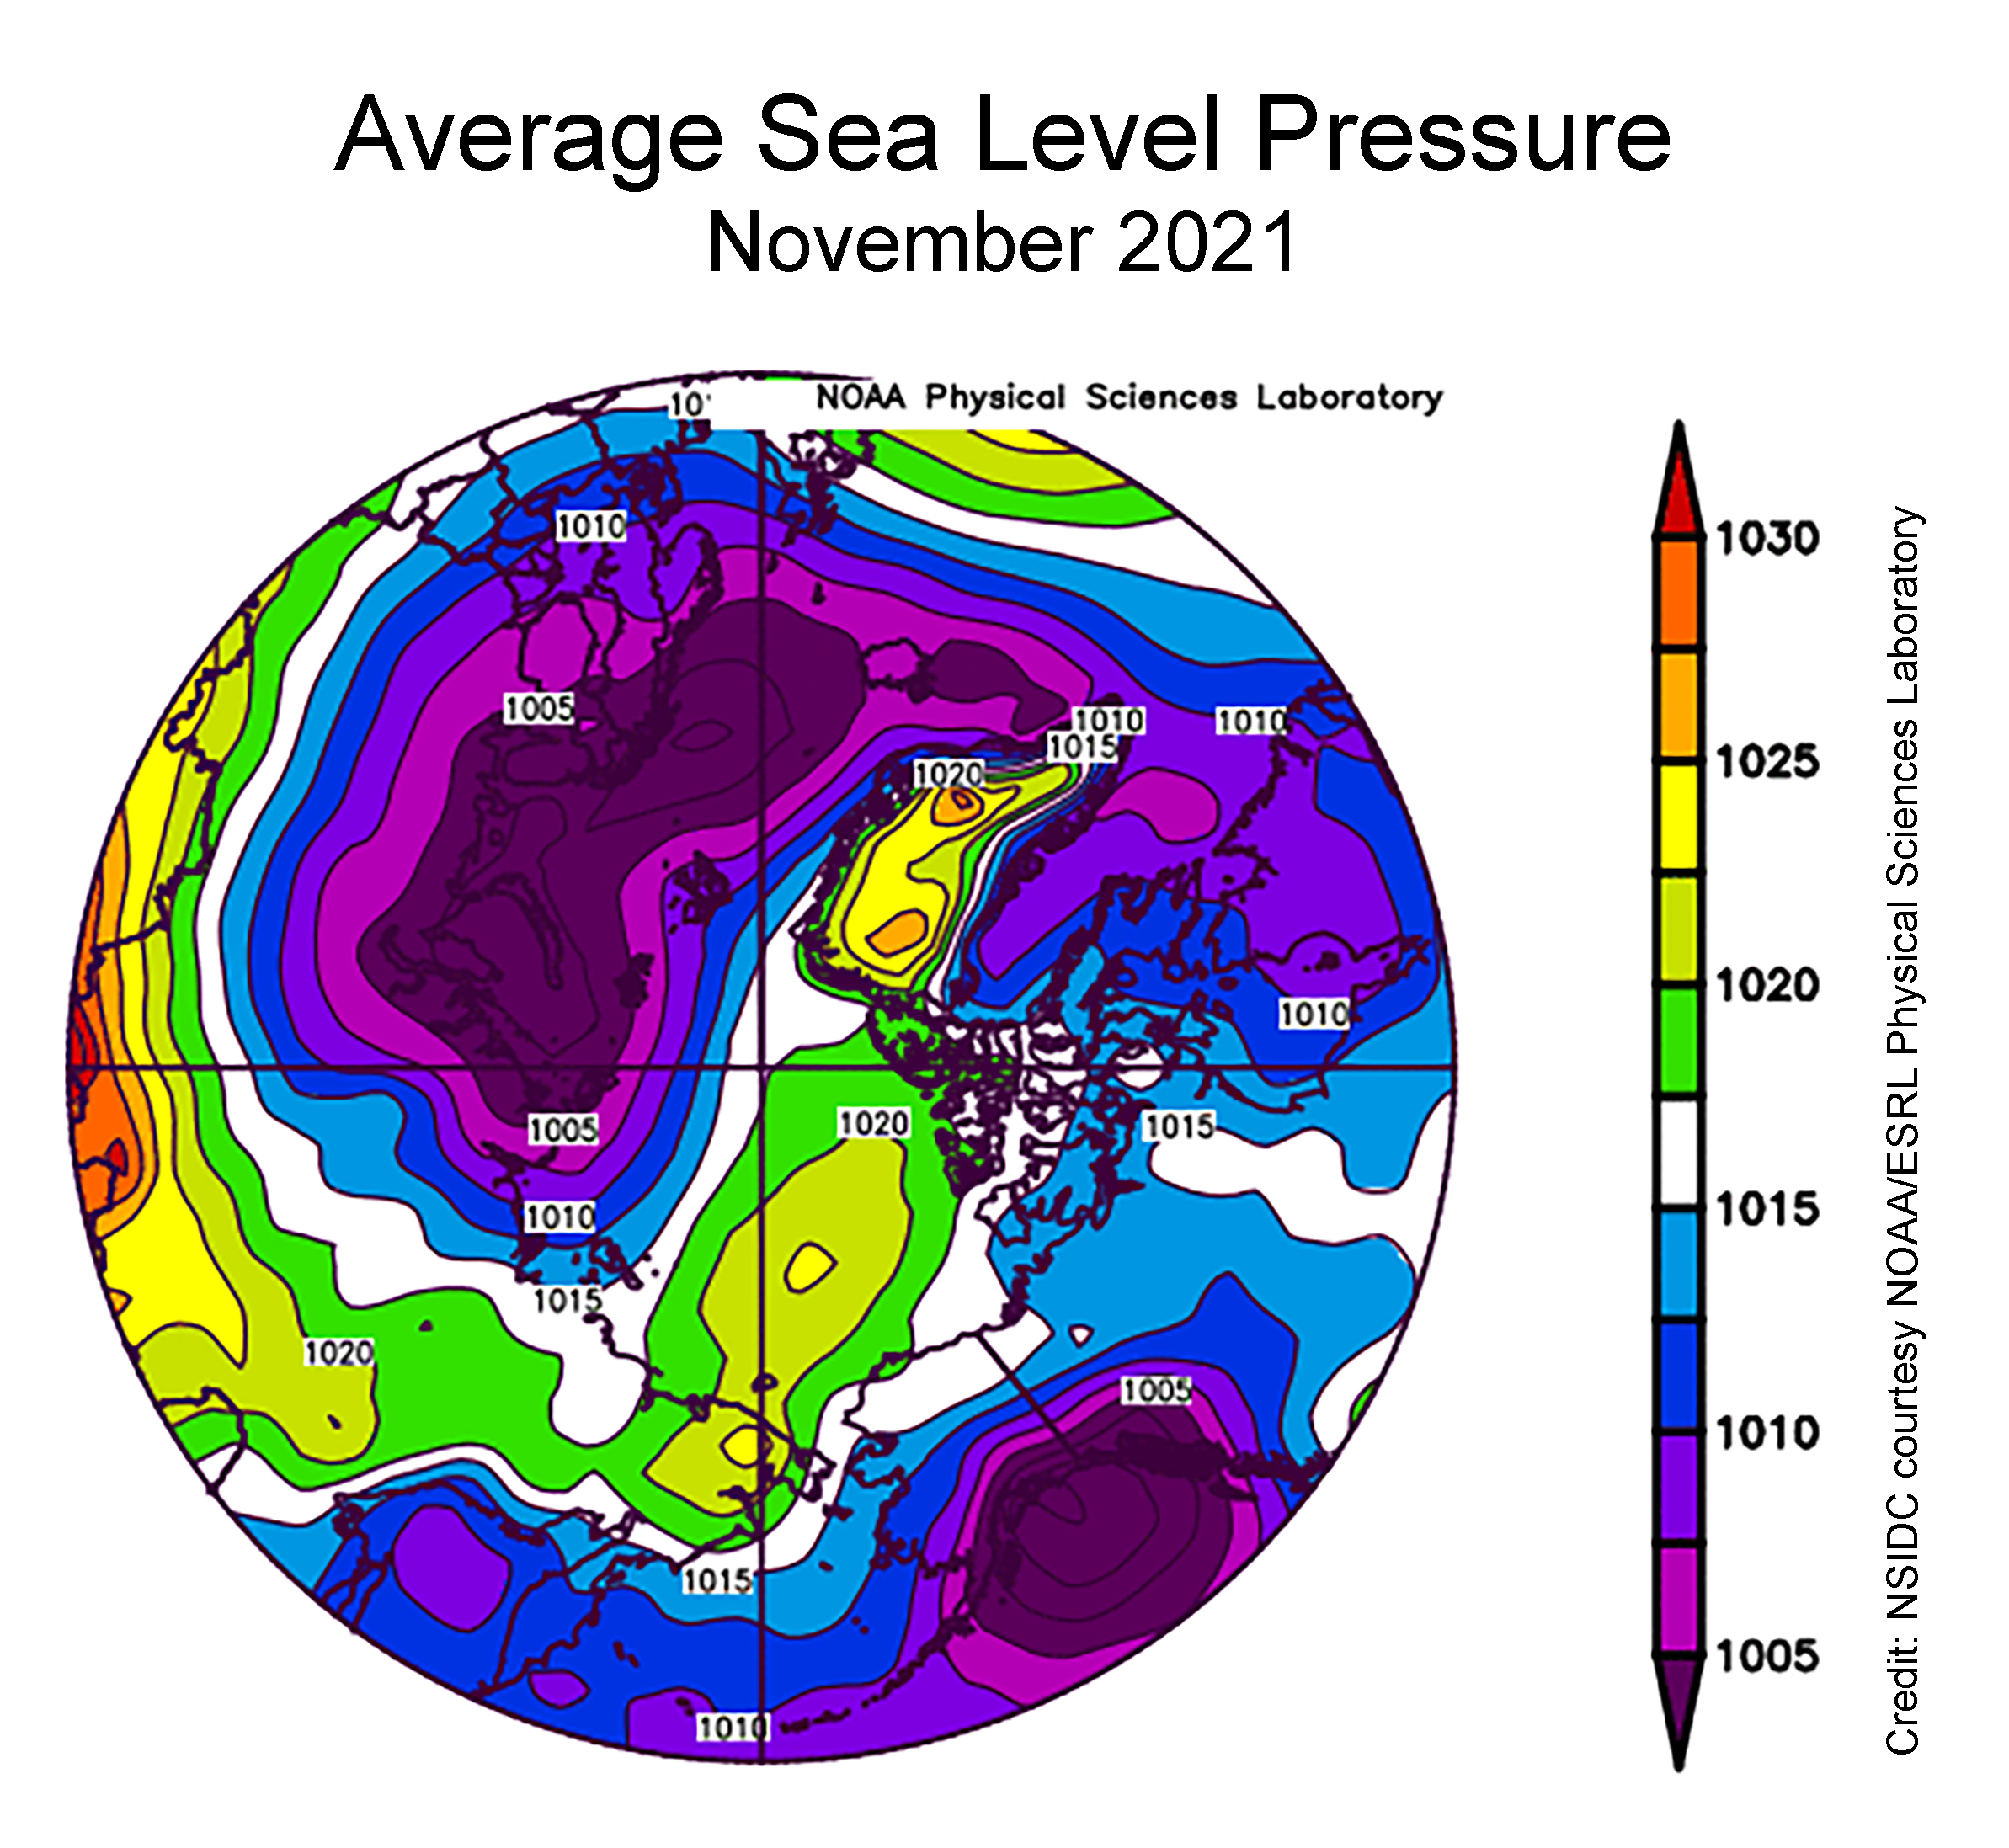
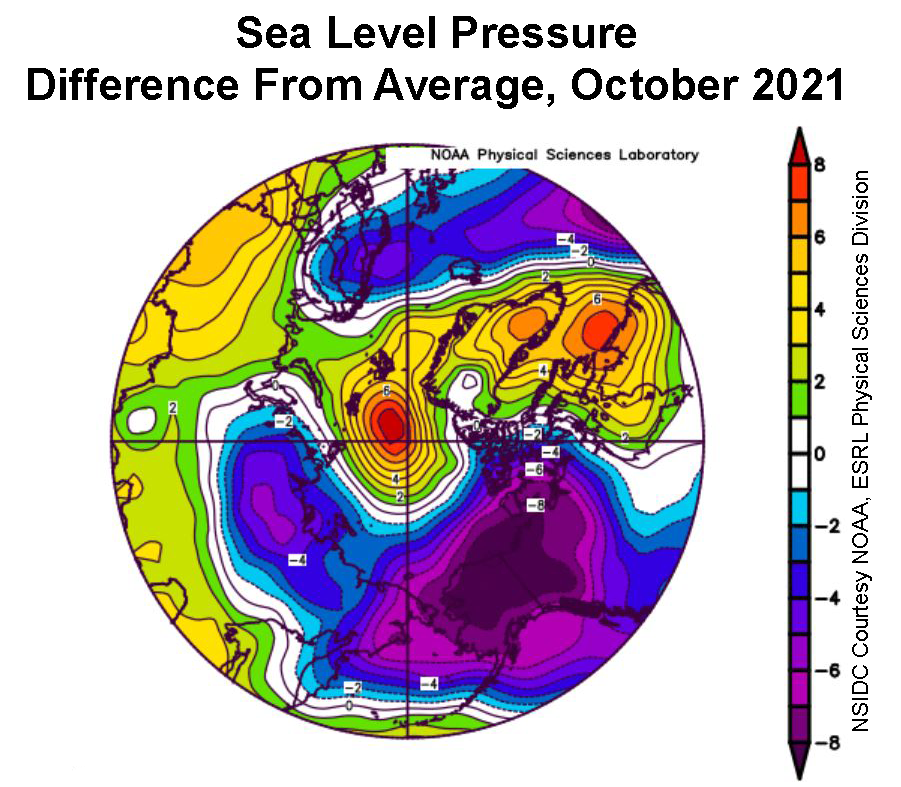
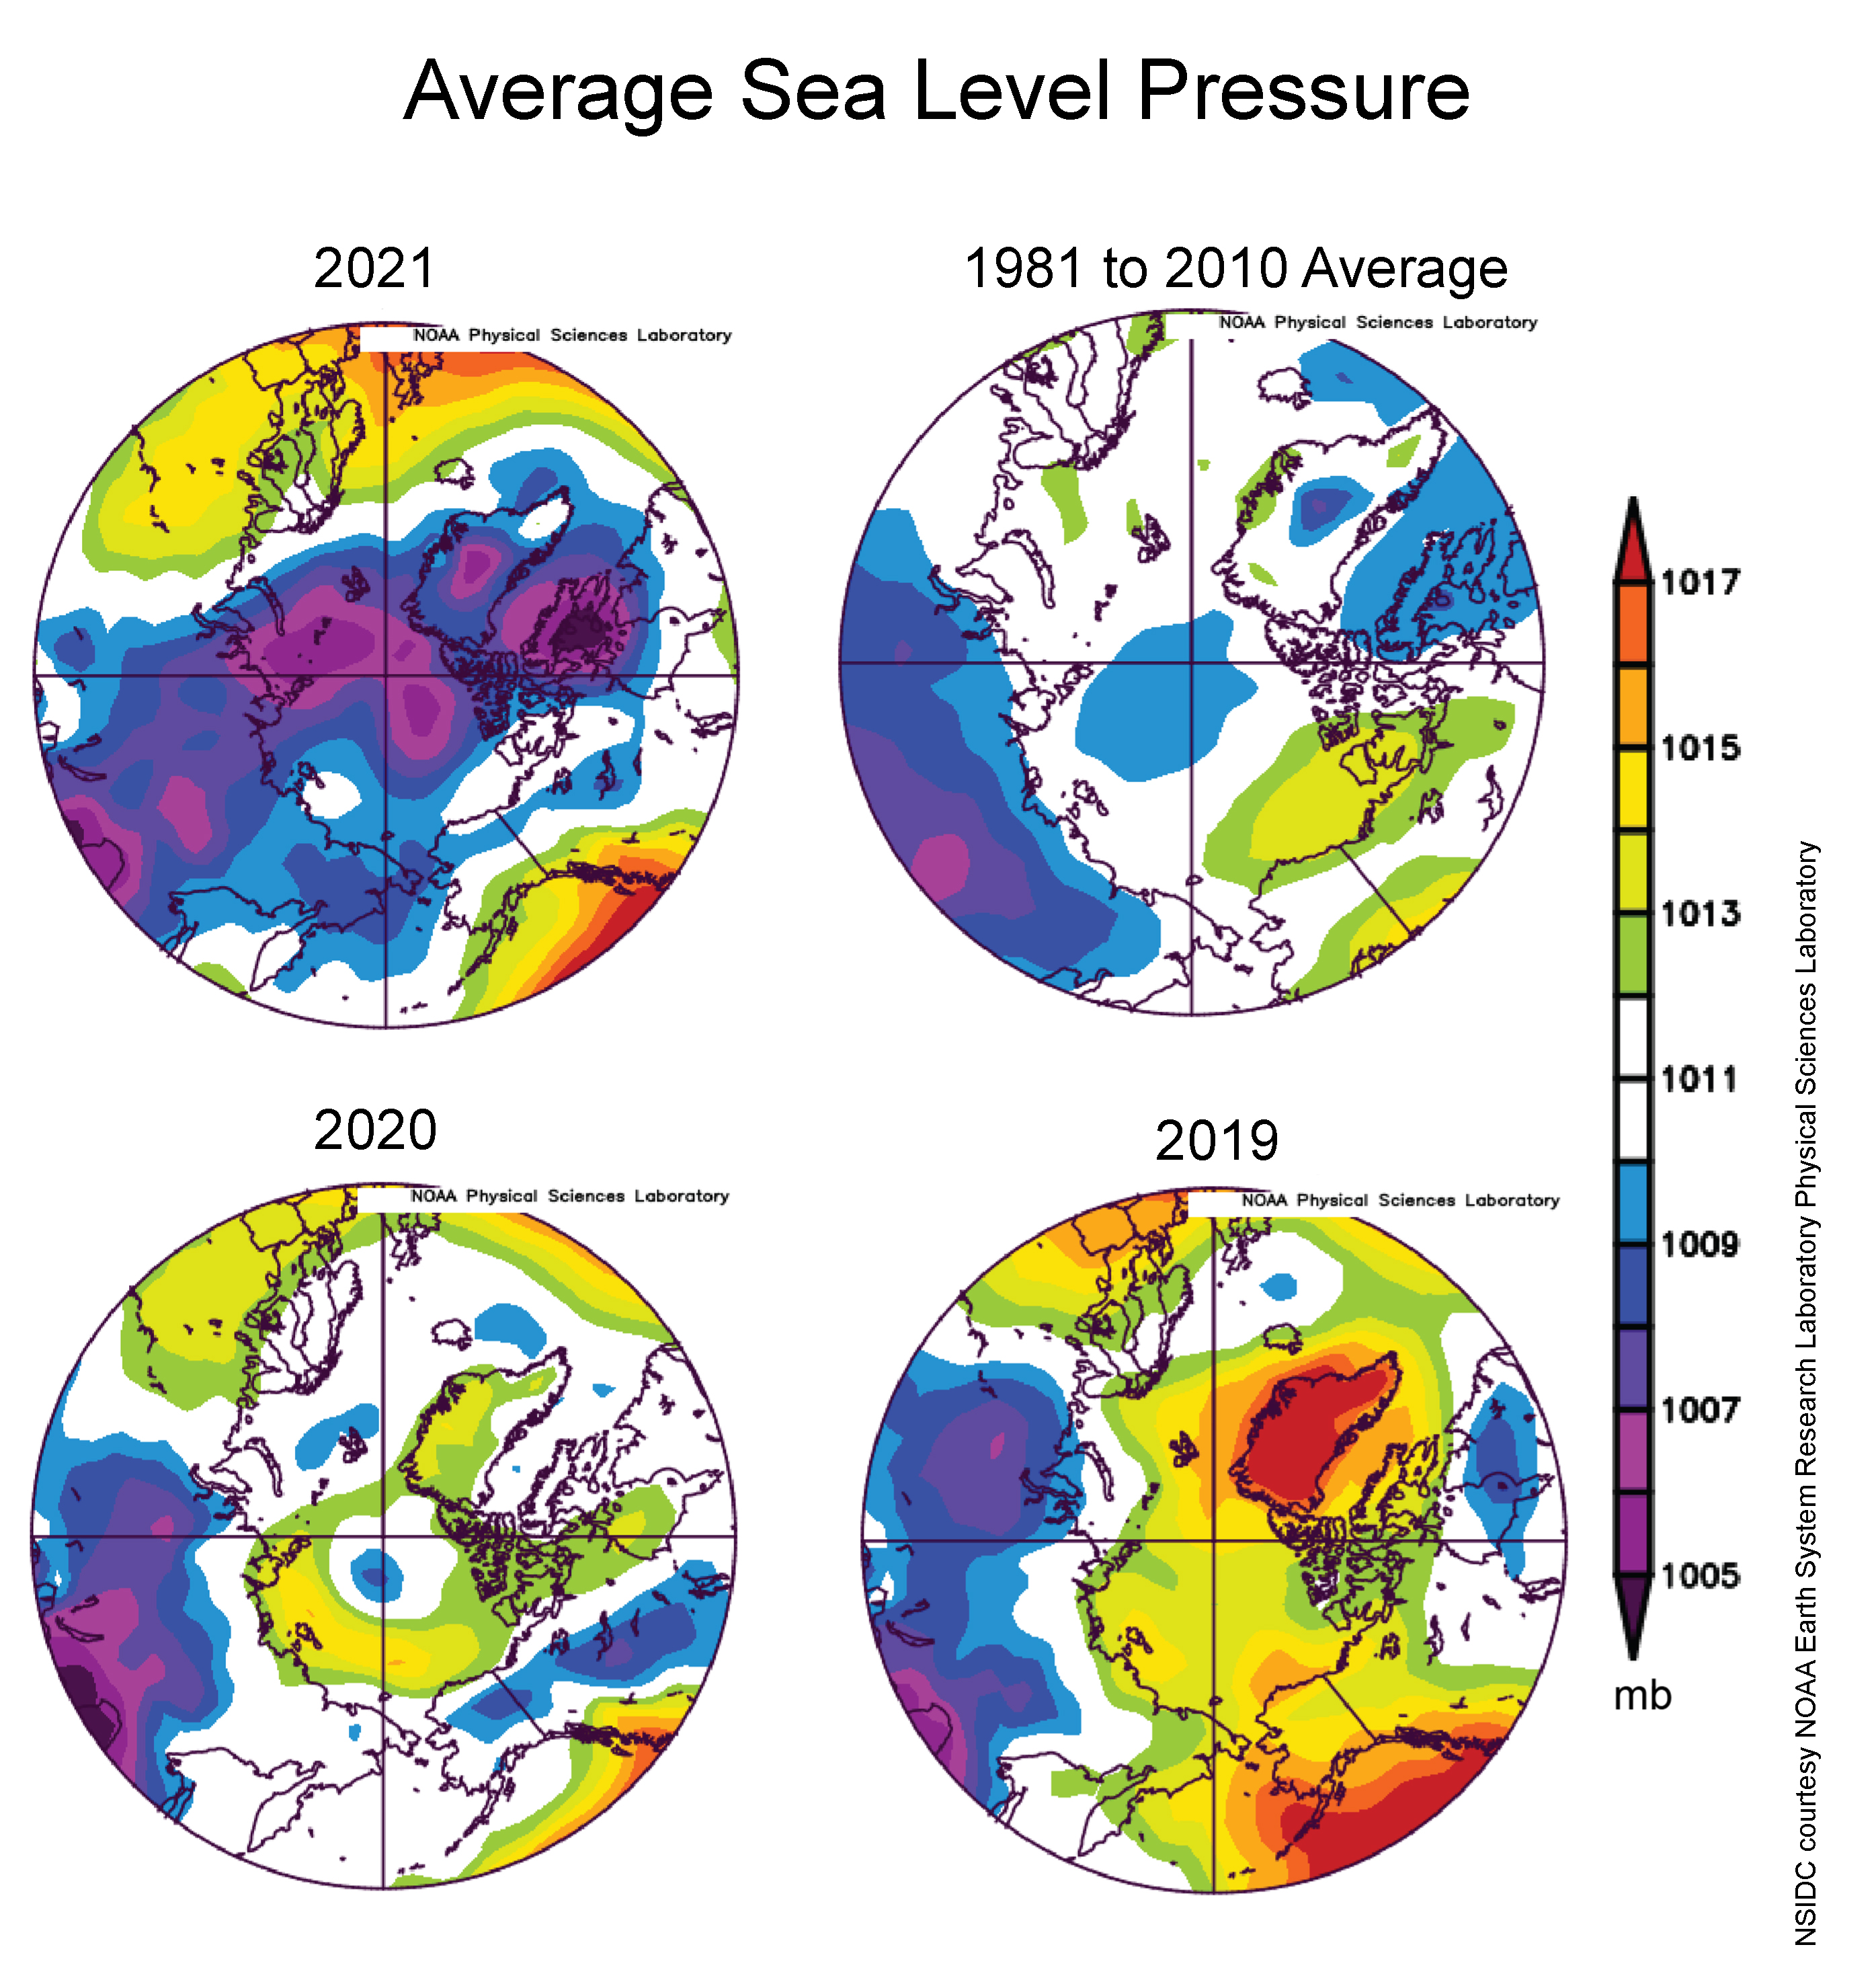
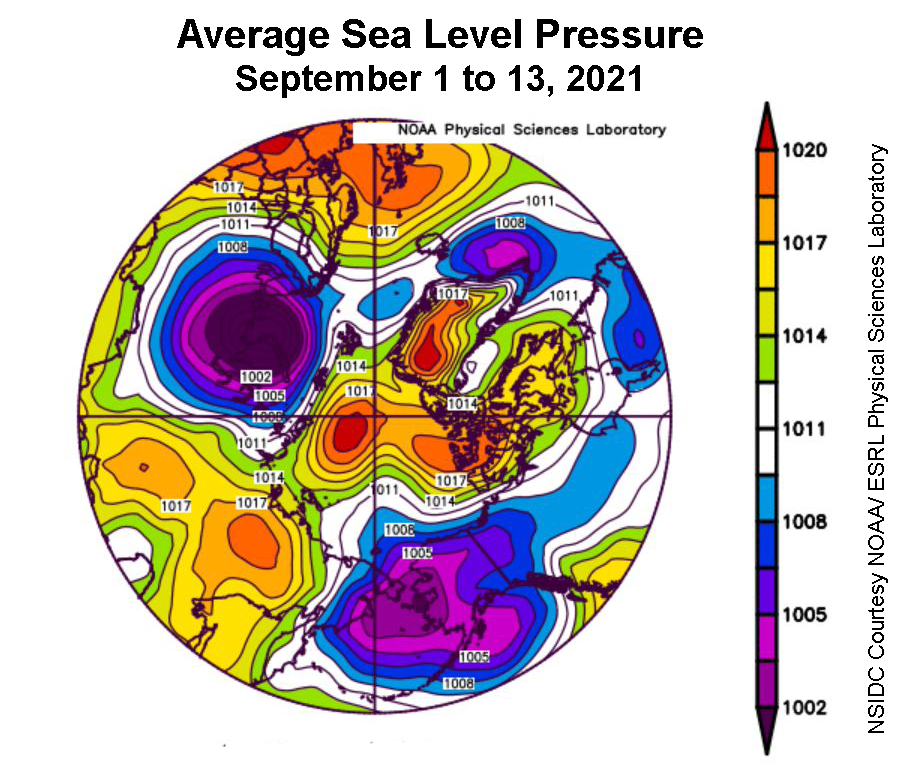
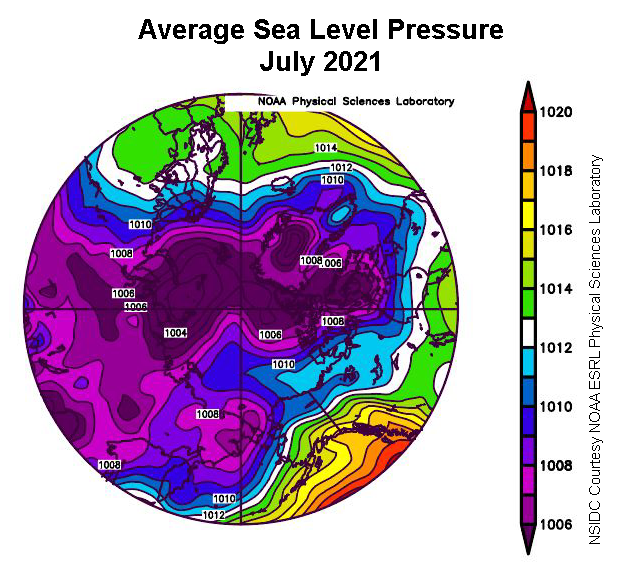
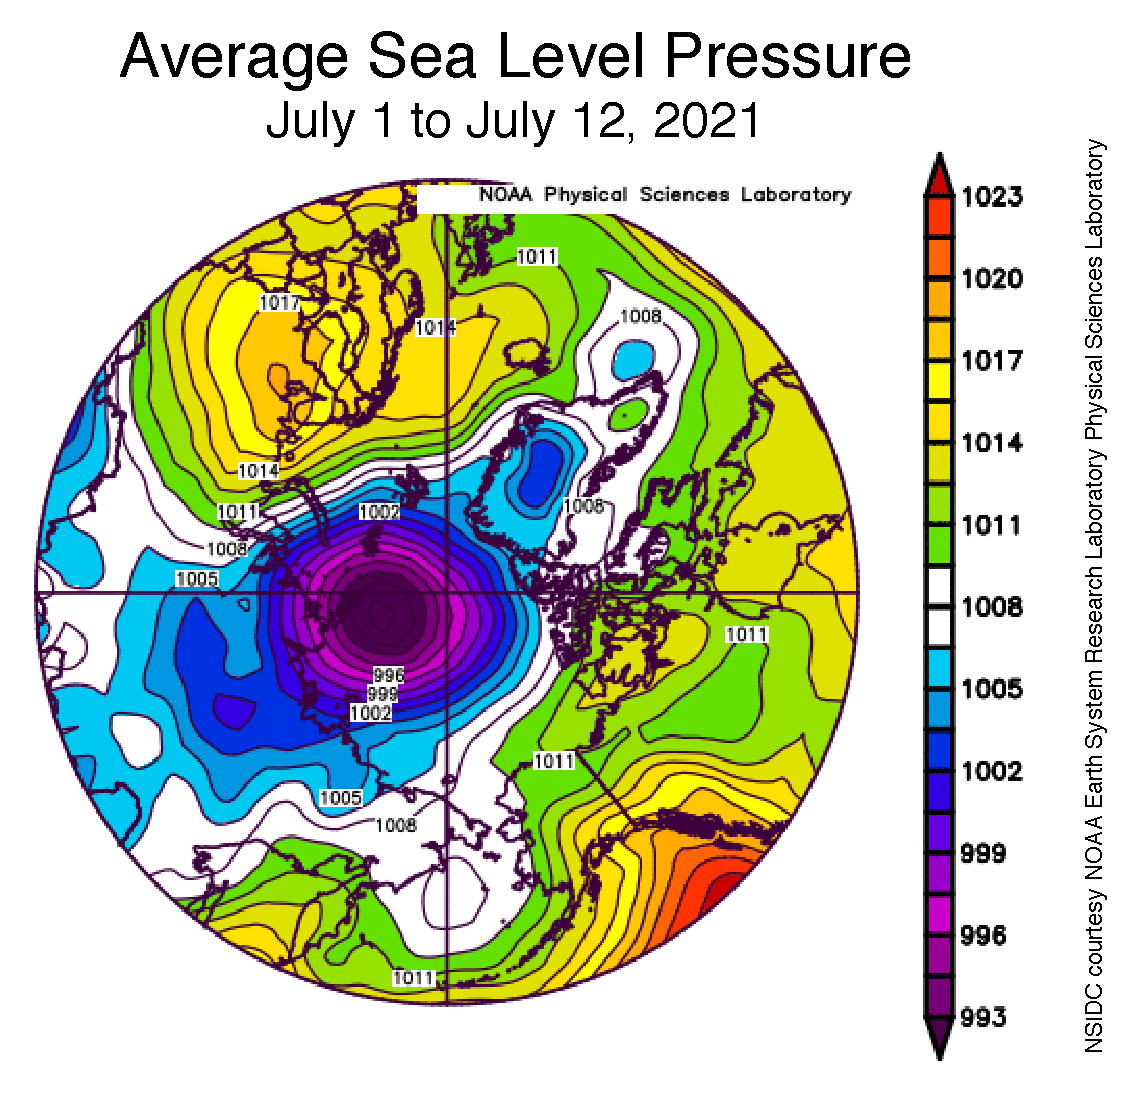
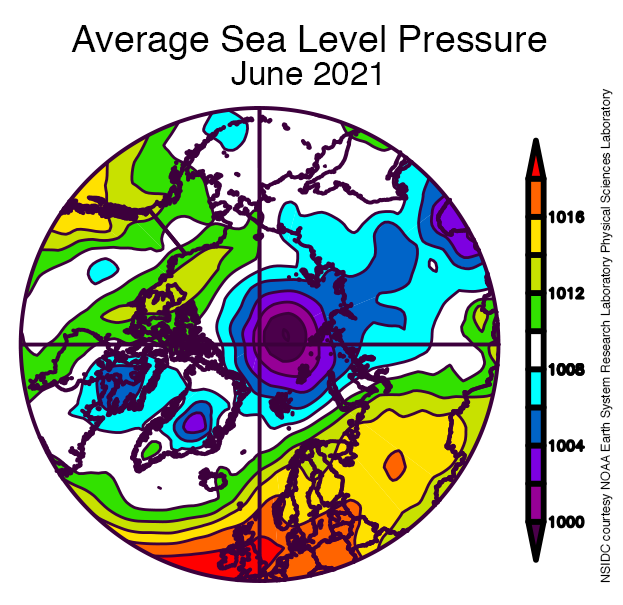
Figure 5b. This plot shows average sea level pressure in the Arctic in millibars for 2019, 2020, 2021, and the 1981 to 2010 average. Yellows and reds indicate high air pressure; blues and purples indicate low pressure.
Credit: NSIDC courtesy NOAA Earth System Research Laboratory Physical Sciences Laboratory
High-resolution image
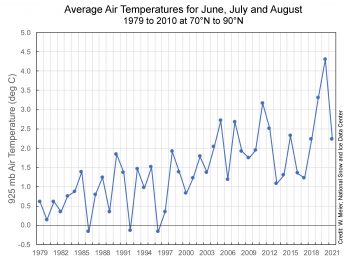
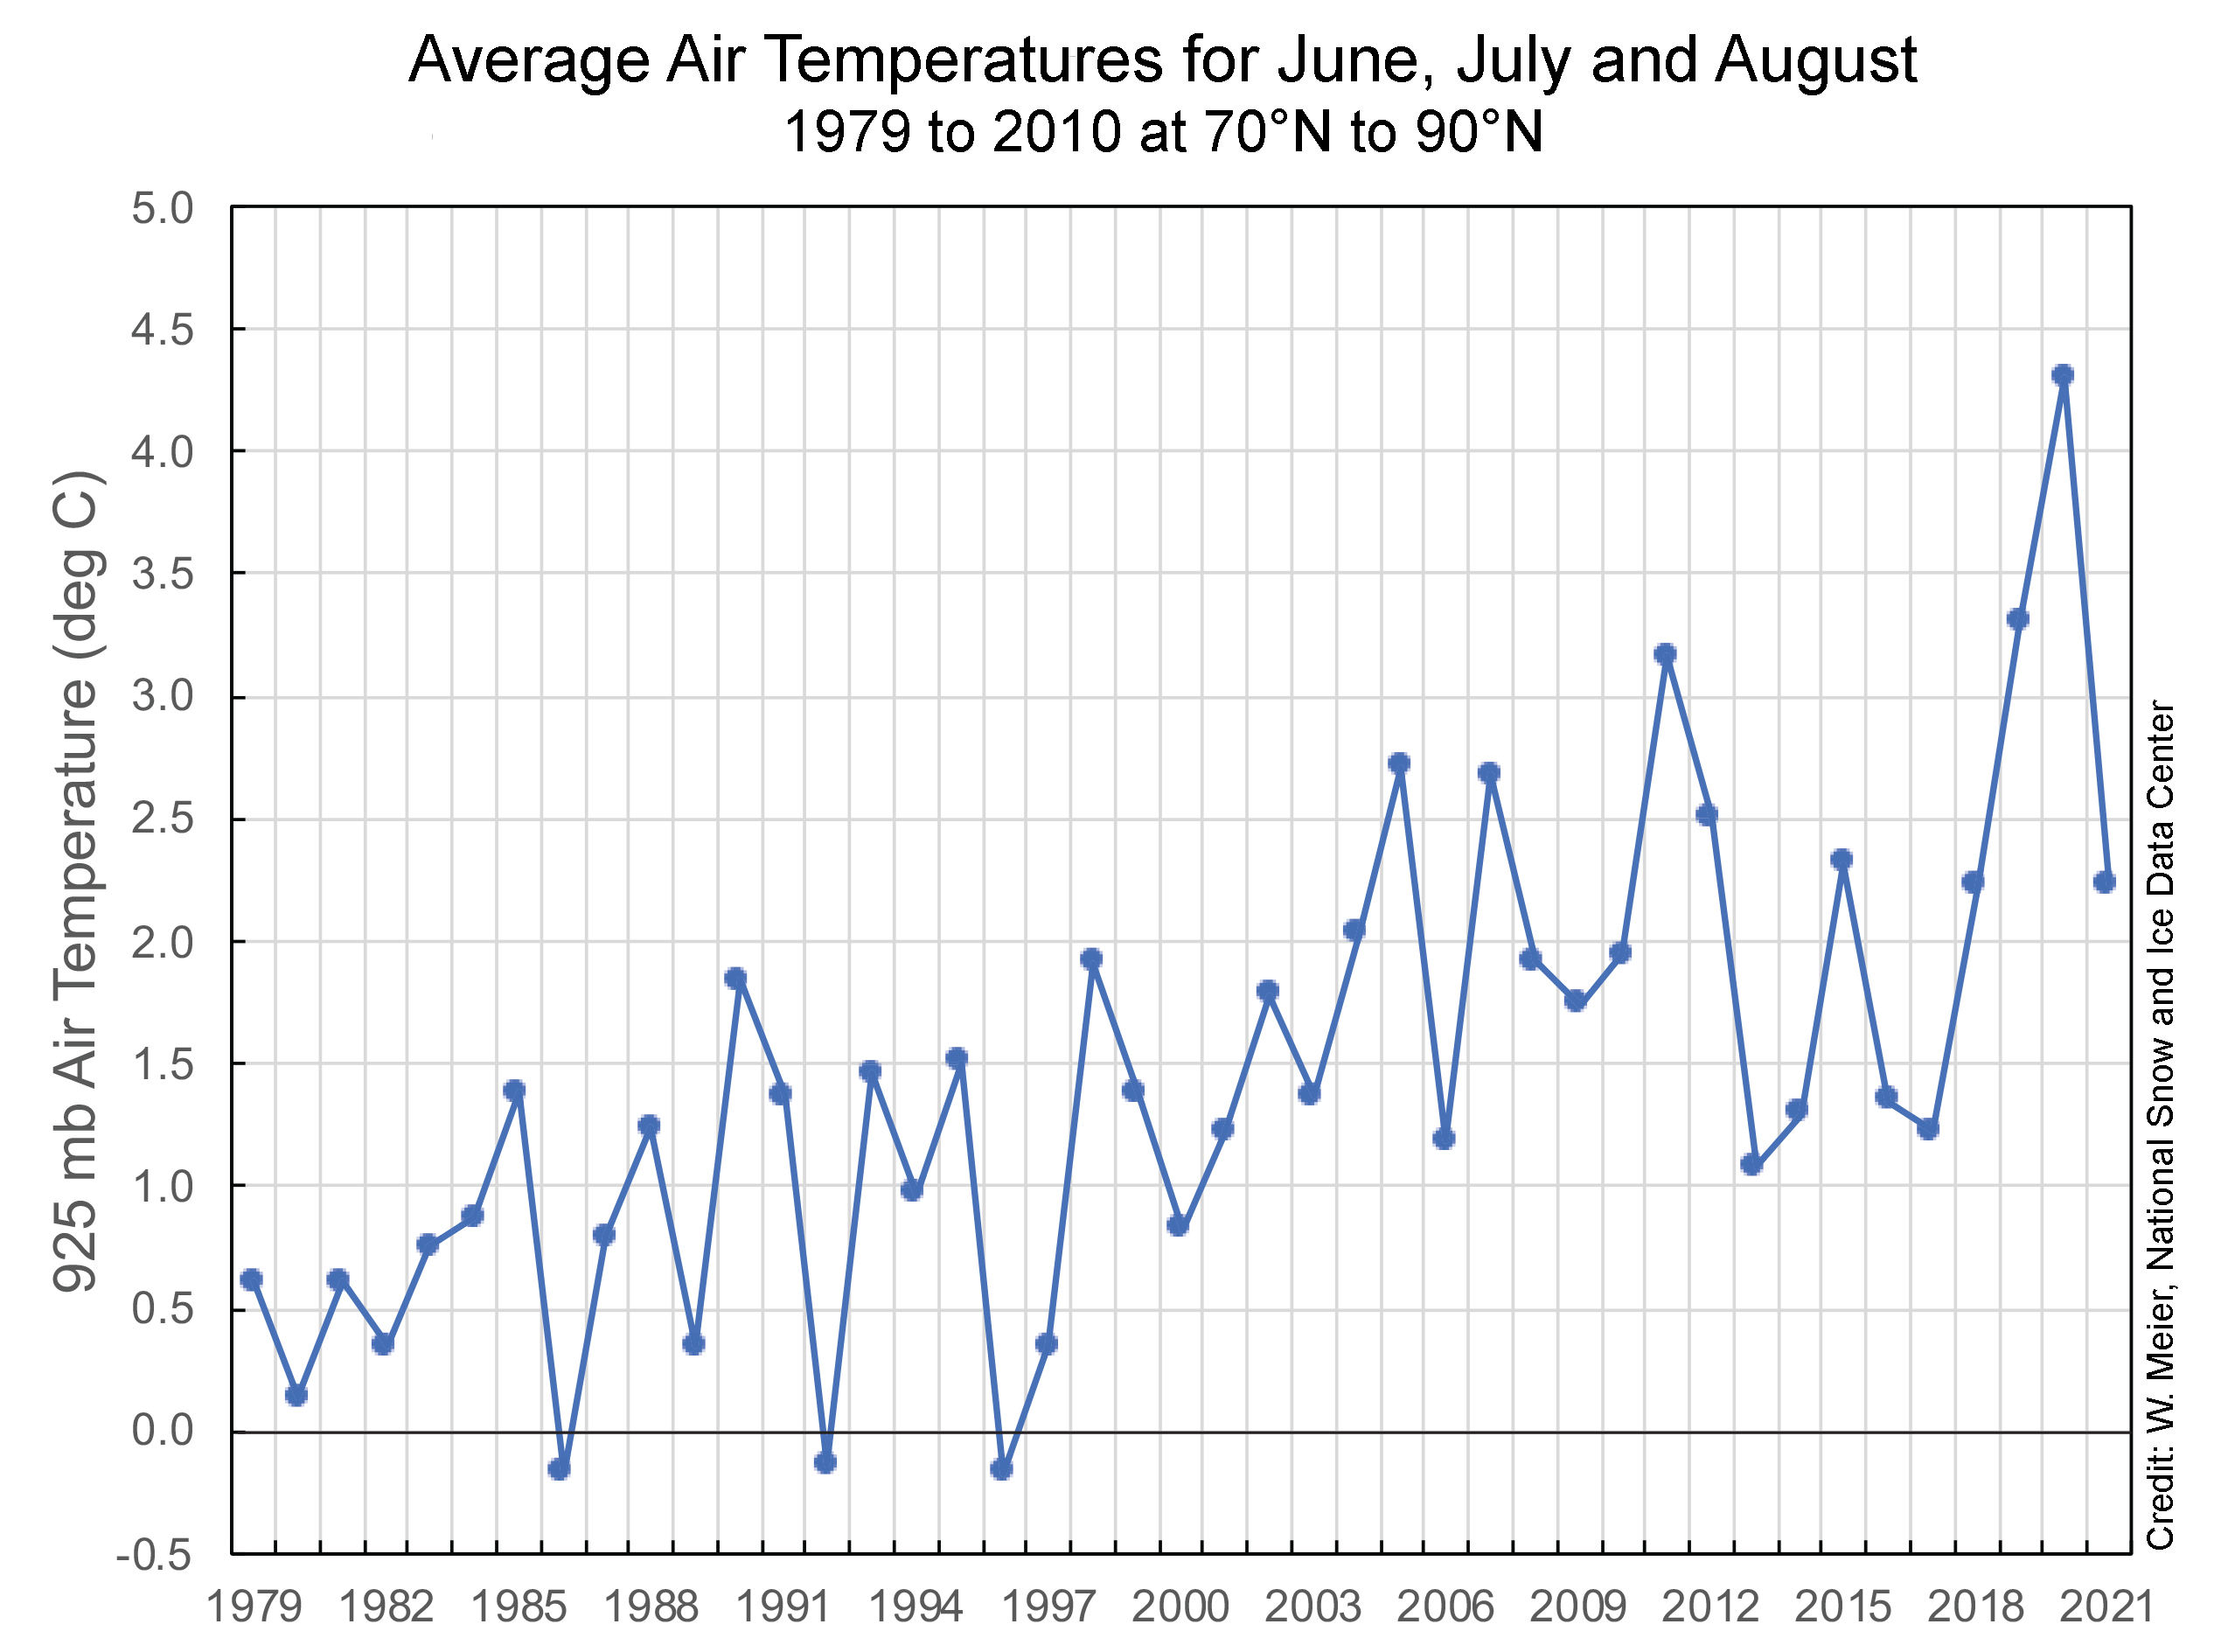
Figure 5c. This graph shows the months of June, July, and August (JJA) at 925 mb air temperature averaged over 70 to 90 degrees N latitude for 1979 to 2021.
Credit: National Centers for Environmental Prediction/National Center for Atmospheric Research (NCEP/NCAR) Reanalysis
High-resolution image
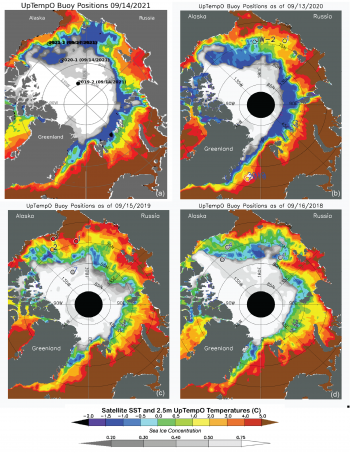
Figure 5d. These maps show sea surface temperatures (SST) in mid-September for (a) 2021, (b) 2020, (c) 2019, and (d) 2018. SST data from are from the National Ocean and Atmospheric Administration (NOAA). Circles indicate buoy data points with SST or sea ice concentration.
Credit: Upper layer Temperature of the Polar Oceans (UpTempO), University of Washington
High-resolution image
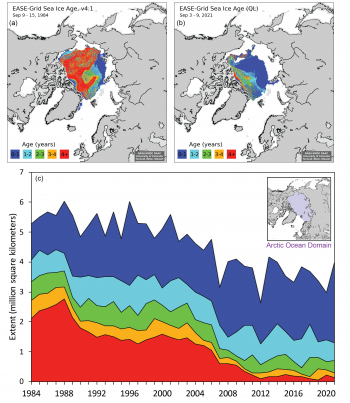
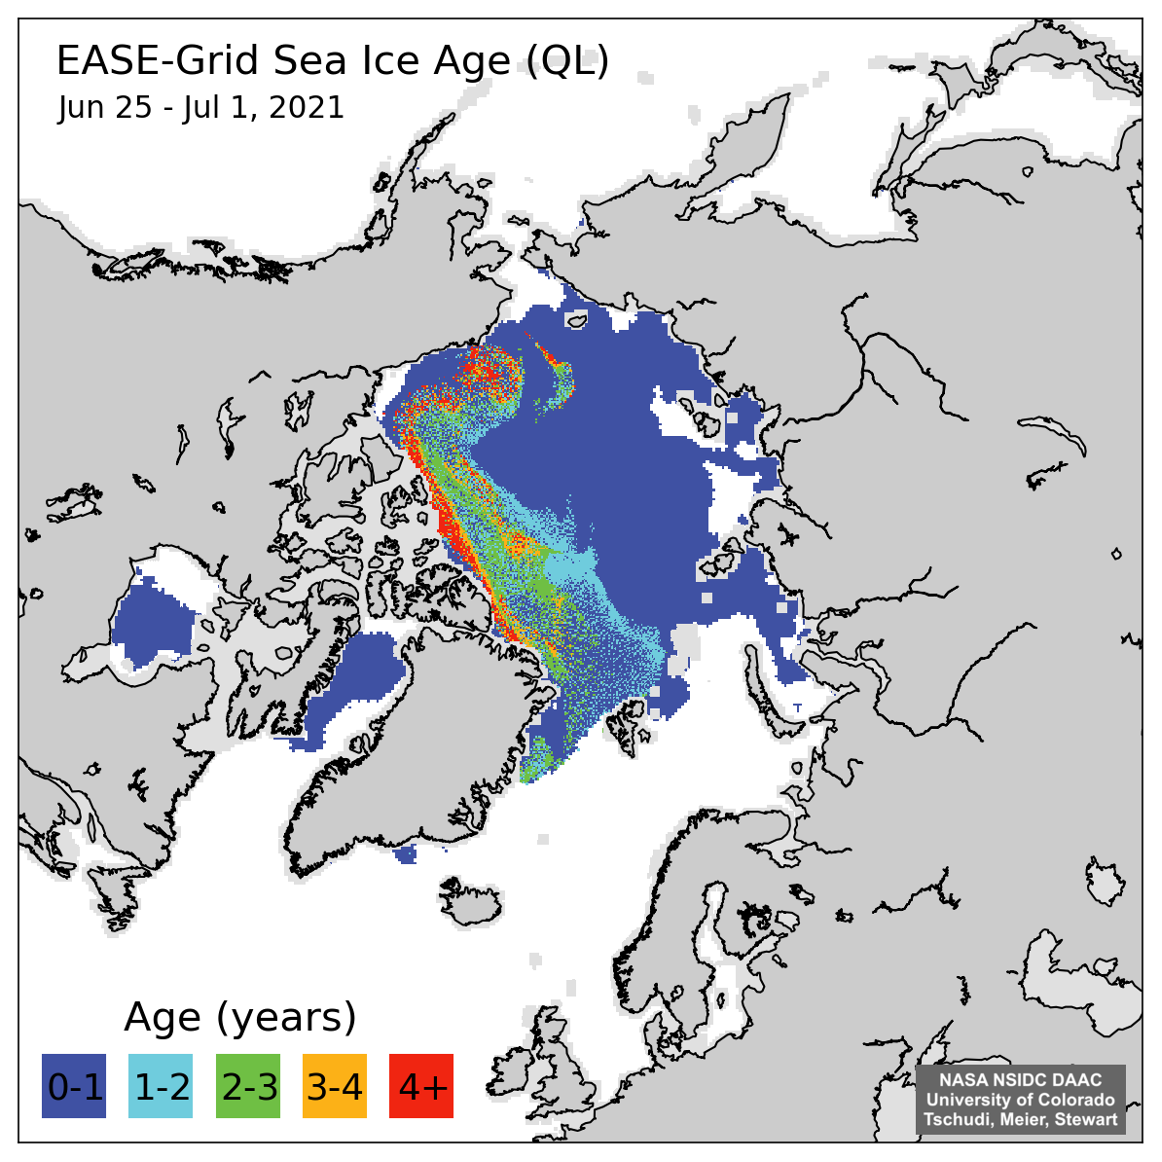
Figure 5e. The top maps show sea ice age at the week of the minimum for 1984, on the left, and 2021, on the right. The bottom time series graph shows the total extent of age categories for 1984 to 2021, within the Arctic Ocean Domain (inset).
Credit: Tschudi et al., 2019a and Tschudi et al., 2019b
High-resolution image
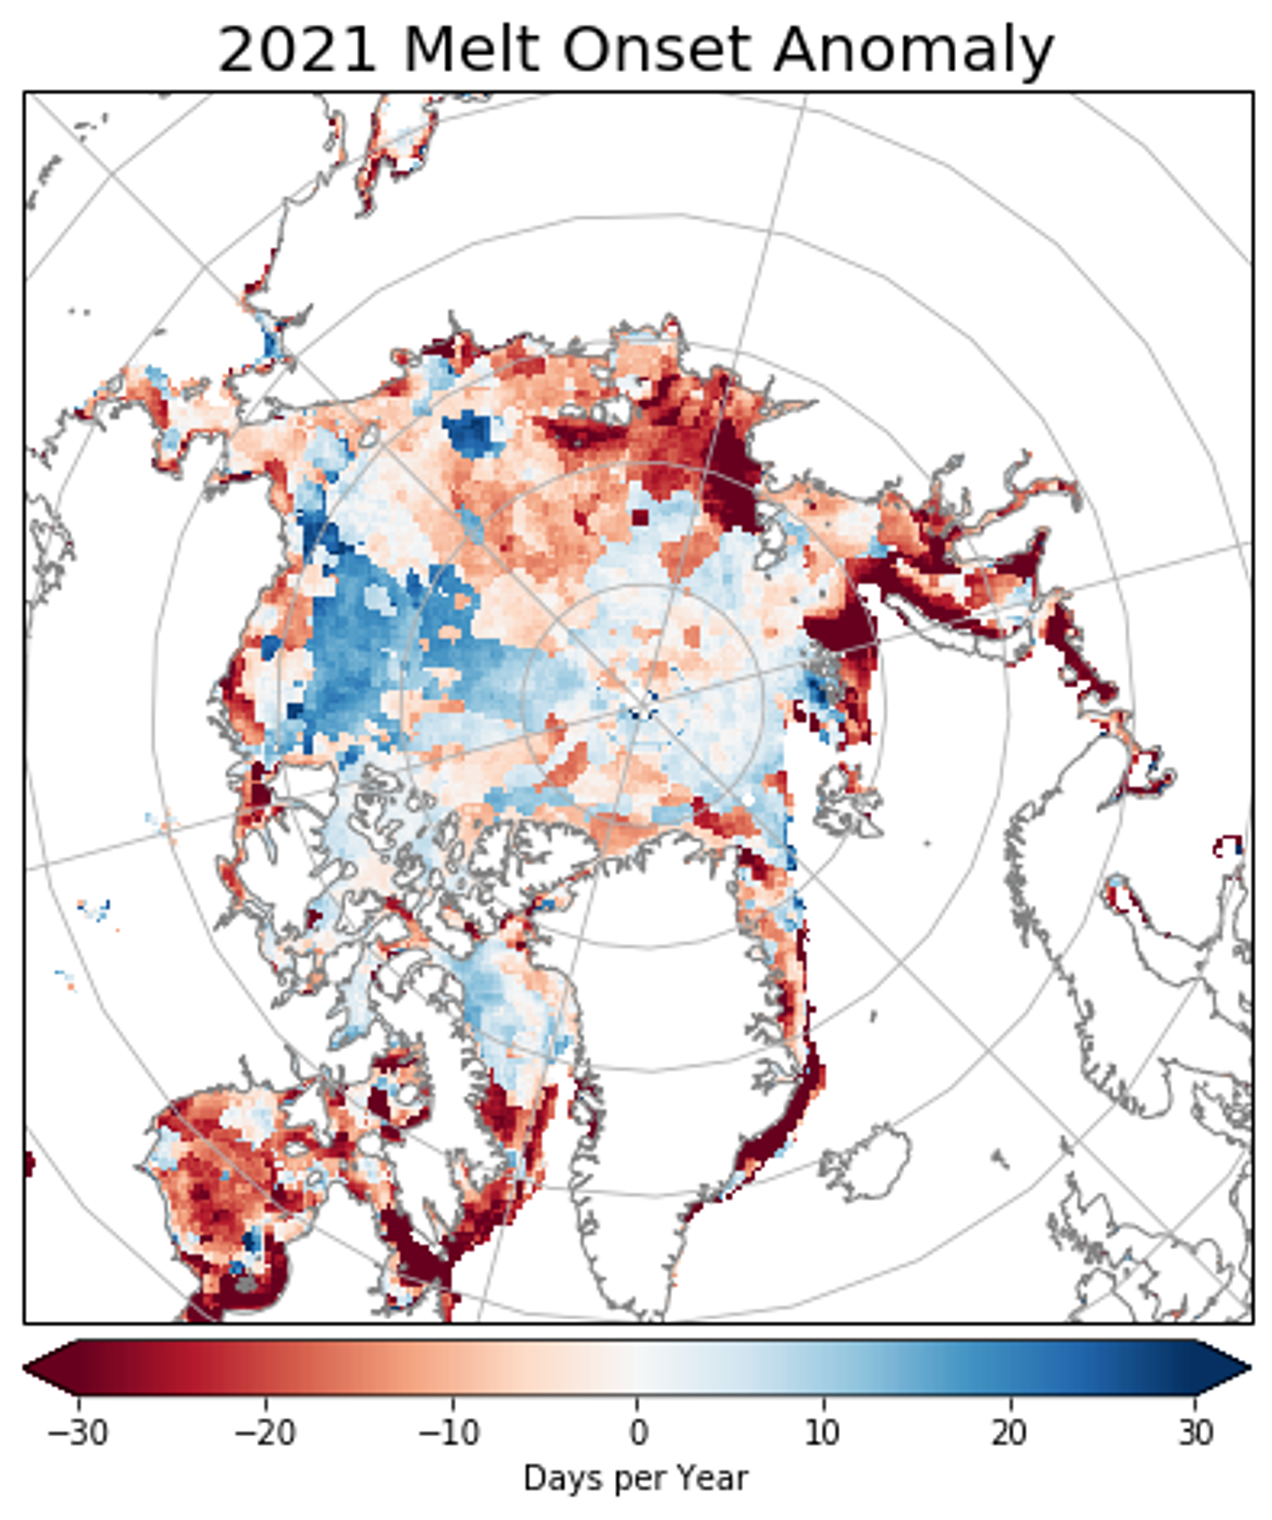
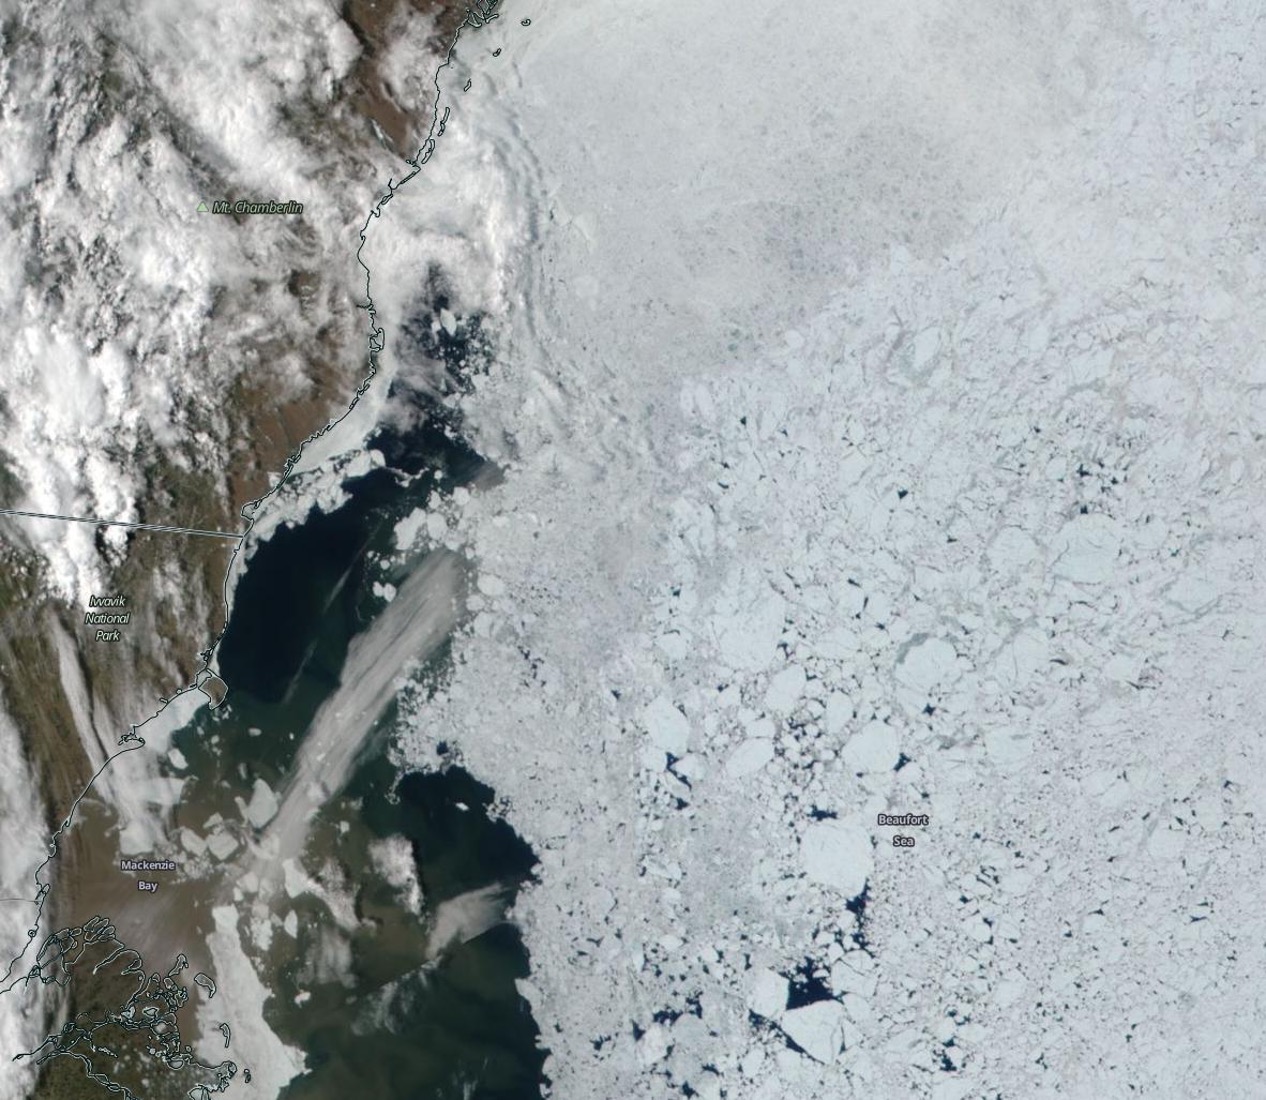
The spring and summer of 2021 were notable for the extremely early melt and retreat of ice in the Laptev Sea, resulting in record low June sea ice extent in that region and much lower extent compared to average throughout the summer (Figure 5a). By contrast, sea ice retreat within the Beaufort and Chukchi Seas was slow and the ice edge remained near its long-term average position throughout summer. At least in part, this reflects the unusually strong transport of thick, old ice into the region during winter; thicker ice is more resistant to melting out in summer. Another interesting feature was the lack of summer ice in the East Greenland Sea. Transport of ice through Fram Strait southward generally feeds a tongue of ice along the eastern coast of Greenland through summer. The lack of summer ice this year can be tied to wind patterns inhibiting this southward flow of ice. Thinner ice encountering warm Atlantic waters may have also played a role.
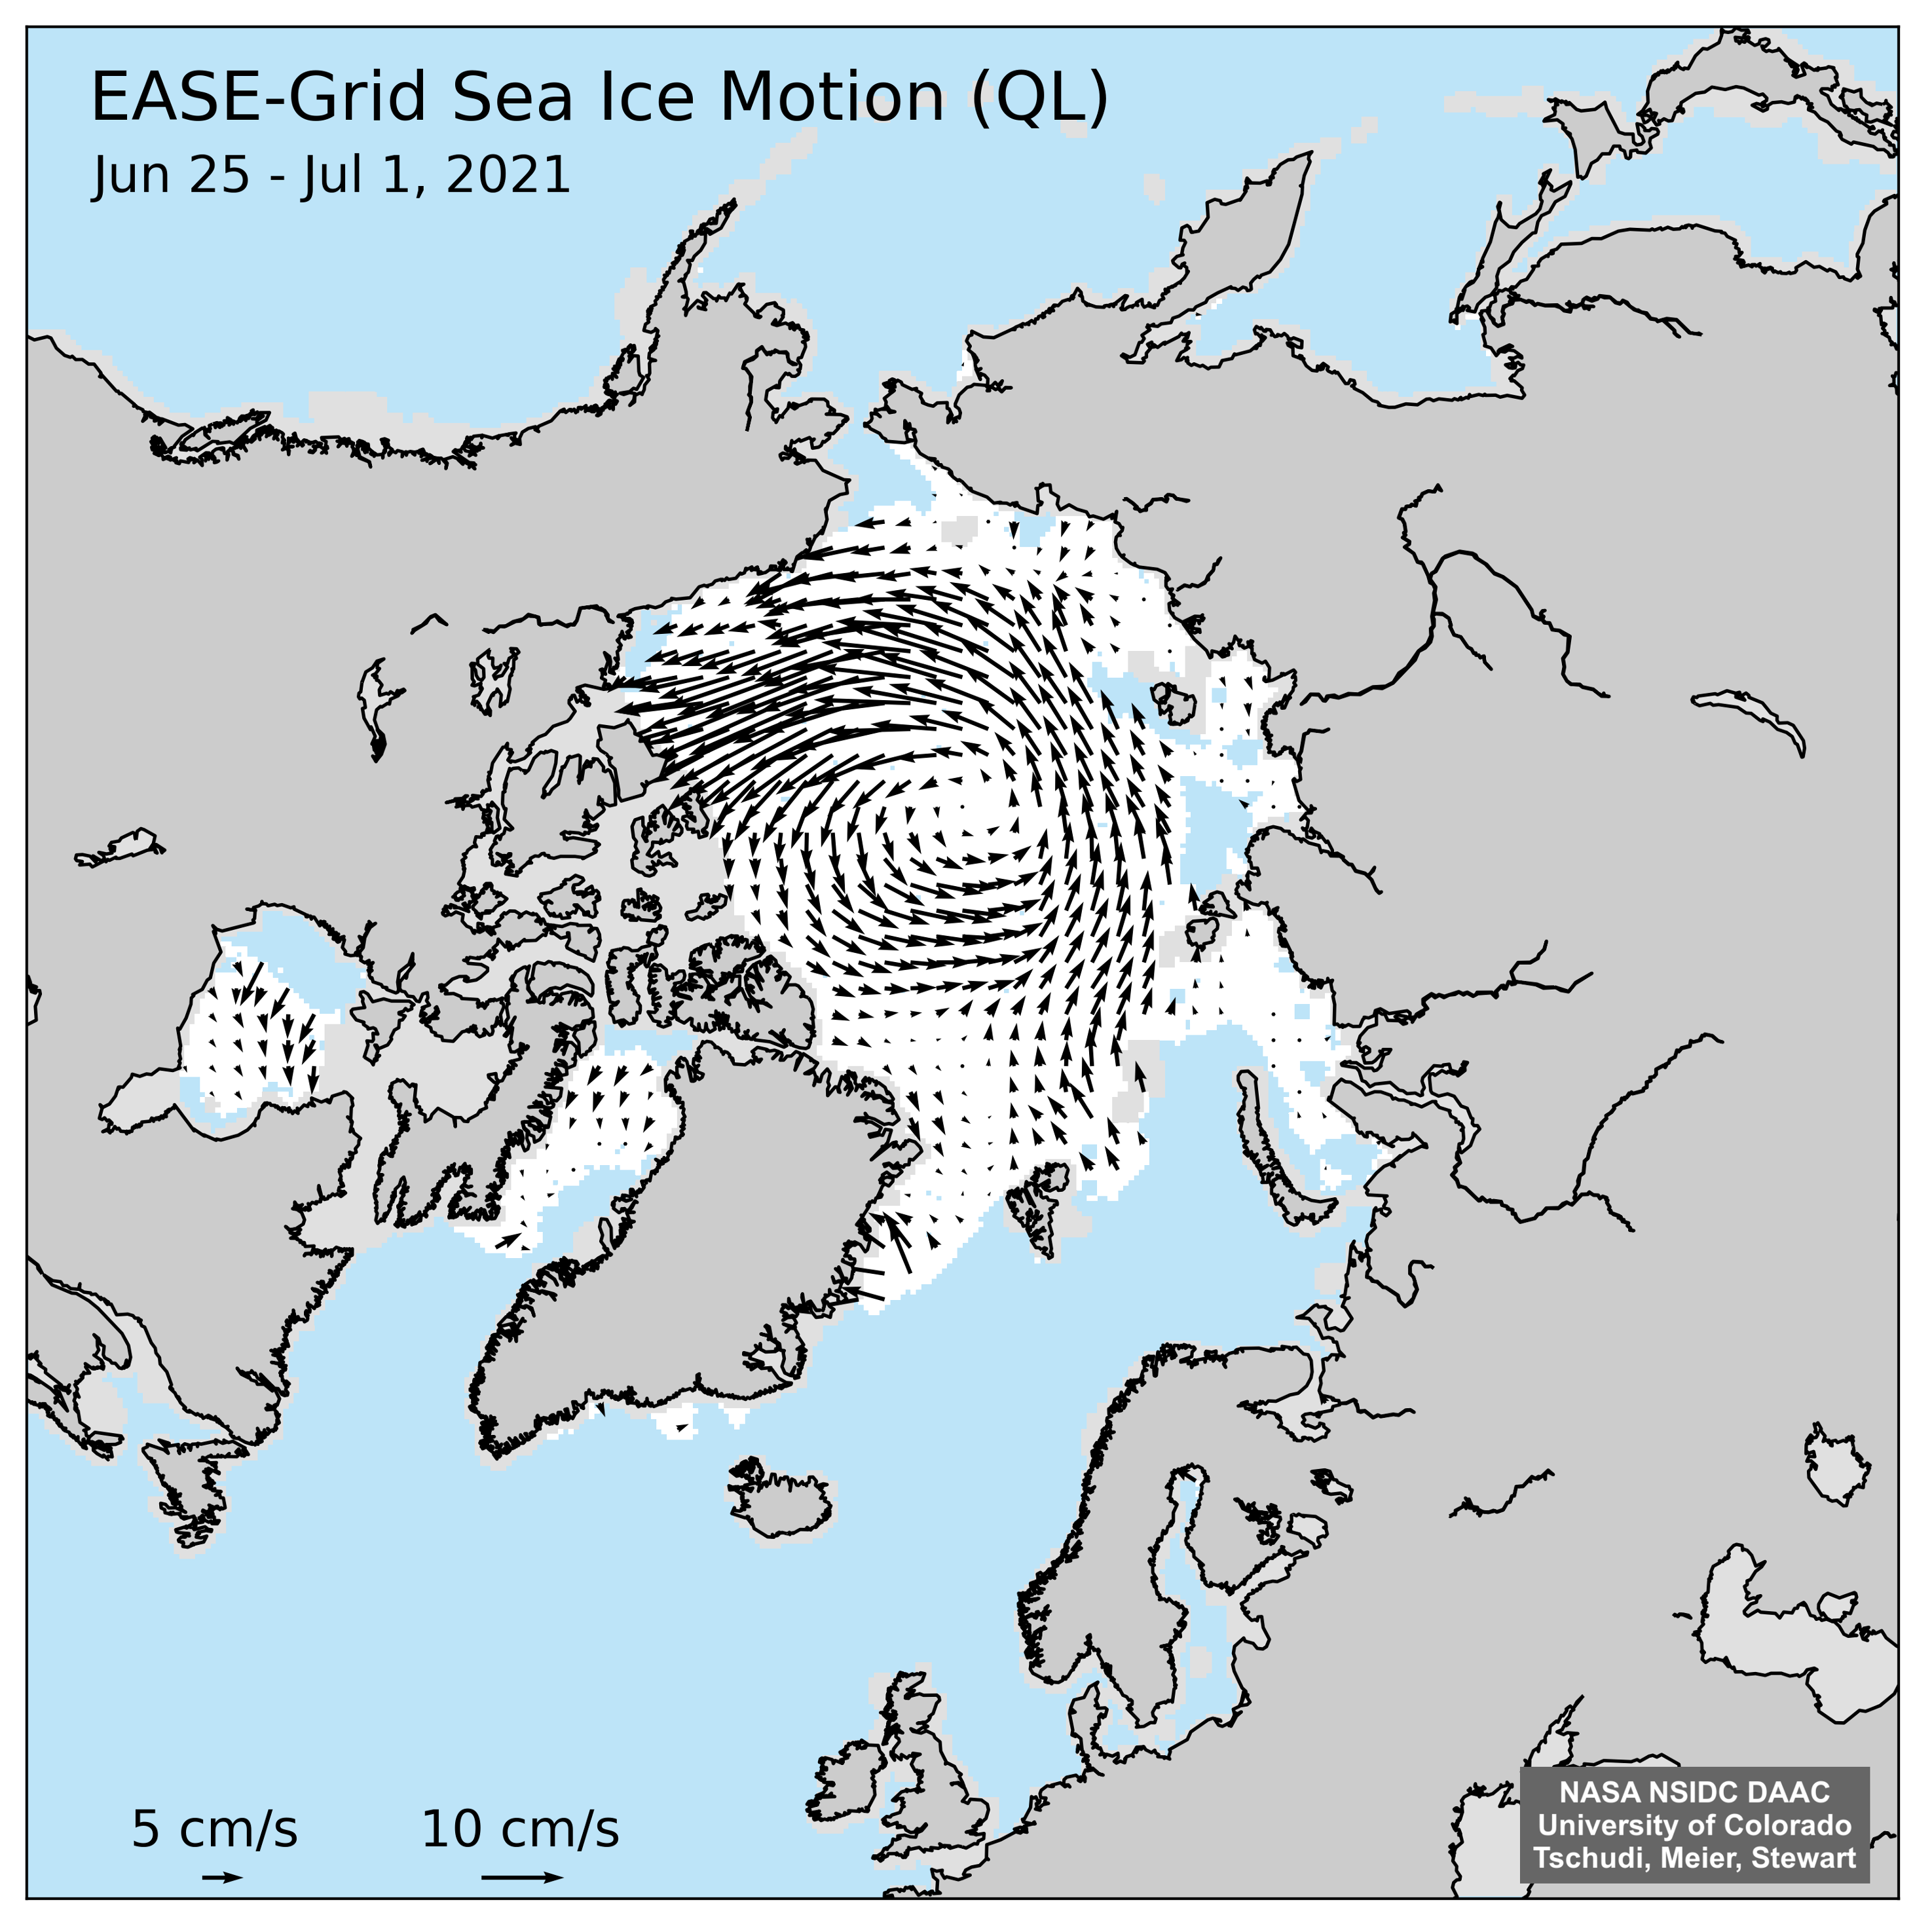
The summer of 2021 was dominated by low sea level pressure over the Arctic Ocean and a lack of a strong Beaufort Gyre circulation (Figure 5b). Cyclone activity over the central Arctic Ocean tends to peak in summer, with cyclones forming over the Eurasian continent migrating into the region and cyclogenesis (cyclone formation) over the Arctic Ocean itself. However, the pattern is quite variable. While the summer of 2021 was characterized by frequent cyclone activity, other summers, like 2019 and 2020, had few cyclones in that region where high pressure prevailed (Figure 5b). Cyclones found over the central Arctic Ocean are of a type known as “cold cored,” which helps to account for the summer of 2021 being fairly cool (Figure 5c).
The ocean surface also remained relatively cool during summer 2021. Sea surface temperatures (SSTs) at summer’s end were lower than the three previous years, based on buoys and the National Oceanic and Atmospheric Administration satellite data (Figure 5d). The summer of 2021 had widespread areas of near-freezing SSTs near the ice edge; this is indicative of late season ice melt cooling the surface and little incoming solar radiation. Low SSTs enable rapid freeze up, as is occurring in those regions. Also, the area with SSTs greater than 5 degrees Celsius (9 degrees Fahrenheit), is much smaller and widespread than in recent years.
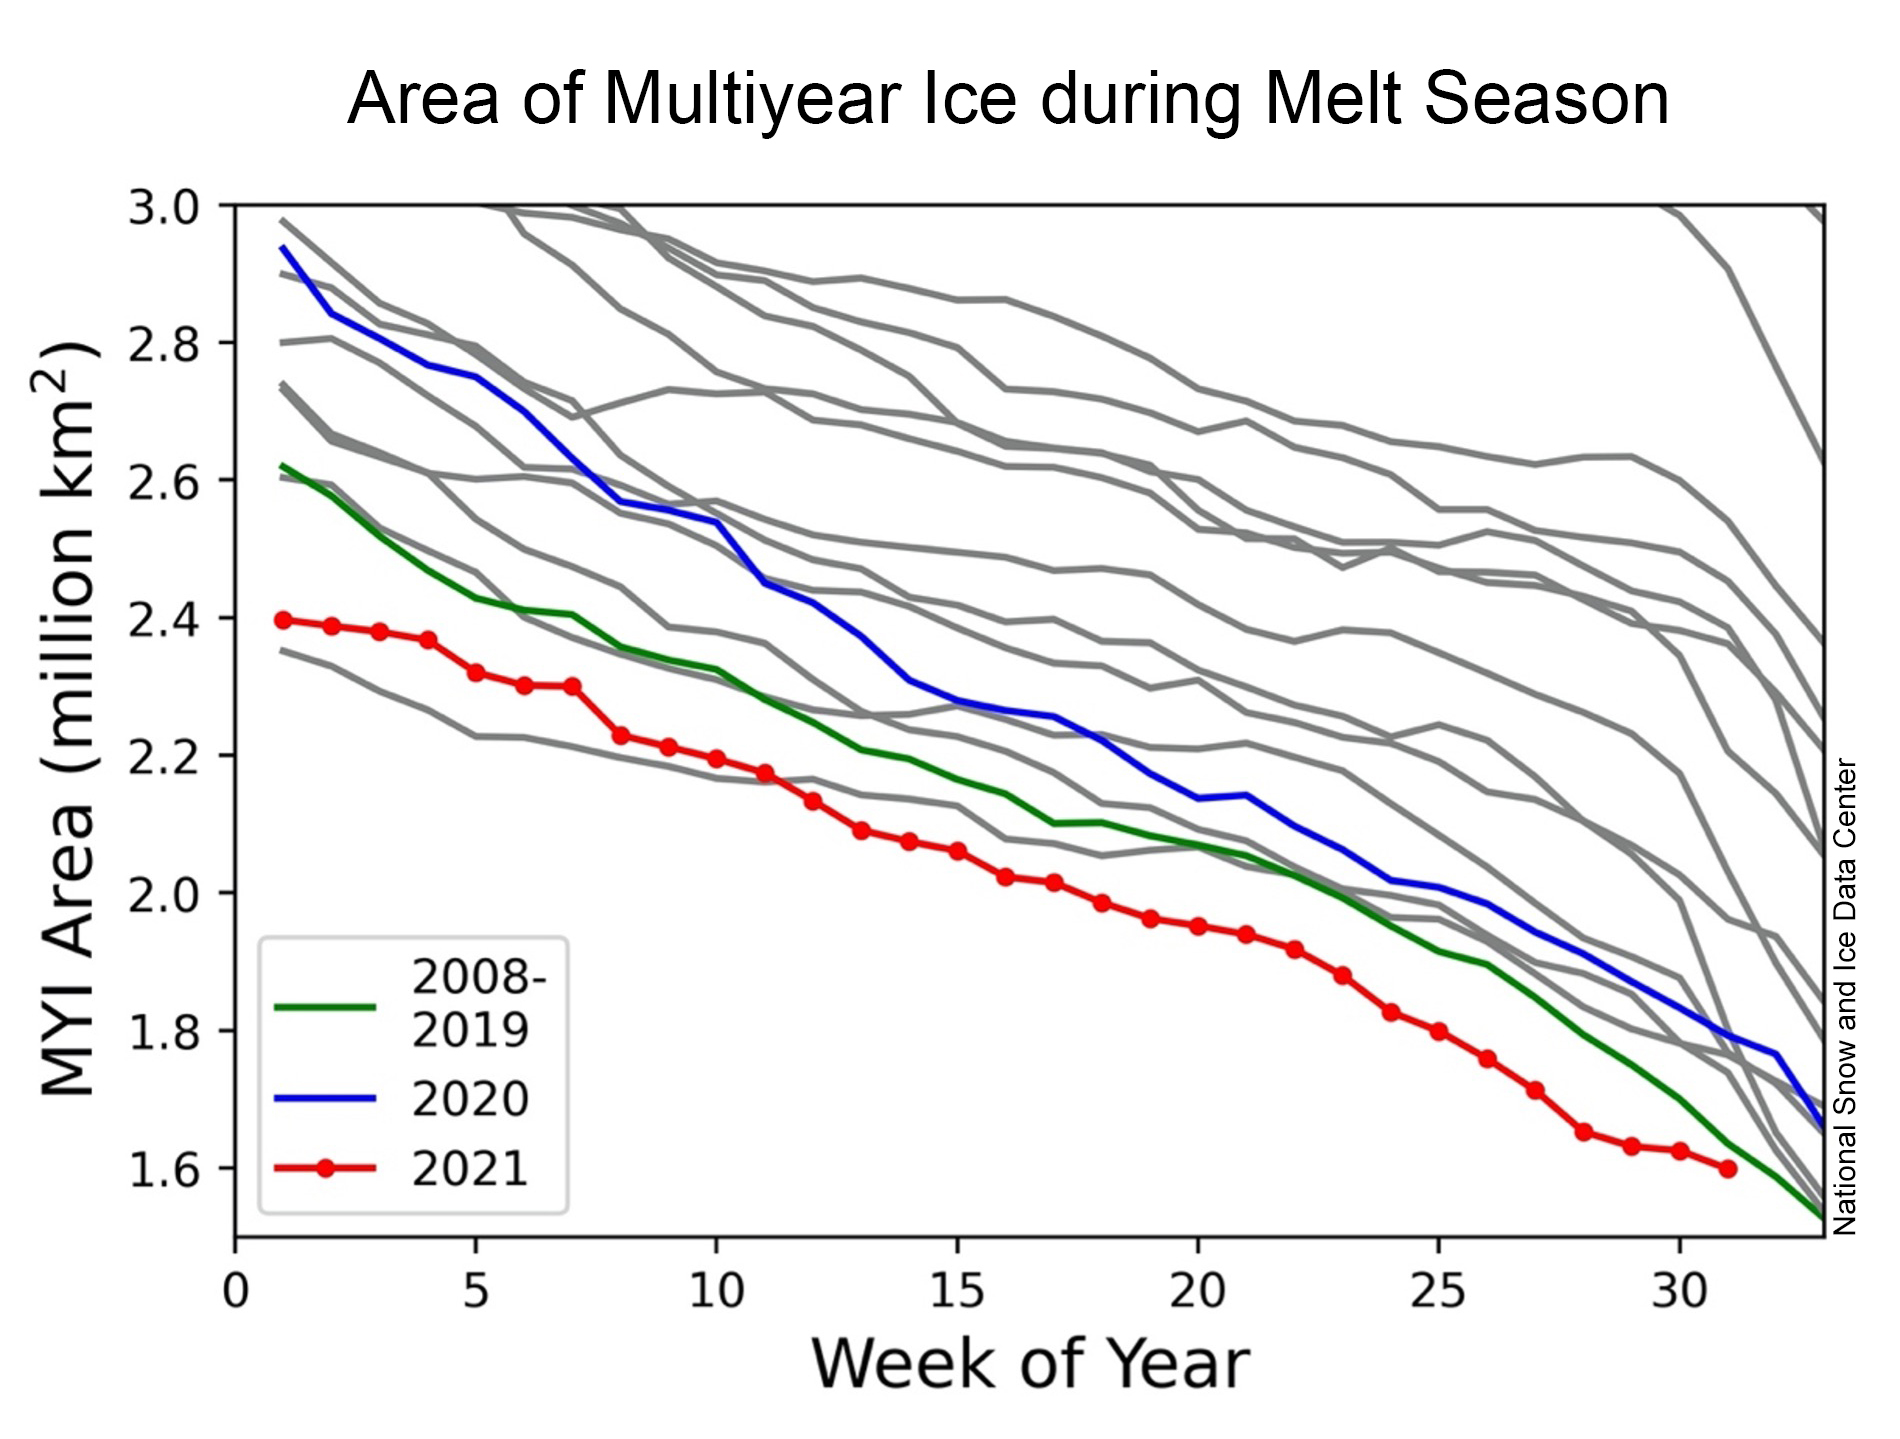
Despite September total ice extent being high compared to recent years, the amount of multiyear ice as assessed from ice age (Figure 5e) reached a near-record low, with an extent of only 1.29 million square kilometers (498,000 square miles), just slightly above the value of 1.27 million square kilometers (490,000 square miles) at the end of the 2012 melt season.
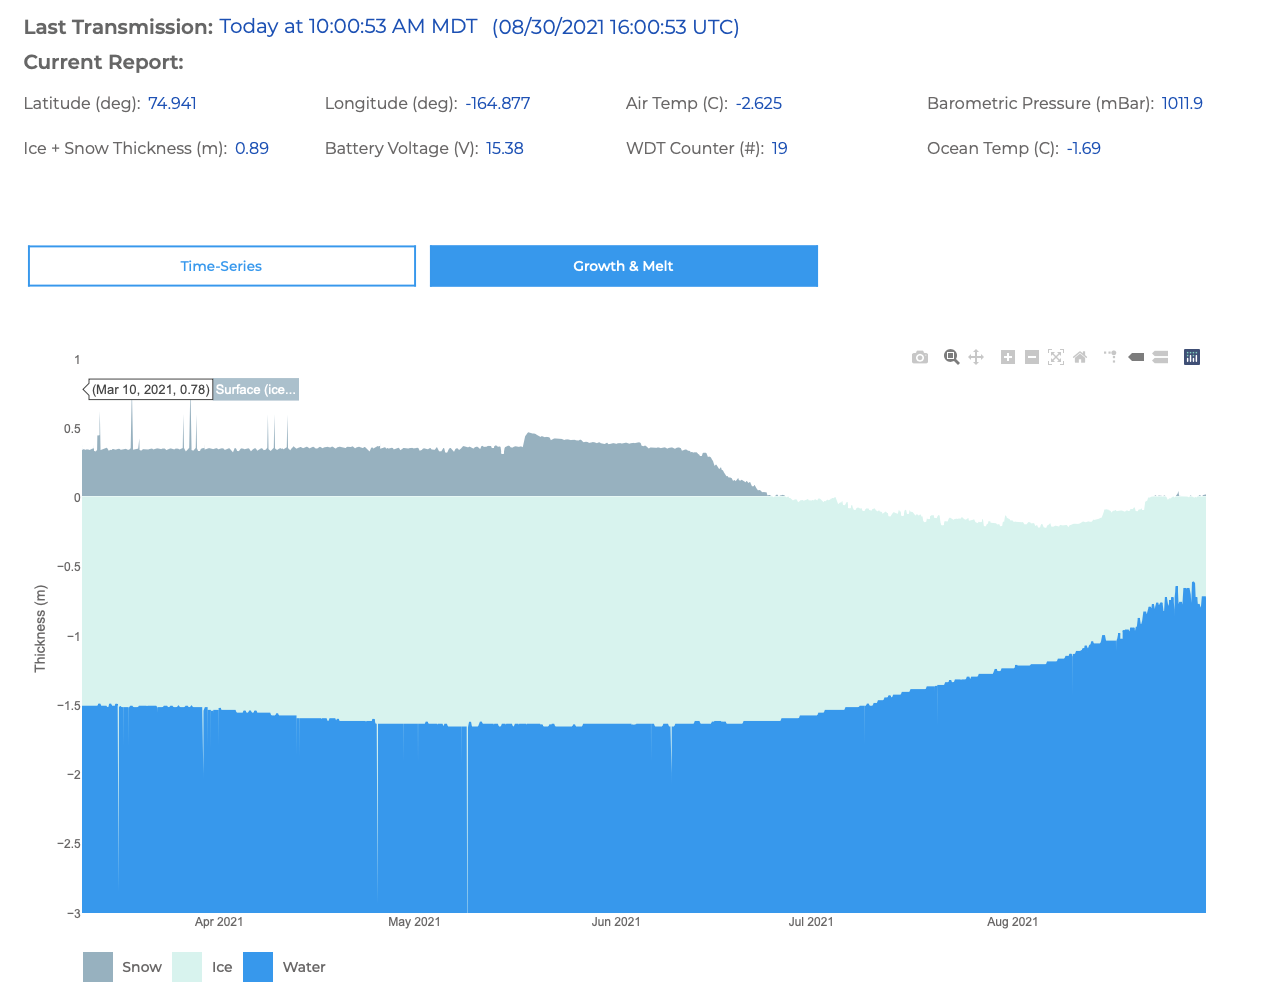
IceBird: Summer sea ice thickness north of Greenland and Fram Strait

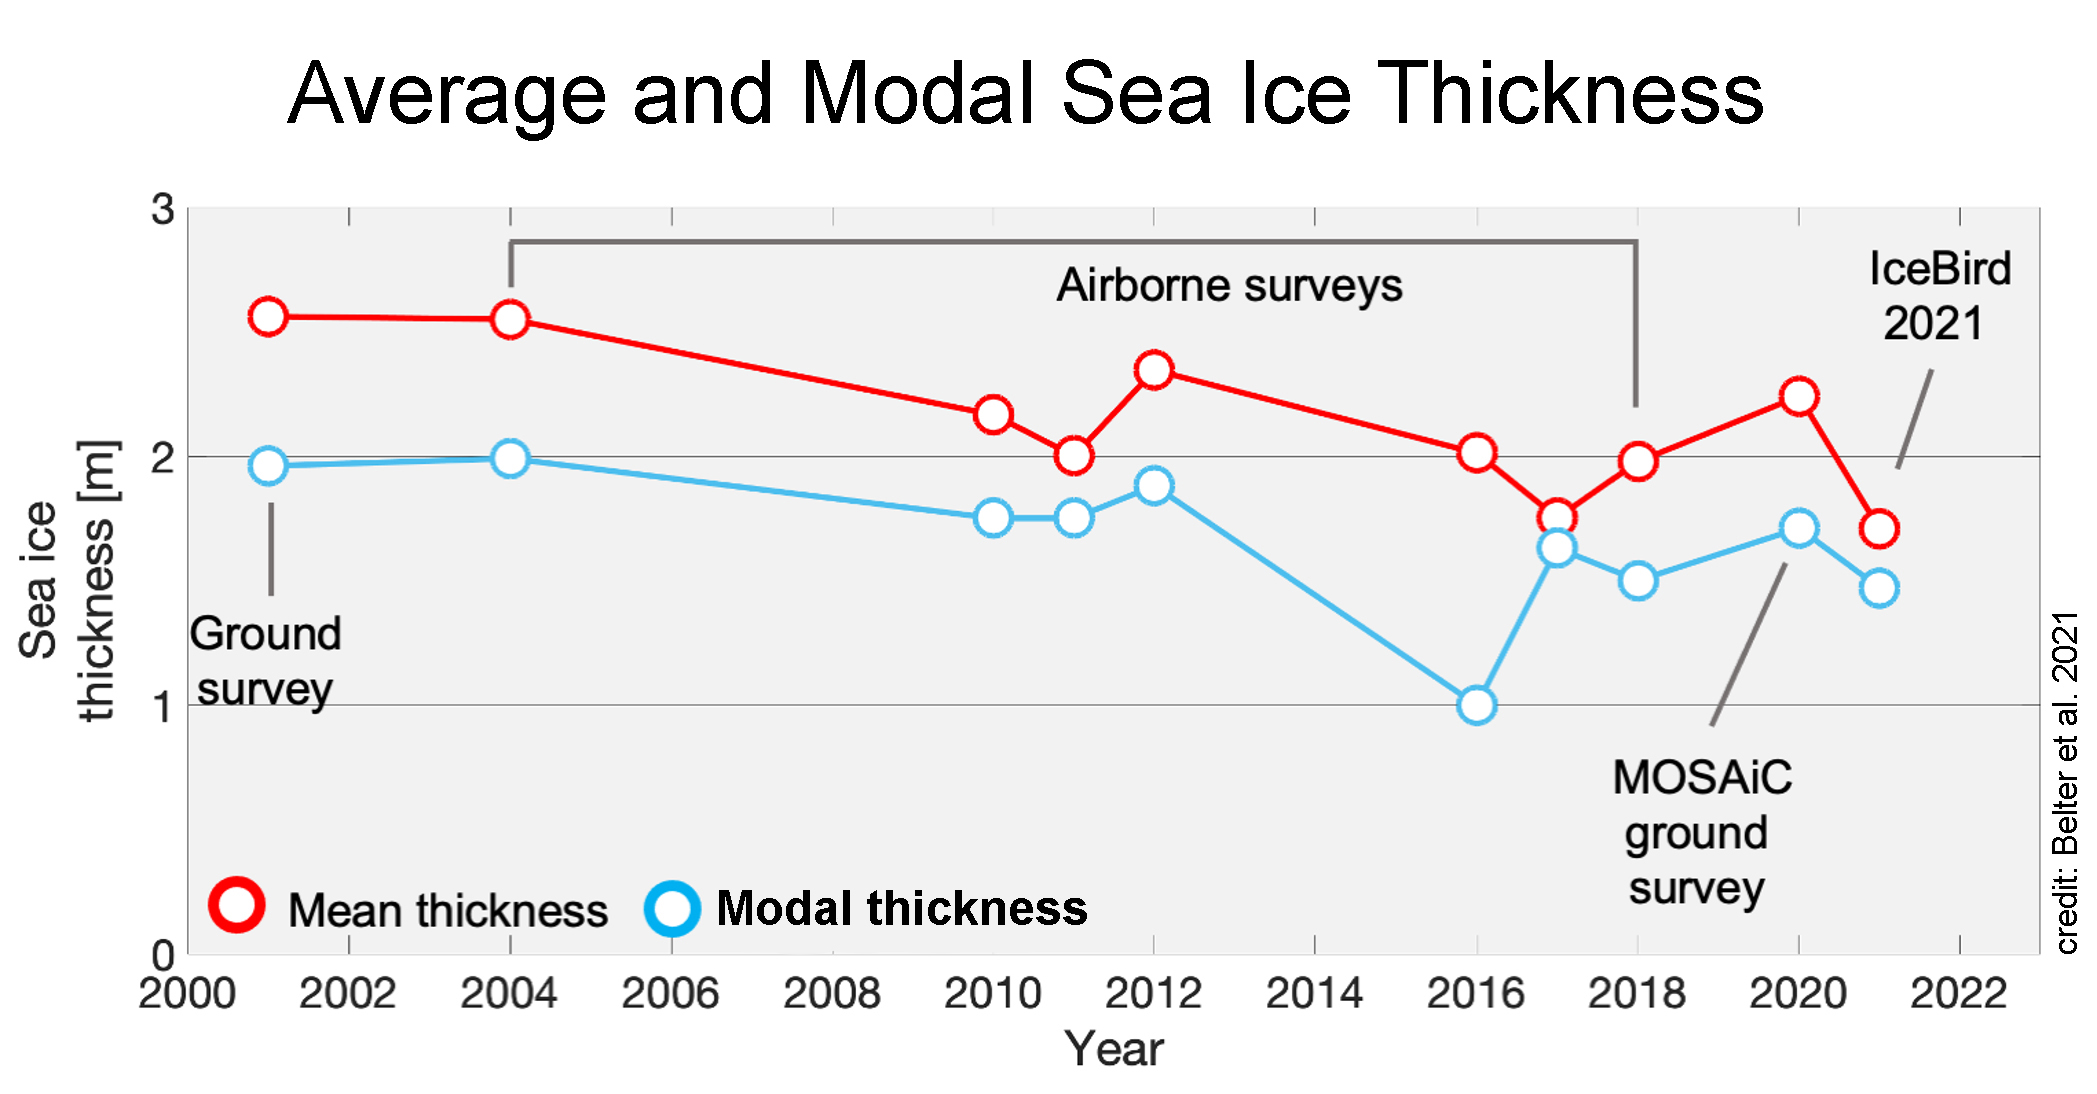
Figure 6. This graph shows average, in red, and modal, in blue, sea ice thickness from the IceBird campaigns between 2001 and 2021. The average thickness is the average of all estimates; the modal thickness is the most frequently observed thickness estimate.
Credit: Belter et al. 2021
High-resolution image
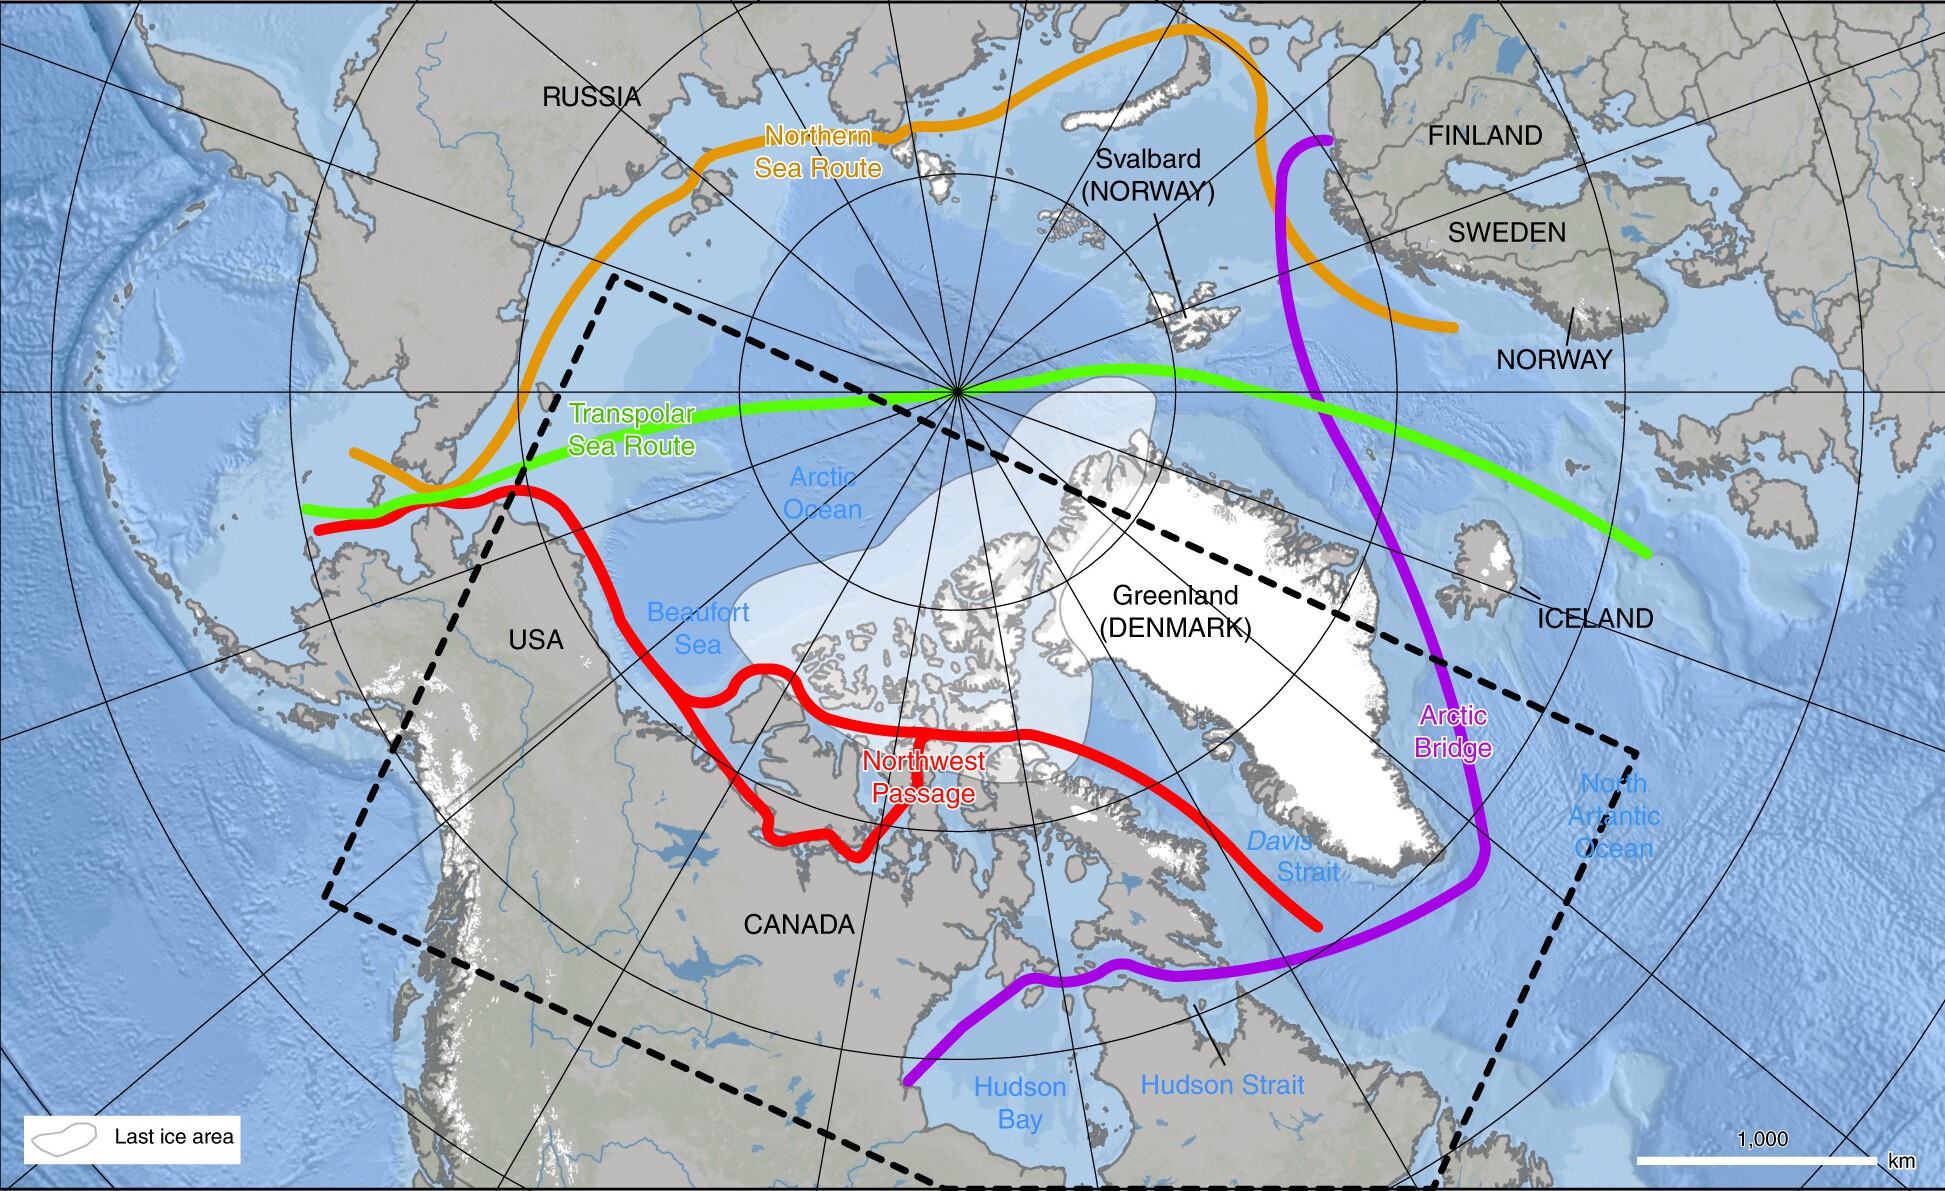
In August 2021, the IceBird Summer campaign continued its observations of sea ice thickness north of Greenland and within northern Fram Strait by means of airborne electromagnetic sounding. Our colleagues J. Belter, T. Krumpen, S. Hendricks, and C. Haas at the Alfred Wegener Institute provided a summary of the campaign. The observed average sea ice thickness of 1.7 meters (5.6 feet) was among the lowest observed since 2001 (Figure 6). Ice motion tracking reveals that the sea ice in this area was originally first-year ice that formed in the shallow shelf in the central Laptev Sea. It was then transported across the Arctic Ocean via the Transpolar Drift Stream. Near the campaign’s base at Station Nord, the reoccurrence of the Wandel Sea polynya led to enhanced melting once the winds had dispersed the ice north.
Nansen Legacy: The northern Barents Sea before and during the 2021 melt season
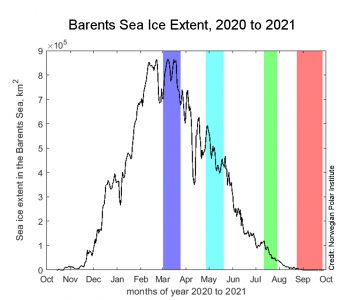
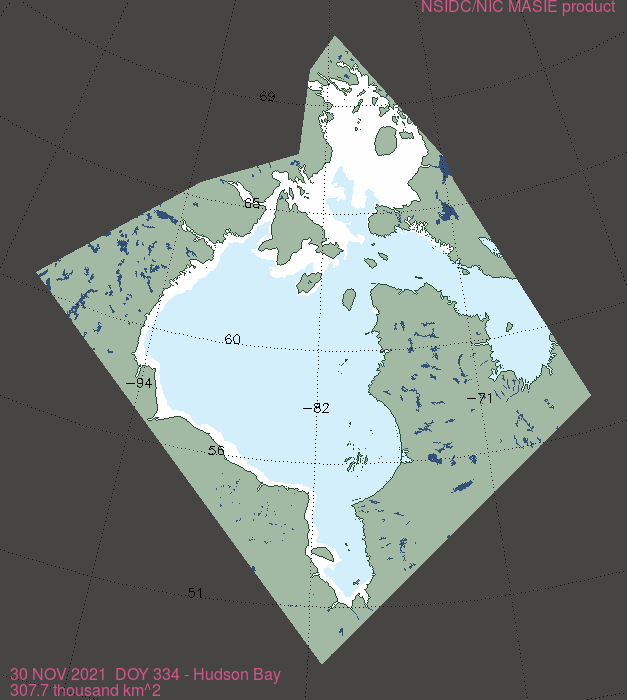
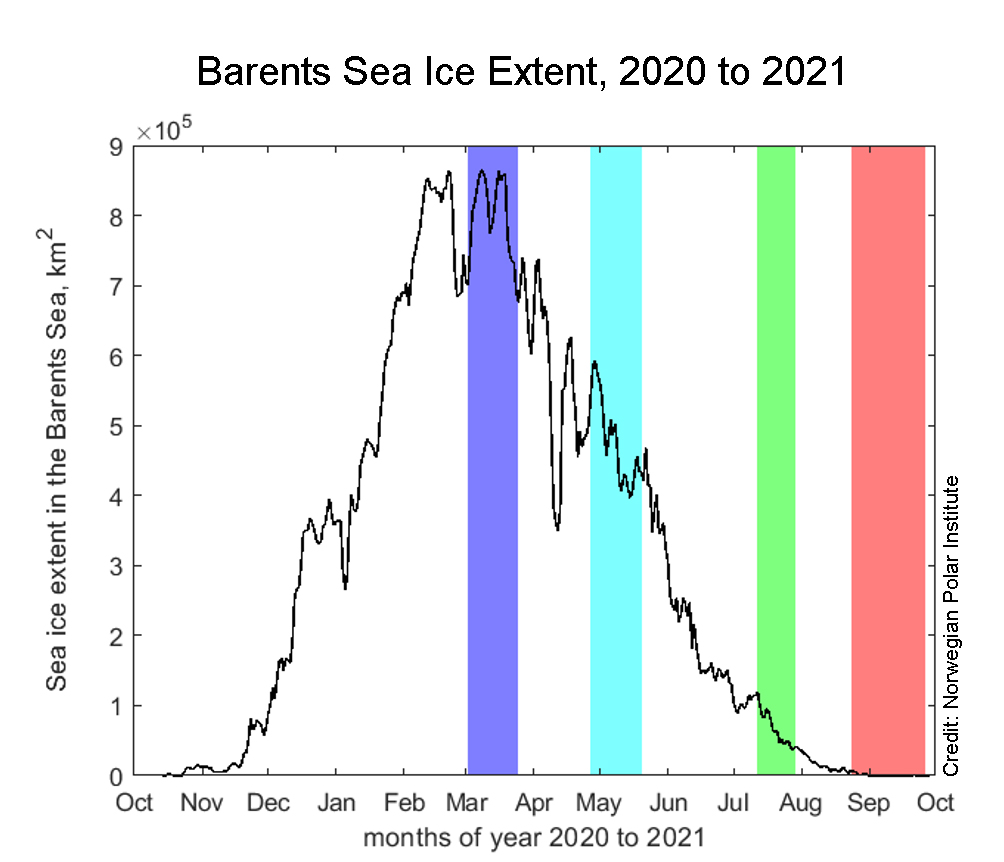
Figure 7a. This graph shows sea ice extent in the Barents Sea from the Multisensor Analyzed Sea Ice Extent – Northern Hemisphere (MASIE-NH) product, with the periods of the four cruises highlighted in color.
Credit: Norwegian Polar Institute
High-resolution image

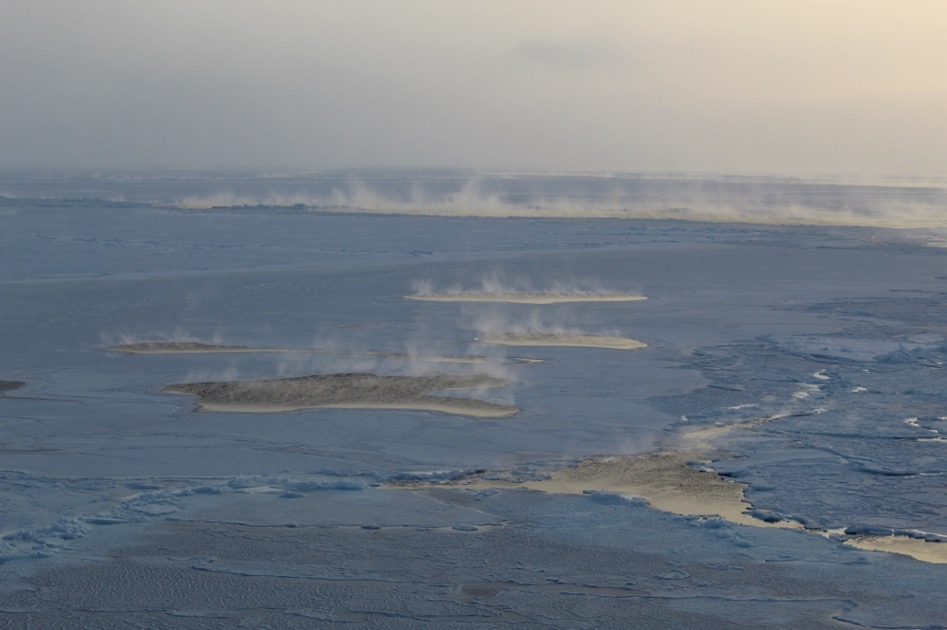
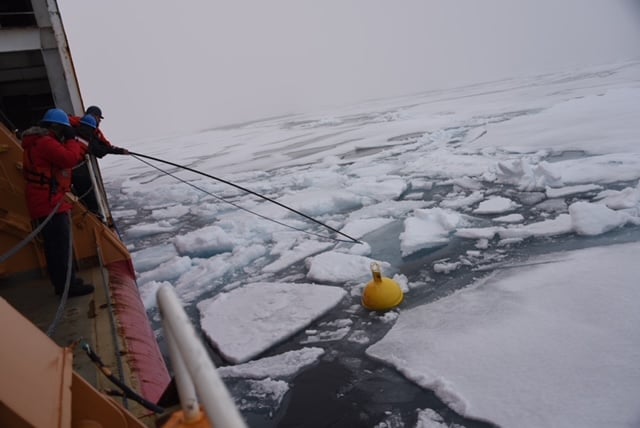
Figure 7b. Sea smoke in leads in between sea ice northeast of Svalbard in March 2021, during a Nansen Legacy research expedition with RV Kronprins Haakon, illustrating the heat exchange between the cold atmosphere and relatively warmer ocean.
Credit: Sebastian Gerland, Norwegian Polar Institute
High-resolution image
During March to September 2021 a series of interdisciplinary research expeditions to the northern Barents Sea were conducted as part of the Norwegian “Nansen Legacy” project. A dedicated sea ice research team worked alongside researchers focused on ocean and ecosystem dynamics, with the aim of understanding the northern Barents Sea ocean, ice, and ecosystem interactions over the period from the regional sea ice maximum to seasonally ice-free conditions (Figure 7a). Our colleagues D. Divine, S. Gerland, A. Steer, and S. Lind at the Norwegian Polar Institute in Tromsø, Norway, provided a summary of the expeditions.
Observations during the voyages revealed a highly dynamic sea ice cover in the area. In March, the northern Barents Sea was covered with mainly level 0.4-to-0.6-meters (1.3-to-2.0-feet) thick sea ice, locally formed sea ice with a tendency towards a greater fraction of ridged ice north of Svalbard. This type of ice persisted in the central Barents Sea through April and May. Long-lasting, stable cold conditions in February to mid-March promoted the formation of large ice floes—often more than 1 square kilometer (0.39 square miles). This relatively thin ice cover experienced a rapid transformation during a single storm event from March 22 to 24, 2021, breaking into floes ranging from 20 to 100 meters (66 to 328 feet) length. At the shelf-break north of the Barents Sea in March 2021, the team observed strong heat losses from the ocean surface, seen as sea smoke (Figure 7b). Measurements also revealed upward oceanic heat fluxes from the deeper Atlantic layer, situated below about 100 meters (328 feet) depth. This likely limited local sea ice production in this region. The relatively warm water in the upper 100 meter (328 feet) likely prevented the ice from further thickening in this region, despite continuous cold atmospheric conditions in the area with air temperatures below -20 degrees Celsius (-4 degrees Fahrenheit), favorable for ice growth.
From May through July, the area northeast of Svalbard was dominated by 1.0 to 1.5 meters (3.3 to 4.9 feet) thick first-year ice that originated in the central Arctic Ocean. In July, sea ice was present only in the very north end of the research area, near the boundary with the Nansen Basin. By August and September, this part of the Barents Sea was ice free.
Acknowledgements
Thanks to Matthew Lazzara of the Antarctic Meteorological Research and Data Center at the University of Wisconsin-Madison, and to Kyle Clem of Victoria University in Wellington, New Zealand.
Further reading
Belter, H. J., T. Krumpen, L. V. Albedyll, T. A. Alekseeva, G. Birnbaum, S. V. Frolov, S. Hendricks, A. Herber, I. Polyakov, I. Raphael, R. Ricker, S. S. Serovetnikov, M. Webster, and C. Haas. 2021. Interannual variability in Transpolar Drift summer sea ice thickness and potential impact of Atlantification. The Cryosphere, 15, 6, 2575-2591, doi:10.5194/tc-15-2575-2021.
Krumpen, T., H. J. Belter, A. Boetius, et al. 2019. Arctic warming interrupts the Transpolar Drift and affects long-range transport of sea ice and ice-rafted matter. Scientific Reports 9, 5459, doi:10.1038/s41598-019-41456-y.
Mallett, R. D. C., J. C. Stroeve, S. B. Cornish, et al. 2021. Record winter winds in 2020/21 drove exceptional Arctic sea ice transport. Communications Earth & Environment 2, 149, doi:10.1038/s43247-021-00221-8
Erratum
On October 13, NSIDC scientists clarified the wording regarding the coldest winter on record for Antarctica: For the interior of the Antarctic continent, specifically the region near the South Pole, the winter of 2021 was among the coldest on record.