The rate of Arctic sea ice loss was somewhat slow through much of July, lowering prospects for a new record low minimum extent in September. The month as a whole was marked by widespread low pressure over most of the Arctic Ocean, which was much more extensive than recorded for June.
Overview of conditions
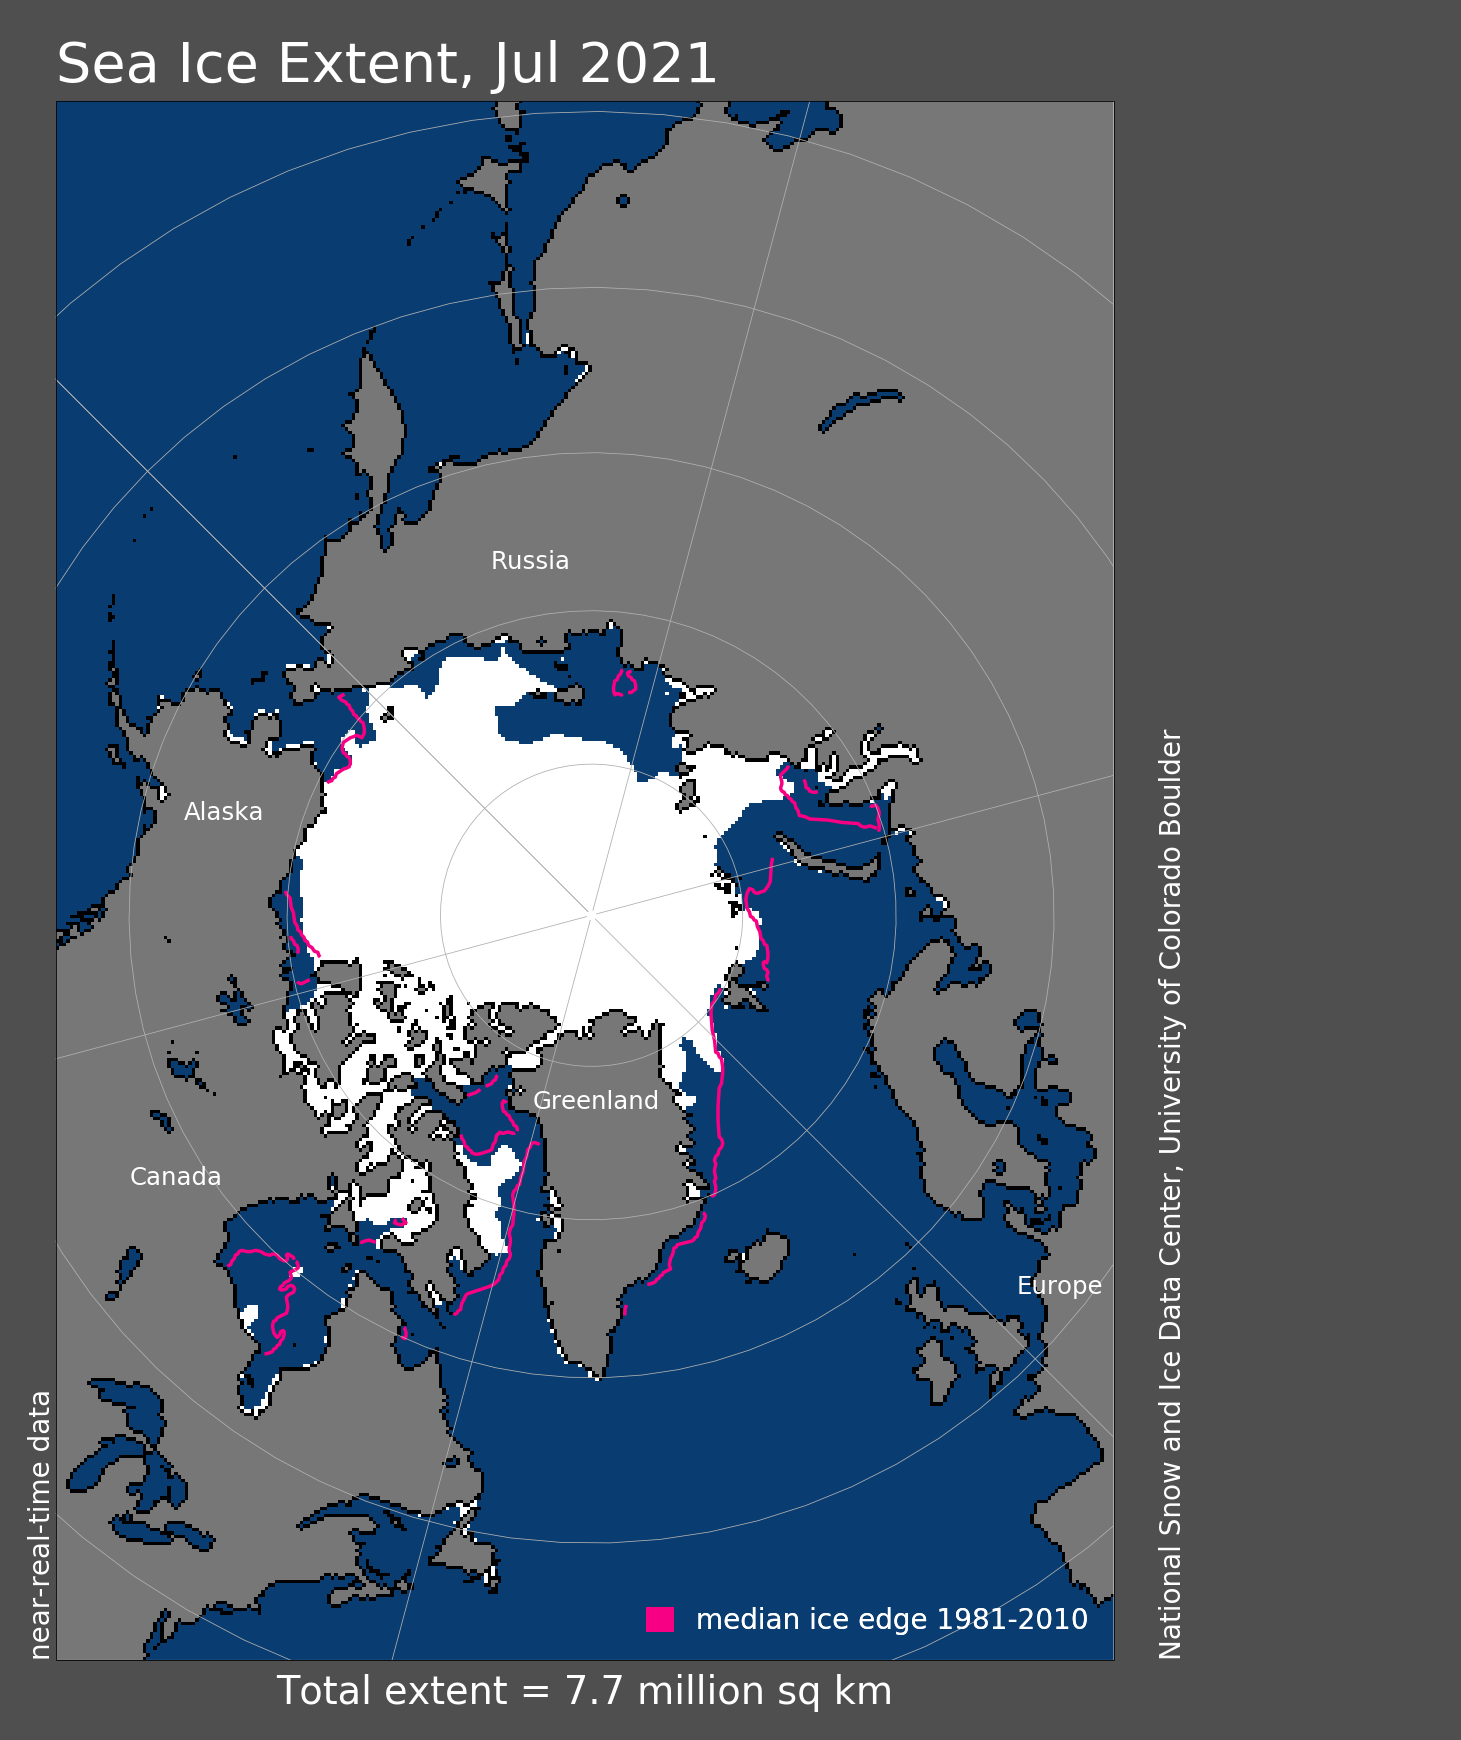
Figure 1. Arctic sea ice extent for July 2021 was 7.69 million square kilometers (2.97 million square miles). The magenta line shows the 1981 to 2010 average extent for that month. Sea Ice Index data. About the data
Credit: National Snow and Ice Data Center
High-resolution image
The seasonal decline in Arctic sea ice extent was fairly rapid during the first week of July, but slowed later in the month. The monthly average extent for July 2021 was 7.69 million square kilometers (2.97 million square miles). This was 400,000 square kilometers (154,000 square miles) above the record low for the month set in 2020 and 1.78 million square kilometers (687,000 square miles) below the 1981 to 2010 average. The average extent for the month ranks fourth lowest in the passive microwave satellite record. The rapid ice loss in the Laptev Sea early in the melt season has slowed, but extent in the Laptev remains well below average. Ice extent in the Beaufort and Chukchi Seas continues to be near the long-term average.
Conditions in context
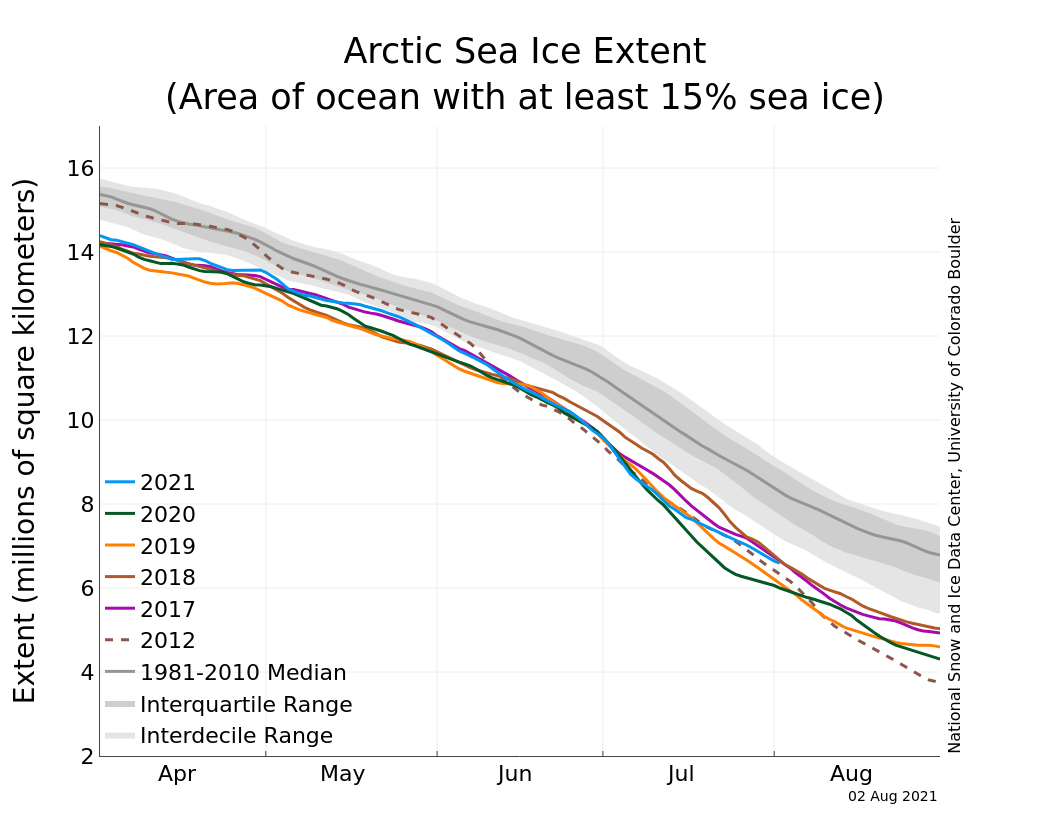
Figure 2a. The graph above shows Arctic sea ice extent as of August 2, 2021, along with daily ice extent data for four previous years and the record low year. 2021 is shown in blue, 2020 in green, 2019 in orange, 2018 in brown, 2017 in magenta, and 2012 in dashed brown. The 1981 to 2010 median is in dark gray. The gray areas around the median line show the interquartile and interdecile ranges of the data. Sea Ice Index data.
Credit: National Snow and Ice Data Center
High-resolution image
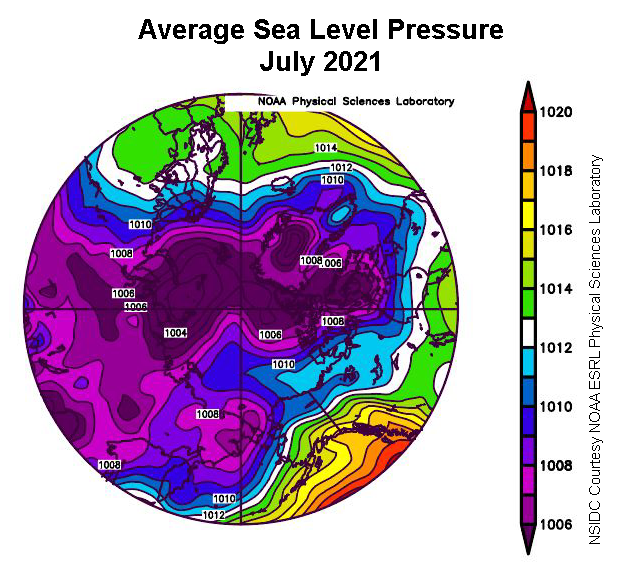
Figure 2b. This plot shows average sea level pressure in the Arctic in millibars from July 1 to 31, 2021. Yellows and reds indicate high air pressure; blues and purples indicate low pressure.
Credit: NSIDC courtesy NOAA Earth System Research Laboratory Physical Sciences Division
High-resolution image
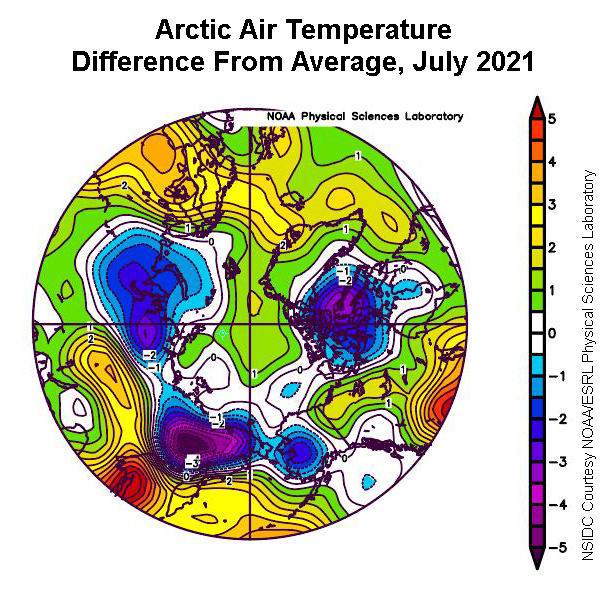
Figure 2c. This plot shows the departure from average air temperature in the Arctic at the 925 hPa level, in degrees Celsius, for July 2021. Yellows and reds indicate higher than average temperatures; blues and purples indicate lower than average temperatures.
Credit: NSIDC courtesy NOAA Earth System Research Laboratory Physical Sciences Division
High-resolution image
At the start of July, sea ice extent was above the levels recorded in 2012, the year that ended up with the lowest September ice extent in the satellite record. However, fairly rapid ice loss during the first week of July brought extent below 2012 levels. From July 4 to July 9, the 2021 extent was the lowest in the satellite record for that time of the year. However, the loss rate then slowed, and by late July, 2021 extent was tracking above 2020, 2019, 2011, and 2007 (Figure 2a). Overall, sea ice extent decreased by 2.96 million square kilometers (1.14 million square miles) during July 2021. This corresponds to an average loss of 95,300 square kilometers (36,800 square miles) per day, slightly faster than the 1981 to 2010 July average daily loss.
Low pressure continued to dominate the Arctic Ocean region in July, becoming more widespread than in June, with some indications that the pattern was breaking down late in the month. Monthly mean sea level pressures were below 1,004 millibars over most of the Arctic Ocean (Figure 2b). The low pressure brought generally cloudy conditions. Air temperatures at the 925-millibar level (about 2,500 feet above the surface) were within about two degrees Celsius (4 degrees Fahrenheit) of average over nearly all of the Arctic Ocean (Figure 2c).
July 2021 compared to previous years
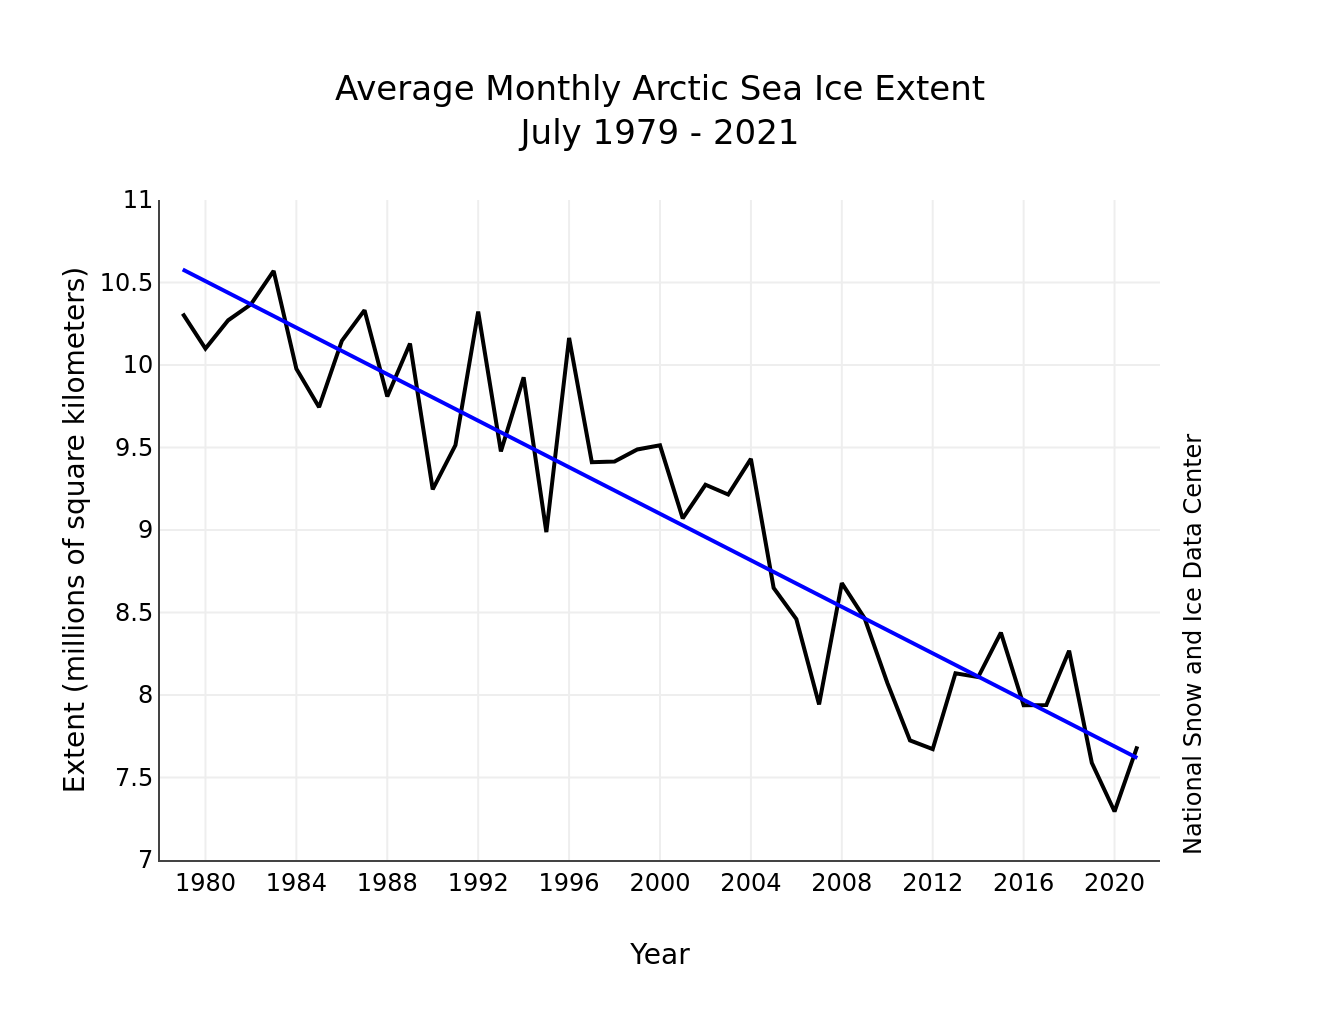
Figure 3. Monthly July ice extent for 1979 to 2021 shows a decline of 7.5 percent per decade.
Credit: National Snow and Ice Data Center
High-resolution image
Through 2021, the linear rate of decline for July sea ice extent is 7.5 percent per decade. This corresponds to 70,500 square kilometers (27,200 square miles) per year. The cumulative July ice loss over the 43-year satellite record is 2.96 million square kilometers (1.14 million square miles) based on the difference in linear trend values in 2021 and 1979. The loss of ice in July since 1979 is equivalent to about ten times the size of Arizona.
Northern routes across the Arctic
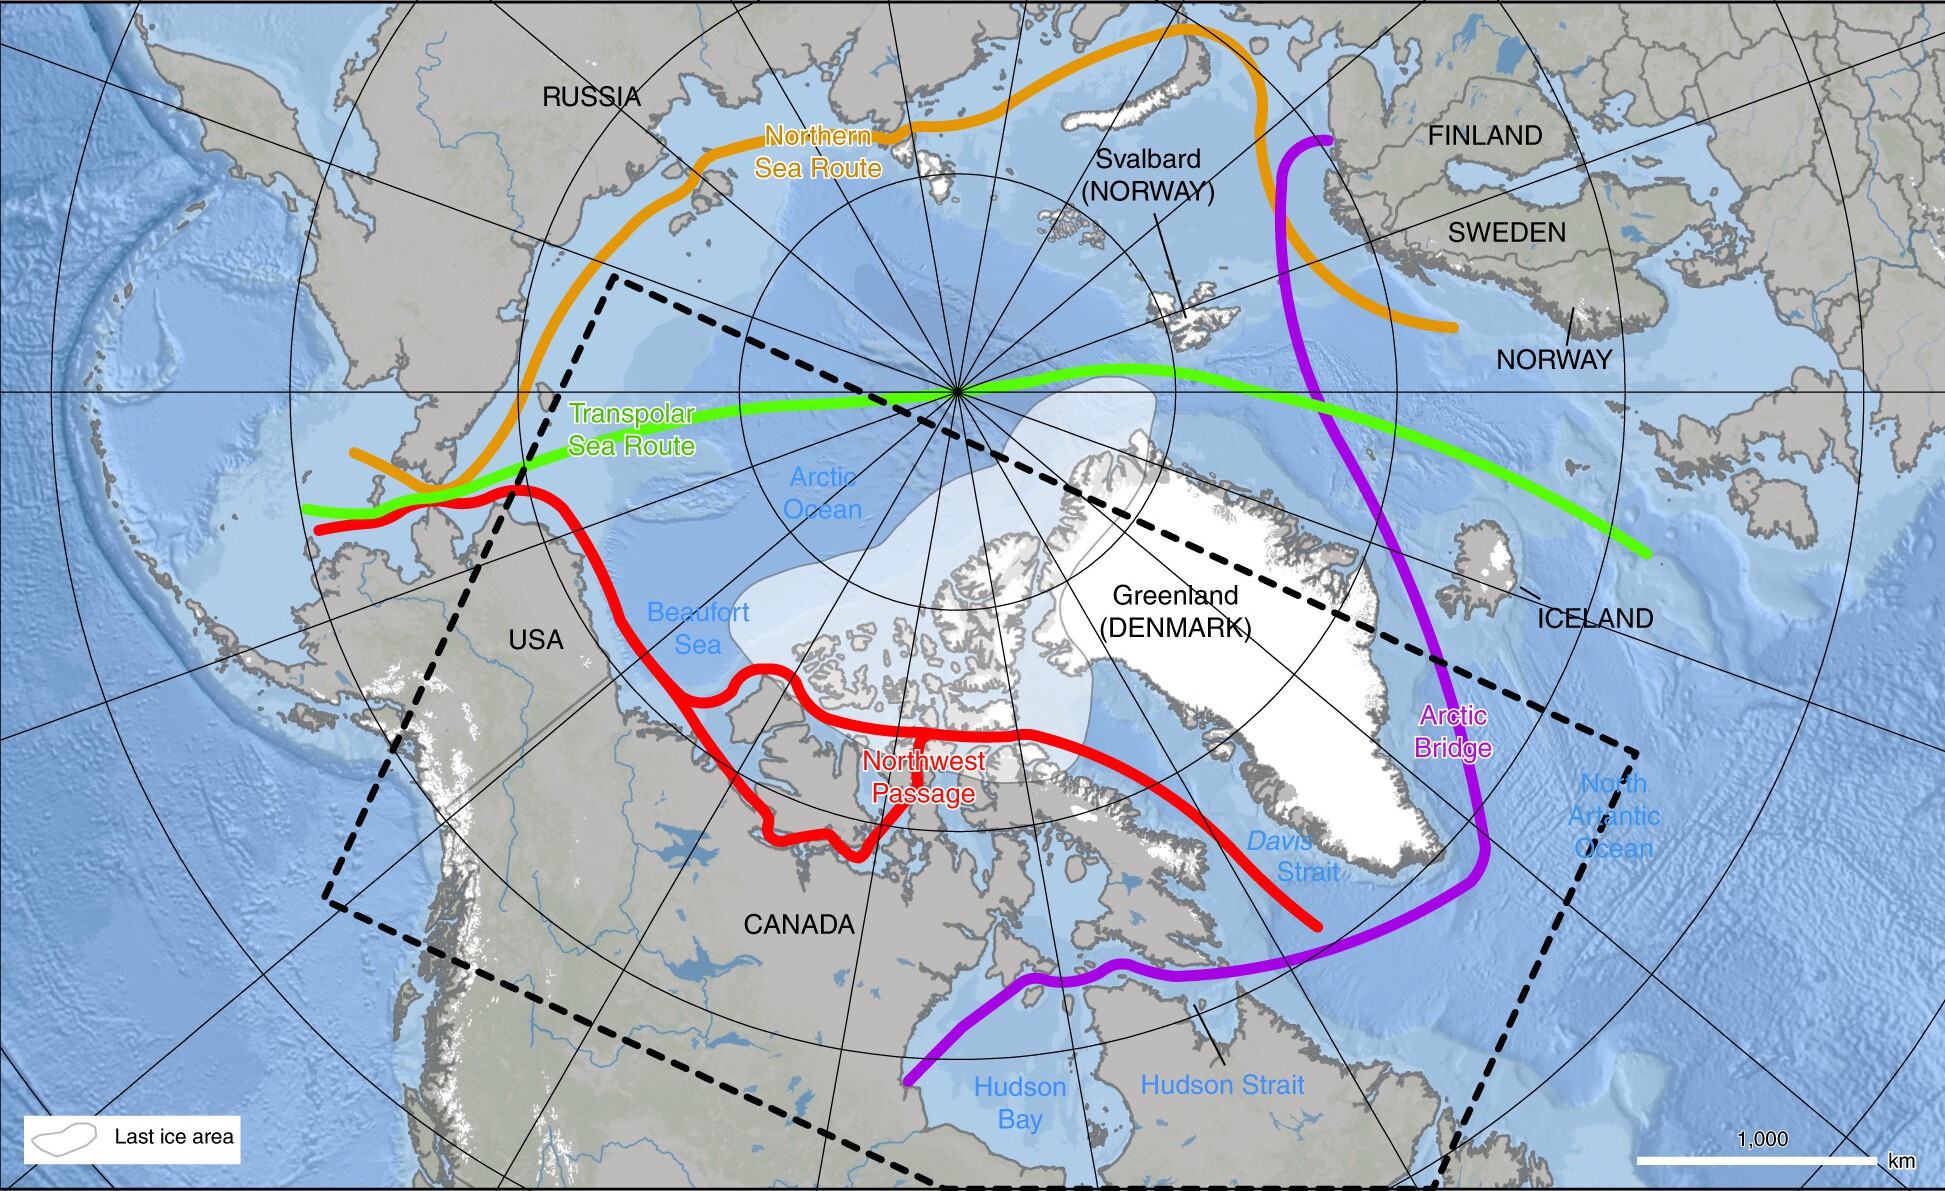
Figure 4. This image shows potential navigational routes through the Arctic from Mudryk et al., 2021.
Credit: Mudryk et al., 2021.
High-resolution image
In recent years, the trans-Arctic Northern Sea Route corridor along the Russian coast has become ice free, or nearly so, in summer, with significant commercial shipping transport (in general, with icebreaker escort). Things are looking different this year. While sea ice receded from the coast in the Laptev Sea several weeks ago, the Kara Sea coastline still remains locked in ice. In the Eastern Siberian Sea, ice remains near the coast. Whether these areas will clear of ice by the end of summer remains to be seen.
The southern route of the Northwest Passage through the channels of the Canadian Archipelago (Figure 4) is still locked in ice and seems unlikely to open in any significant way this year. However, more open summer conditions are likely in the future as temperatures continue to increase, according to a recent study in Nature Climate Change. Led by Lawrence Mudryk at Environment and Climate Change Canada, the study examines ice conditions under future warming scenarios. Based on climate model projections, the authors found that under 2 degrees Celsius (4 degrees Fahrenheit) of global warming, the target of the Paris Agreement, there is a 100 percent probability that the Northwest Passage will be navigable for at least some period by the end of summer. A caveat is that the current climate models do not necessarily capture processes that result in thick ice piling up due to winds and currents pushing ice from the Arctic Ocean into the archipelago’s channels.
Rising in the south
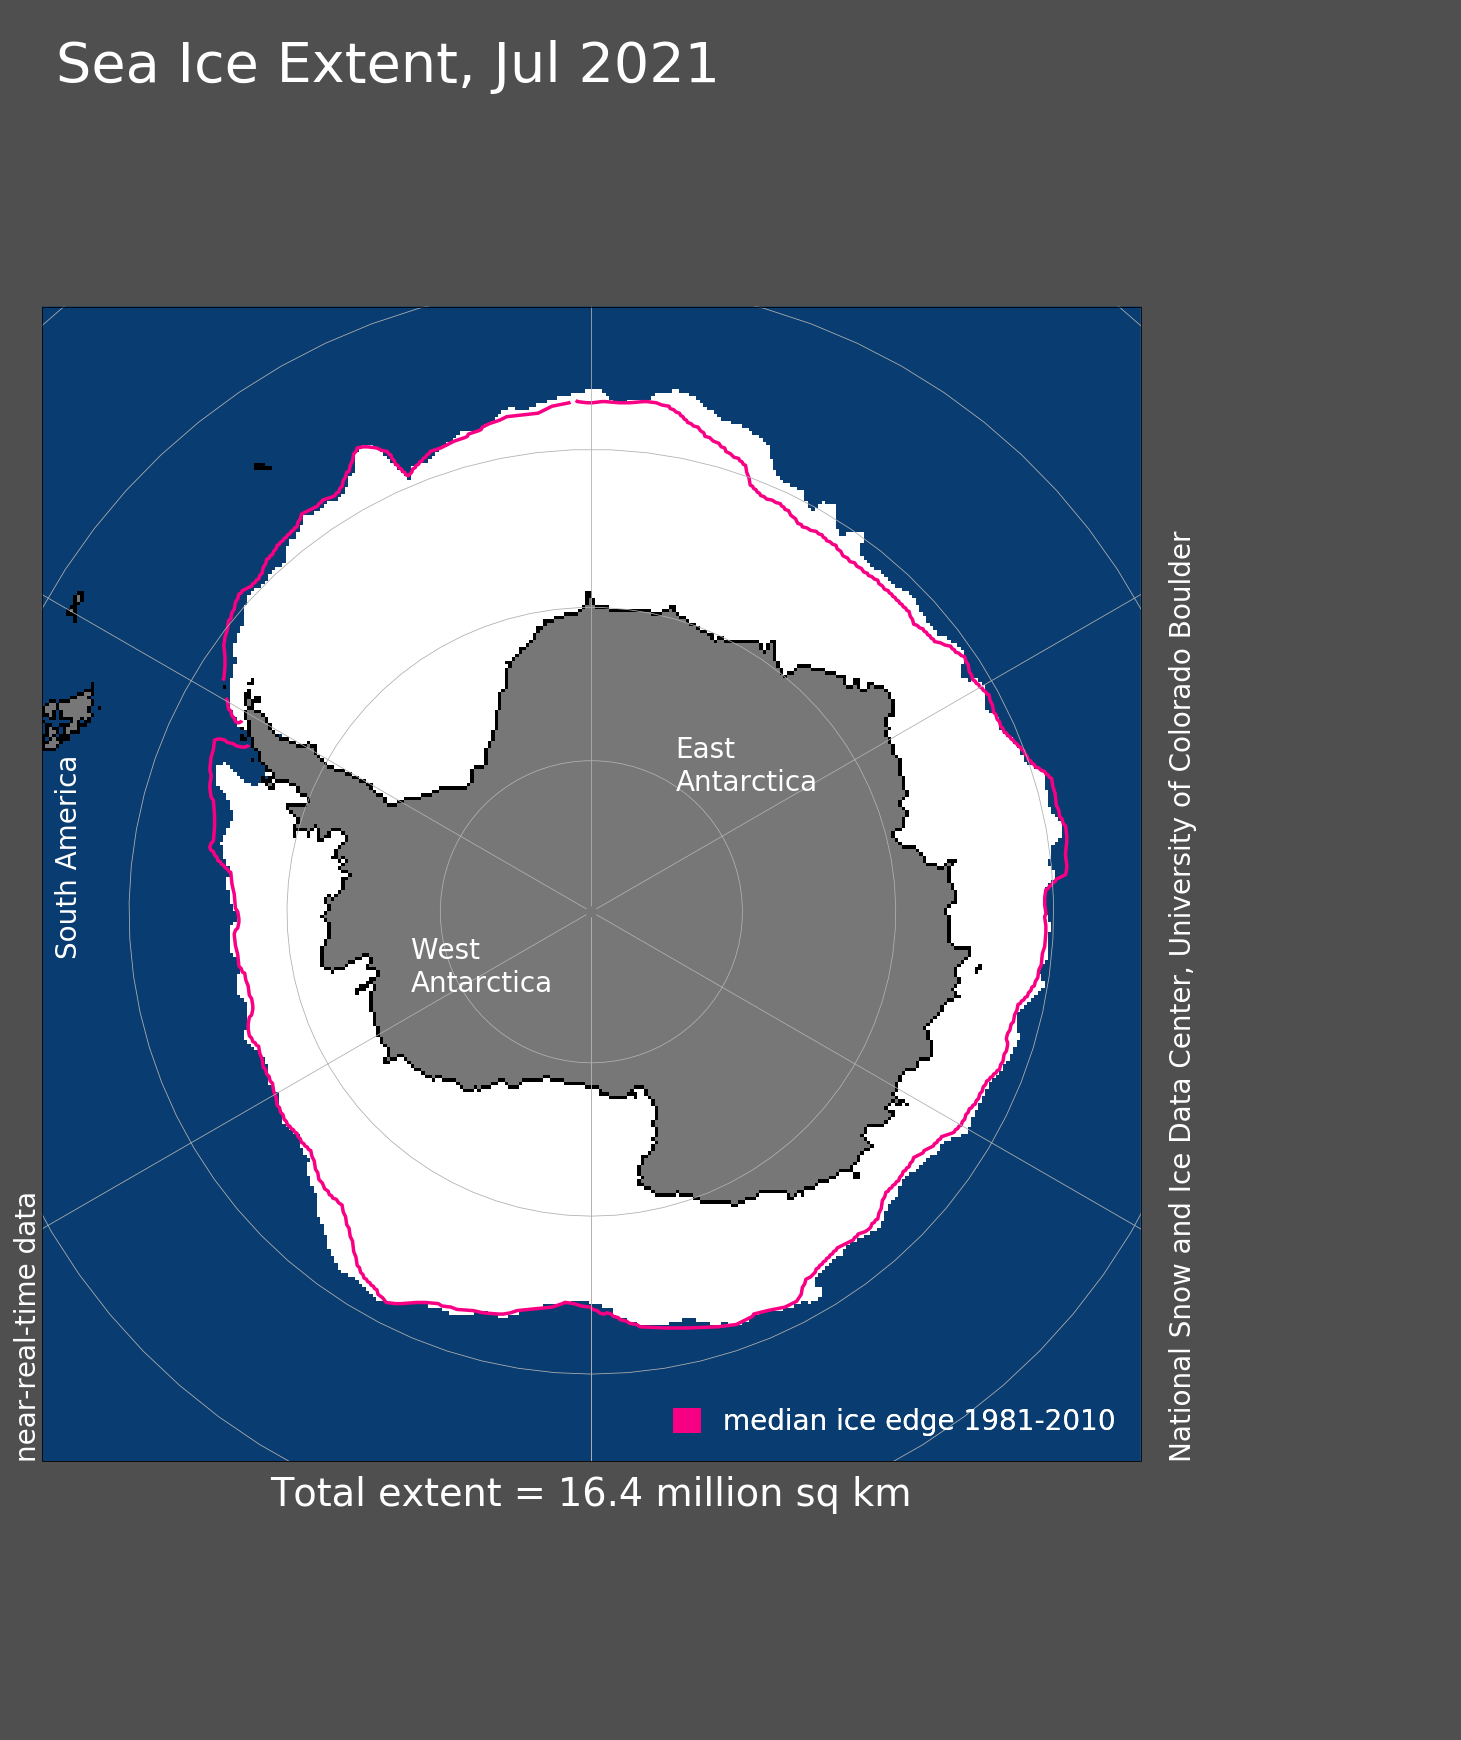
Figure 5. Antarctic sea ice extent for July 2021 was 16.38 million square kilometers (6.32 million square miles). The magenta line shows the 1981 to 2010 average extent for that month. Sea Ice Index data. About the data
Credit: National Snow and Ice Data Center
High-resolution image
In the Antarctic, sea ice extent increased faster than average during July, particularly in the latter half of the month. By the end of the month, extent was above the ninetieth percentile and was eighth highest in the satellite record. Extent was higher than average in the northeastern Ross Sea and in the Southern Ocean south of Africa, extending north from the coast of Dronning Maud Land and Enderby Land. Sea ice was below average in the area west of the Peninsula (the Bellingshausen Sea). Through 2021, the linear rate of increase for July sea ice extent is 0.6 percent per decade, but the uncertainty on this trend is ±0.7 percent. While this corresponds to 9,000 square kilometers (3,500 square miles) per year, the low level of certainty on the trend means that no clear pattern has yet emerged for Southern Ocean sea ice.
Further reading
Mudryk, L. R., J. Dawson, S. E. L. Howell, C. Derksen, T. A. Zagon, and M. Brady. 2021. Impact of 1, 2 and 4 °C of global warming on ship navigation in the Canadian Arctic. Nature Climate Change. doi:10.1038/s41558-021-01087-6.

