Holey ozone

The seasonal decline of Arctic sea ice extent proceeded at a near-average pace in May. Extent did not approach record lows but remained well below the 1981 to 2010 average. Sea ice extent was notably below average in the Barents and Chukchi Seas, but less so than in recent years. Western Russia and the central Arctic Ocean were unusually warm. Recent research demonstrates a strong link between the persistently positive Arctic Oscillation of last winter and early spring and the record stratospheric Arctic ozone hole. The Multidisciplinary drifting Observatory for the Study of Arctic Climate (MOSAiC) ice floe is breaking up and a new one will most likely have to be found to continue the scientific expedition.

Overview of conditions
Sea ice extent for May 2020

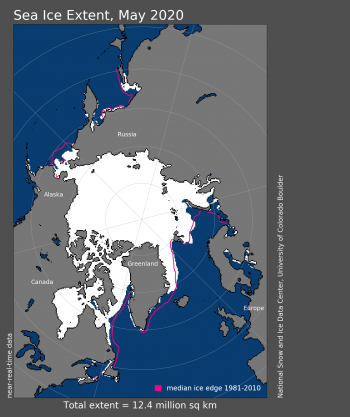
Figure 1. Arctic sea ice extent for May 2020 was 12.36 million square kilometers (4.77 million square miles). The magenta line shows the 1981 to 2010 average extent for that month. Sea Ice Index data. About the data

Credit: National Snow and Ice Data Center
High-resolution image

Sea ice extent averaged for May 2020 was 12.36 million square kilometers (4.77 million square miles), placing it in the fourth lowest extent in the satellite record for the month. This was 930,000 square kilometers (359,000 square miles) below the 1981 to 2010 May average and 440,000 square kilometers (170,000 square miles) above the record low mark for May set in 2016. Ice retreat was predominantly in the Bering, Chukchi, Barents and Kara Seas, whereas more modest retreats prevailed in Baffin Bay/Davis Strait, northern Hudson Bay, and the southeastern Greenland Sea. The North Water Polynya also opened up during May. As May came to a close, the ice extent was below average in the Barents and Chukchi Seas, but less so than in recent years. Areas of low extent also included southeastern Greenland, northern Hudson Bay, and northern Baffin Bay. Several coastal polynyas began opening along the Russian coast, a pattern which has been common in recent years. A somewhat larger-than-average opening north of Svalbard appeared in May.

Conditions in context
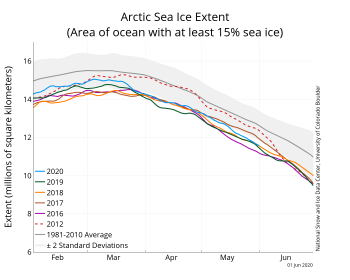
Arctic Sea Ice extent for 2020 and five other years

Figure 2a. The graph above shows Arctic sea ice extent as of June 1, 2020, along with daily ice extent data for four previous years and the record low year. 2020 is shown in blue, 2019 in green, 2018 in orange, 2017 in brown, 2016 in purple, and 2012 in dashed red. The 1981 to 2010 median is in dark gray. The gray areas around the median line show the interquartile and interdecile ranges of the data. Sea Ice Index data.

Credit: National Snow and Ice Data Center
High-resolution image
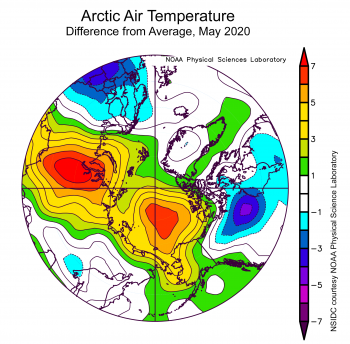
Figure 2X. This plot shows the departure from average air temperature in the Arctic at the 925 hPa level, in degrees Celsius, for XXXmonthXX 20XX. Yellows and reds indicate higher than average temperatures; blues and purples indicate lower than average temperatures.||Credit: NSIDC courtesy NOAA Earth System Research Laboratory Physical Sciences Division| High-resolution image

Figure 2b. This plot shows the departure from average air temperature in the Arctic at the 925 hPa level, in degrees Celsius, for May 2020. Yellows and reds indicate higher than average temperatures; blues and purples indicate lower than average temperatures.

Credit: NSIDC courtesy NOAA Earth System Research Laboratory Physical Sciences Division
High-resolution image

Through the month, sea ice declined by an average of 54,100 square kilometers (20,900 square miles) per day, slightly faster than the 1981 to 2010 average of 47,000 square kilometers (18,000 square miles) per day. The total sea ice loss during May 2020 was 1.68 million square kilometers (649,000 square miles).

Air temperatures at the 925 hPa level (about 2,500 feet above the surface) were above average over almost all of the Arctic Ocean, with departures as much as 7 degrees Celsius (13 degrees Fahrenheit) over the central Arctic Ocean (Figure 2b). Temperatures were also up 7 degrees Celsius (13 degrees Fahrenheit) over the western portion of Russia. Far northern Canada had temperatures on the order of 3 to 5 degrees Celsius (5 to 9 degrees Fahrenheit) below average.

Sea level pressures were especially low over Scandinavia, driving winds from south to north toward the Ob River estuary and Kara Sea region was unusually warm. Pressures were quite high over the Canadian Arctic Archipelago.

May 2020 compared to previous years
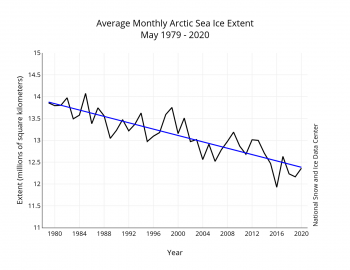
Average sea ice extent for May 1979 t0 2020

Figure 3. Monthly May ice extent for 1979 to 2020 shows a decline of 2.7 percent per decade.

Credit: National Snow and Ice Data Center
High-resolution image

Including 2020, the linear rate of decline for May sea ice extent is 2.7 percent per decade. This corresponds to a trend of 36,400 square kilometers (14,100 square miles) per year, or about the size of the state of Indiana. Over the 42-year satellite record, the Arctic has lost about 1.36 million square kilometers (525,000 square miles) of ice in May, based on the difference in linear trend values in 2019 and 1979. This is comparable to about twice the size of the state of Alaska.

Arctic ozone hole and Arctic Oscillation
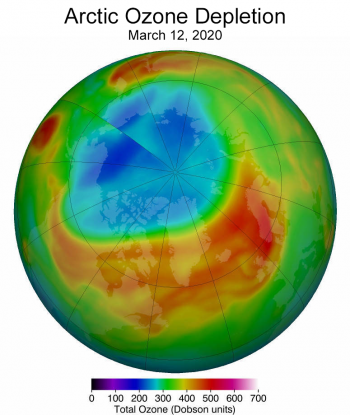
Arctic Ozone Hole

Figure 4. Arctic stratospheric ozone reached its record low level of 205 Dobson units, shown in blue and turquoise, on March 12, 2020.

Credit: NASA
High-resolution image

As noted in our previous post, the Arctic Oscillation (AO), a key pattern of atmospheric variability over the Arctic and northern Atlantic, was in a persistently positive (cyclonic) phase from mid-December through early spring. Such persistence, which ended only in early May, is highly unusual, and appears to be linked to a strong, cold stratospheric polar vortex and the largest Arctic stratospheric ozone hole observed to date (Figure 4). Scientists have learned there are two-way relationships—what happens in the stratosphere (high in the atmosphere) influences what happens in the lower atmosphere (the troposphere), and vice versa. A study by University of Colorado researcher Zac Lawrence and National Oceanic and Atmospheric Administration (NOAA) researchers Judith Perlwitz and Amy Butler, submitted recently to the Journal of Geophysical Research, took a close look at these connections. They find that the winter of 2019 to 2020 featured an exceptionally strong and cold stratospheric polar vortex. In general, atmospheric waves generated in the troposphere spread both outward and upward into the stratosphere where they can disturb and weaken the stratospheric polar vortex. But this wave activity was fairly weak this past winter, so the vortex remained largely undisturbed. The vortex was also configured in a way such that upward propagating waves were “reflected” back downwards, which further enabled the vortex to remain strong and cold. The end result is that the cyclonic (counterclockwise) circulation at the surface associated with the positive AO was tied closely to the cyclonic circulation of the strong, cold stratospheric vortex. The cold conditions in the stratosphere and its persistence into spring in turn provided favorable conditions to form polar stratospheric clouds, which foster ozone loss through well-understood chemical processes.

MOSAiC turns into a mosaic
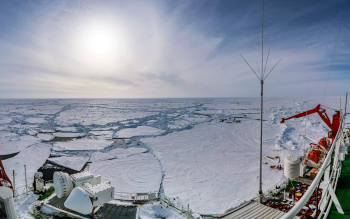
Ice breaks up surrounding the RV Polarstern ship

Figure 5a. Before the RV Polarstern left its ice floe location to exchange crew and scientists for the next leg of the MOSAiC (Multidisciplinary drifting Observatory for the Study of Arctic Climate) expedition, ice break ups around the ship intensified.

Credit: C. Rohleder
High-resolution image
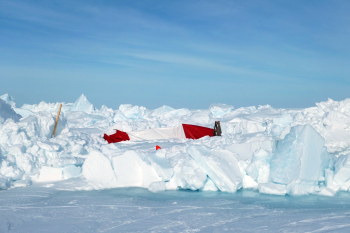
Tent collapsed under Arctic sea ice ridging

Figure 5b. A tent compresses under the pressure of Arctic sea ice ridging, showing increased instability in the region surrounding the RV Polarstern. Surface melt appears at the forefront of the image.

Credit: J. Schaffer
High-resolution image

Scientists on leg three of the Multidisciplinary drifting Observatory for the Study of Arctic Climate (MOSAiC) expedition left their ice floe, which was specifically selected for having survived one summer melt season, on May 16 to exchange crew and scientists and pick up cargo from transport vessels in Svalbard. Before the RV Polarstern ship actually departed, scientists hoped to leave behind several instruments that began monitoring ice, ocean, and atmospheric conditions back in October 2019 when the Central Observatory around the ship was initially established. Some of these instruments included autonomous light stations that measure the amount of light under the ice and changes in water color caused by phytoplankton growth. However, as the scientists were getting ready to leave, the ice floe began to break apart, rendering the MOSAiC floe into a true mosaic of ice blocks (Figure 5a and 5b). With such unstable conditions, all of the instrumentation used to provide calibration and validation data for overflights of satellites and aircraft were removed temporarily. It is not clear how many of the instruments left behind will survive, including the light stations. The warming and power hut from the remote sensing site, for instance, was left on the ice and was in a precarious situation as cracks in the ice opened nearby. In more recent days, images from cameras left behind indicate that the surface is melting which will likely make the floe more unstable. Given these conditions, it remains unclear whether or not the MOSAiC expedition will need to find a new floe to continue the experiment through September 2020.

Effects of cyclones on sea ice
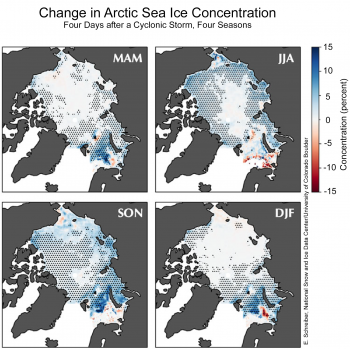
Change in Arctic Sea Ice Concentration Four Days after Cyclonic Storm, Four Seasons

Figure 6. These maps of the Arctic Ocean compare sea ice concentration changes four days after cyclonic storms were present to changes that occur when no storms are present. MAM stands for March-April-May; JJA stands for June-July-August; SON is September-October-November; and DJF is December-January-February. Blue tint indicates greater sea ice concentration after a cyclone; the dots indicate areas where the change is different than random variations in sea ice conditions.

Credit: E. Schreiber, University of Colorado Boulder
High-resolution image

A recently-published study by University of Colorado Boulder doctoral candidate Erika Schreiber considered the effects of the passage of Arctic low pressure systems (extratropical cyclones) on sea ice concentration. In earlier studies, a range of effects has been attributed to storms. Some point to increasing sea ice concentration locally, while others argue that winds associated with cyclones disperse the ice. Schreiber’s research shows that, overall, the thermodynamic effects (cold air, snow, and cloudiness) associated with storms increase sea ice concentration in impacted areas days after the storm hit (Figure 6). In warm months, cyclones slow down melt, while in cold months they tend to speed up freezing. The effects are greatest in summer and autumn, when the ice pack is already changing rapidly, but do still occur along the ice margin in spring and winter. The result has implications for short- and medium-term forecasting of sea ice conditions.

Further reading

Schreiber, E. A. P. and M. C. Serreze. 2020. Impacts of synoptic-scale cyclones on Arctic sea ice concentration: a systematic analysis. Annals of Glaciology, 1–15. doi:10.1017/aog.2020.23.
Storm Damage

The pace of sea ice decline in April was near average, while sea ice extent ranked fourth lowest in the satellite record. Sea ice age mapping shows a slight increase in the amount of older ice, but the Arctic is still dominated by first-year ice, unlike during the 1990s and earlier. An intense March storm, spanning much of the Arctic Ocean, created large ice rubble piles near Utqiaġvik, Alaska, and caused difficulties for Indigenous hunters along the northwestern Alaskan coast.

Overview of conditions

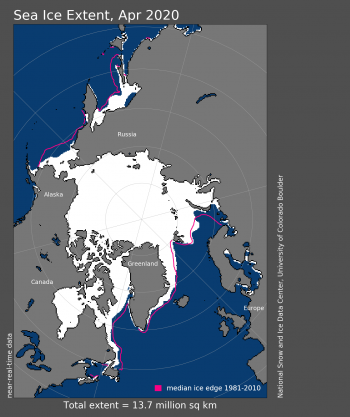
Figure 1. Arctic sea ice extent for XXXX 20XX was X.XX million square kilometers (X.XX million square miles). The magenta line shows the 1981 to 2010 average extent for that month. Sea Ice Index data. About the data||Credit: National Snow and Ice Data Center|High-resolution image

Figure 1. Arctic sea ice extent for April 2020 was 13.73 million square kilometers (5.30 million square miles). The magenta line shows the 1981 to 2010 average extent for that month. Sea Ice Index data. About the data

Credit: National Snow and Ice Data Center
High-resolution image

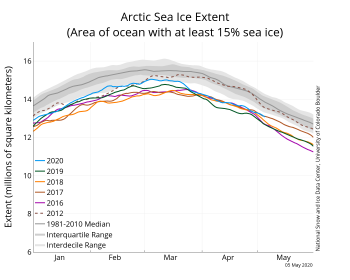
Arctic sea ice extent for April averaged 13.73 million square kilometers (5.30 million square miles). Last month, March ranked as the eleventh lowest ice extent in the satellite record, higher than it has been in the last five years. However, the pace of ice retreat increased toward the end of March and the ice extent in April retreated at rates similar to those seen in recent years. Consequently, ice extent for April 2020 ended up as fourth lowest—280,000 square kilometers (108,000 square miles) above the record low set in April 2019, and 960,000 square kilometers (371,000 square miles) below the 1981 to 2010 mean. As of April 30, the daily extent tracked at fourth lowest in the satellite data record.

April sea ice extent primarily retreated in the Sea of Okhotsk and the Bering Sea, but also within the Labrador Sea, Baffin Bay, the Davis Strait, and the southern end of the East Greenland Sea. However, the ice edge remained more extensive than average for this time of year in the Barents Sea between Svalbard and Novaya Zemlya, as well as in the northern East Greenland Sea. Ocean heat transport has been a good predictor of winter sea ice variability in this general region. Over the past five years, ocean temperatures have cooled in this area because of a smaller transport of warm Atlantic water from the North Atlantic. Thus, it is not surprising that the winter ice cover in this region has slowly returned from near-average to slightly above-average conditions.

Conditions in context

Figure 2a. The graph above shows Arctic sea ice extent as of April 30,2020, along with daily ice extent data for four previous years and the record low year. 2020 is shown in blue, 2019 in green, 2018 in orange, 2017 in brown, 2016 in purple, and 2012 in dashed red. The 1981 to 2010 median is in dark gray. The gray areas around the median line show the interquartile and interdecile ranges of the data. Sea Ice Index data.||Credit: National Snow and Ice Data Center|High-resolution image

Figure 2a. The graph above shows Arctic sea ice extent as of May 5,2020, along with daily ice extent data for four previous years and the record low year. 2020 is shown in blue, 2019 in green, 2018 in orange, 2017 in brown, 2016 in purple, and 2012 in dashed red. The 1981 to 2010 median is in dark gray. The gray areas around the median line show the interquartile and interdecile ranges of the data. Sea Ice Index data.

Credit: National Snow and Ice Data Center
High-resolution image

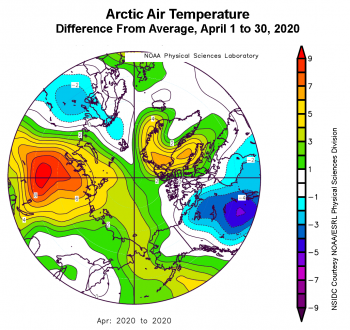
Figure 2b. This plot shows the departure from average air temperature in the Arctic at the 925 hPa level, in degrees Celsius, for April 1 to 30, 2020. Yellows and reds indicate higher than average temperatures; blues and purples indicate lower than average temperatures. ||Credit: NSIDC courtesy NOAA Earth System Research Laboratory Physical Sciences Division |High-resolution image

Figure 2b. This plot shows the departure from average air temperature in the Arctic at the 925 hPa level, in degrees Celsius, for April 1 to 30, 2020. Yellows and reds indicate higher than average temperatures; blues and purples indicate lower than average temperatures.

Credit: NSIDC courtesy NOAA Earth System Research Laboratory Physical Sciences Division
High-resolution image

The pace of ice loss in April was 33,400 square kilometers  (12,900 square miles) per day. This was dominated by ice loss primarily in the Bering Sea and the Sea of Okhotsk, which had rates of retreat of 3,700 and 16,100 square kilometers per day (1,400 and 6,200 square miles per day), respectively. Overall, Arctic sea ice extent decreased by 1.05 million square kilometers (405,000 square miles) in April.

April air temperatures at the 925 hPa level (approximately 2,500 feet above the surface) were 2 to 5 degrees Celsius (4 to 9 degrees Fahrenheit) above average over most of the Arctic Ocean and the Bering Sea, with the exception of Svalbard and the Barents Sea where air temperatures were near average (Figure 2b). Air temperatures were also up to 6 to 8 degrees Celsius (11 to 14 degrees Fahrenheit) above average in Baffin Bay, and up to 8 degrees Celsius (14 degrees Fahrenheit) above average over Siberia, while Canada continued to experience below-average air temperatures for this time of year. This pattern of air temperatures is a result of above-average sea level pressure over Alaska and Siberia, coupled with lower pressures over the central Arctic Ocean, helping to transport warm air from the south over the Bering Sea as well as into the Kara Sea. The wind pattern also caused offshore ice motion within the Kara Sea, pushing the ice edge in the Bering Sea further north.

While 925 hPa air temperatures were above average for much of the Arctic Ocean, conditions in Utqiaġvik, Alaska, turned colder at the end of the month. On April 29, temperatures in Utqiaġvik reached -28.9 Celsius (-20 Fahrenheit), a record low for the date, according to Rick Thoman of the International Arctic Research Center in Fairbanks. It was also the latest date in the season for a temperature of -28.9 degrees Celsius (-20 degrees Fahrenheit) or lower. See below for more on unusual weather and ice events over the past couple of months in the Utqiaġvik region of Alaska.

April 2020 compared to previous years

Figure 3. Monthly XXXXX ice extent for 1979 to 20XX shows a decline of X.X percent per decade.||Credit: National Snow and Ice Data Center| High-resolution image
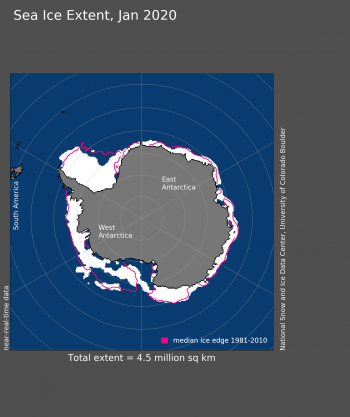
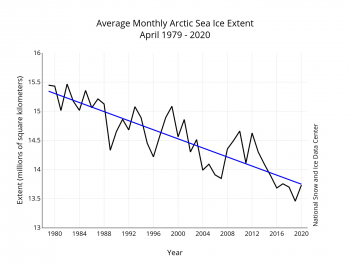
Figure 3. Monthly April ice extent for 1979 to 2020 shows a decline of 2.65 percent per decade.

Credit: National Snow and Ice Data Center
High-resolution image

Through 2020, the linear rate of decline for April extent is 2.65 percent per decade (Figure 3). This corresponds to a trend of 38,900 square kilometers (15,000 square miles) per year.

The MOSAiC expedition continues during the pandemic

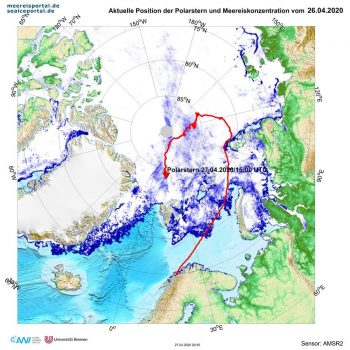
Figure 4. This figure shows the position of the Alfred Wegener Institute RV Polarstern while it is part of the MOSAiC Drift Experiment. |High-resolution image

Figure 4. This figure shows the position of RV Polarstern while it is part of the Multidisciplinary drifting Observatory for the Study of Arctic Climate (MOSAiC) expedition. This position is as of April 26, 2020.

Credit: Alfred Wegener Institute
High-resolution image

Planning a year-long Arctic Ocean expedition is logistically difficult. Challenges range from finding a suitable ice floe to support the various science activities, to dealing with break up events and having to move instruments to keep them from falling into the Arctic Ocean, to extreme weather conditions. There can also be unexpected visits by polar bears and foxes. Yet, no amount of planning could have prepared the expedition for the coronavirus disease 2019 (COVID-19) pandemic. While the leg-three participants of the Multidisciplinary drifting Observatory for the Study of Arctic Climate (MOSAiC) expedition should have been home by now, the rotation of personnel via aircraft had to be cancelled. Instead, the next exchange of personnel will be at the end of May, relying on two German research vessels, RV Sonne and RV Maria S. Merian, to meet RV Polarstern at the ice edge. The Polarstern will meet the vessels near Svalbard, and after refueling and transferring the freight and people, will head back into the ice to continue the measurement program. Some equipment may be left on the ice floe while the Polarstern is away, the intent being to continue recording data.

Colleagues at the Alfred Wegener Institute (AWI) determined the origin of the ice floe selected to host most of the MOSAiC instrumentation. Satellite observations and ice drift mapping indicates that the floe formed in a polynya north of the New Siberian Islands in early December 2018. At the time the MOSAiC Central Observatory (CO) was established, the ice thickness ranged from 30 to 80 centimeters (12 to 31 inches), which is relatively thin compared to historical ice conditions. Yet recent EM-Bird sea ice thickness sensor observations from helicopter on April 10 show that the CO and the surrounding ice now have a modal thickness of around 1.8 meters (5.9 feet). Leaving valuable scientific gear on the floe is risky given the possibility that the floe will break up or be crushed while the Polarstern is away. Indeed, new leads (roughly linear openings in the ice cover) formed on April 10, and on April 27, compressive forces on the ice led to ridging. Such events raise concern that instruments may be lost or damaged while the Polarstern is away. Furthermore, during the 2019 to 2020 winter, there was a strong transpolar drift of the ice, which may require a relocation of the camp further north so that the study site does not drift out of the Arctic Ocean before the end of September. This strong ice drift appears to be related to last winter’s strongly positive phase of the Arctic Oscillation.

Impacts of a major storm on Alaska Arctic sea ice

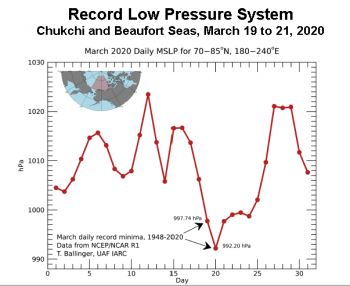
Figure 5a. This figure shows record low atmospheric mean sea-level pressure (MSLP; lowest for time period 1948 to 2020 on days indicated in graphic) north of Alaska in March 2020 during passage of major storm systems. ||Credit: Tom Ballinger, International Arctic Research Center, University of Alaska Fairbanks. |High-resolution image

Figure 5a. This figure shows record low atmospheric mean sea-level pressure (MSLP; lowest for time period 1948 to 2020 on days indicated in graphic) north of Alaska in March 2020 during passage of major storm systems. The figure shows the daily average over the Beaufort and Chukchi Seas (shaded region in inset), which was 992.2 hPa, rather than the minimum of the center of the low, which was 970 hPa. 

Credit: Tom Ballinger, International Arctic Research Center, University of Alaska Fairbanks.
High-resolution image

Figure 5b: This photo shows a pressure ridge formed in shorefast sea ice near Utqiaġvik, Alaska, as a result of storm-driven ice deformation. ||Credit: Billy Adams of Utqiaġvik, Alaska. |High-resolution image

Figure 5b: This photo shows a pressure ridge formed in shorefast sea ice near Utqiaġvik, Alaska, as a result of storm-driven ice deformation.

Credit: Billy Adams of Utqiaġvik, Alaska.
High-resolution image

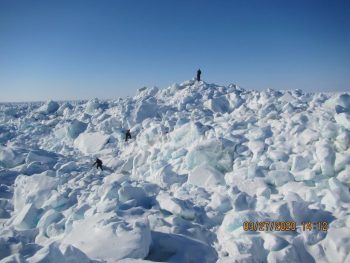
From March 19 to 21, a record low pressure system (Figure 5a) moved across the Chukchi and Beaufort Seas, with central pressure minimums reaching 970 hPa. Our colleague Hajo Eicken, Professor of Geophysics at the University of Alaska-Fairbanks, notes that the passage of this record low highlights the importance of major storm events in shaping the sea ice cover. A series of storms in March 2020, with peak wind speeds exceeding 97 kilometers per hour (60 miles per hour), piled up ice along the eastern Chukchi Sea coastline. Large ice pressure ridges (Figure 5b) can ground on the seafloor and help anchor the shorefast ice. They create a more stable ice platform for use by the local community to gain access to marine mammals that have been located further offshore. In recent years, milder ice conditions have resulted in less stable coastal ice. Ice deformation events due to major storms such as those that occurred this March can help make up for reduced ice growth from higher temperatures. Billy Adams, an Iñupiaq ice expert from Utqiaġvik, Alaska, reports that thicker and stronger first-year ice this winter resulted in grounding of pressure ridges further offshore than in prior recent years (Figure 5b). Community ice trails also have to extend further out from shore.

Whereas the storms piled up ice against the eastern Chukchi Sea shoreline, prevailing wind directions in the Beaufort Sea created open water and broke up large stretches of the ice pack into small floes. Break up and deformation of ice floes during passage of these storm systems threatened to disrupt a field experiment on an ice floe in the Beaufort Sea. The changing sea ice regime increasingly challenges on-ice operations and ice-based scientific research in this part of the Arctic. The absence of a strong Beaufort high pressure system in 2020 and previous years (Moore et al., 2018) has resulted in more sluggish ice movement in the Beaufort Sea. While this helps build up a thicker ice pack and makes it easier for scientific ice camps to operate in the region, it also allows for major storm systems to penetrate, wreaking havoc on the ice cover and bringing snowfall and blizzard conditions.

Update on sea ice age

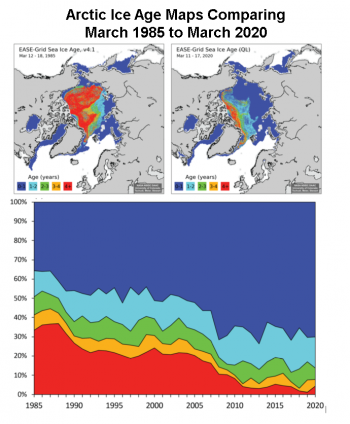
Figure 6. The top maps compare Arctic sea ice age for (a) March 12 to 18, 1985, and (b) March 11 to 17, 2020. The time series (c) of mid-March sea ice age as a percentage of Arctic Ocean coverage from 1985 to 2020 shows the nearly complete loss of 4+ year old ice; note the that age time series is for ice within the Arctic Ocean and does not include peripheral regions where only first-year (0- to 1-year-old) ice occurs, such as the Bering Sea, Baffin Bay, Hudson Bay, and the Sea of Okhotsk||Credit: W. Meier, NSIDC|High-resolution image

Figure 6. The top maps compare Arctic sea ice age for (a) March 12 to 18, 1985, and (b) March 11 to 17, 2020. The time series (c) of mid-March sea ice age as a percentage of Arctic Ocean coverage from 1985 to 2020 shows the nearly complete loss of 4+ year old ice; note the that age time series is for ice within the Arctic Ocean and does not include peripheral regions where only first-year (0- to 1-year-old) ice occurs, such as the Bering Sea, Baffin Bay, Hudson Bay, and the Sea of Okhotsk

Credit: W. Meier, NSIDC
High-resolution image

After the winter maximum extent, it is useful to check in on sea ice age. Older ice is generally thicker and thus less prone to melt completely during the following summer. As noted in previous years, the ice has been on average getting younger, with very little old (4+ year) ice remaining in the Arctic. During the 1980s, a substantial portion of the Arctic Ocean was covered by this old ice around the sea ice maximum (Figure 6). Last year, however, was a record low extent of 4+ year ice for this time. During the week of March 11 to 17, 326,000 square kilometers (126,000 square miles) or 4.3 percent of the ice within the Arctic Ocean was at least four years old. This is up from last year when only 91,000 square kilometers (35,000 square miles) or 1.2 percent of this old ice remained. Thus, there has been some replenishment of the oldest, thickest ice over the past year. However, the amount is still far below mid-1980 levels when over 2 million square kilometers (772,000 square miles) or around 35 percent of the Arctic Ocean was comprised of 4+-year-old ice.

The increase in the oldest ice has been offset by younger categories, one to four years old. The amount of first-year ice (0- to 1-year old) is close to the same level as last year’s, at about 70 percent of the Arctic Ocean ice cover, much higher than during the mid-1980s, when only 35 to 40 percent of the ice was less than a year old. A study of the updated ice age (and ice motion) product is being published in The Cryosphere (Tschudi et al., 2020).

Fast drifting trace elements

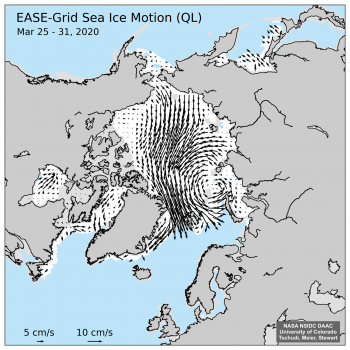
Figure 7. This figure shows ice motion from March 25 to March 31, 2020, revealing a strong Transpolar Drift and ice export towards Svalbard and out of Fram Strait.||Credit: NSIDC| |High-resolution image

Figure 7. This figure shows ice motion from March 25 to March 31, 2020, revealing a strong Transpolar Drift and ice export towards Svalbard and out of Fram Strait.

Credit: National Snow and Ice Data Center
High-resolution image

The Transpolar Drift Stream, a general motion of ice from shores of Siberia, across the Pole and then towards Fram Strait, was enhanced during the extreme positive phase of the Arctic Oscillation this winter. A new study found that freshwater runoff from rivers around the western Arctic Ocean (Siberia, Alaska, and northwestern Canada) brings significant amounts of trace elements into the Arctic Ocean through the Transpolar Drift Stream. Trace elements entering the Arctic Ocean from rivers are chemically bound with organic matter in the rivers, which allows them to be transported long distances. The Transport Drift Stream can then take those trace elements across the Arctic Ocean and towards Fram Strait. This may have important implications for marine ecosystems. One key element, iron, is a key nutrient for primary productivity (e.g., algae growth). More iron transported into the Arctic Ocean and more sunlight from reduced sea ice extent can enhance productivity. As permafrost thaws and more nutrients are released, this could become an important component of change in marine ecosystems in the future.

Antarctica sea ice near average

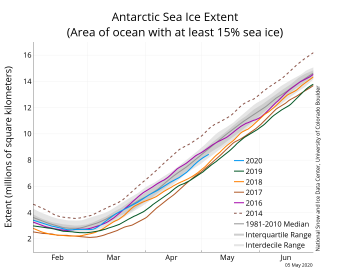
Figure 2a. The graph above shows Antarctic sea ice extent as of May 5, 2020, along with daily ice extent data for four previous years and the record high year. 2020 is shown in blue, 2019 in green, 2018 in orange, 2017 in brown, 2016 in purple, and 2014 in dashed brown. The 1981 to 2010 median is in dark gray. The gray areas around the median line show the interquartile and interdecile ranges of the data. Sea Ice Index data.||Credit: National Snow and Ice Data Center|High-resolution image

Figure 8a. The graph above shows Antarctic sea ice extent as of May 5, 2020, along with daily ice extent data for four previous years and the record high year. 2020 is shown in blue, 2019 in green, 2018 in orange, 2017 in brown, 2016 in purple, and 2014 in dashed brown. The 1981 to 2010 median is in dark gray. The gray areas around the median line show the interquartile and interdecile ranges of the data. Sea Ice Index data.

Credit: National Snow and Ice Data Center
High-resolution image

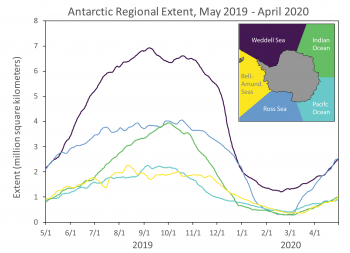
Figure 8b. This figure shows Antarctic regional extent over the last 12 monthsAntarctic regional extent over the last 12 months—May 1, 2019, through April 30, 2020. Regions are noted in the map inset (“Bell.-Amund. Seas” refers to the Bellingshausen and Amundsen Seas). ||Credit: National Snow and Ice Data Center|High-resolution image

Figure 8b. This figure shows Antarctic regional extent over the last 12 months. Antarctic regional extent over the last 12 months—May 1, 2019, through April 30, 2020. Regions are noted in the map inset (“Bell.-Amund. Seas” refers to the Bellingshausen and Amundsen Seas).

Credit: National Snow and Ice Data Center
High-resolution image

Antarctic sea ice extent tracked close to the median line from mid-March until the first week of April when the rate of growth fell below the median rate and the trend returned to the lower end of the observed 41-year range. However, it remained within the interdecile range. Sea ice extent is near average in most sectors, but is slightly below average in the Ross Sea, parts of the Weddell Sea, and off the coast of Dronning Maud Land.

NSIDC has recently published regional ice extent and concentration spreadsheets for five sectors of the Southern Ocean surrounding Antarctica. These allow users to quickly examine how sea ice is varying in different regions. This is similar to the regional spreadsheets previously available for the Arctic.

The regional spreadsheets are illustrative of how the seasonal cycle varies in different parts of the Antarctic. For example, as shown for the past year, the seasonal variation is dominated by the changes in the Weddell Sea, going from a maximum of around 7 million square kilometers (2.70 million square miles) in late August to just over 1 million square kilometers (386,000 square miles), with a very sharp decline during December 2019. Significant seasonal ice retreat starts first in the Indian Ocean region in late September, with a very short transition between advance and retreat. Other regions show less seasonal variability. Notably, the dates of the maximums of the regions varies over a couple months, but all reach a minimum at nearly the same time—end of February to early March.

Future reading

Årthun, M., T. Eldevik, and L. H. Smedsrud. 2019. The Role of Atlantic Heat Transport in Future Arctic Winter Sea Ice Loss. Journal of Climate. doi:10.1175/JCLI-D-18-0750.1.

Charette, M. A., L. E. Kipp, L. T. Jensen, J. S. Dabrowski, L. M. Whitmore, J. N. Fitzsimmons, et al. 2020. The Transpolar Drift as a Source of Riverine and Shelf‐Derived Trace Elements to the Central Arctic Ocean. Journal of Geophysical Research: Oceansdoi:10.1029/2019JC015920

Krumpen, T., et al. 2020. The MOSAiC ice floe: sediment-laden survivor from the Siberian shelf. The Cryosphere. doi:10.5194/tc-2020-64.

Moore, G. W. K., A. Schweiger, J. Zhang, and M. Steele. 2018. Collapse of the 2017 winter Beaufort High: A response to thinning sea ice? Geophysical Research Letters. doi:10.1002/2017GL076446

Tschudi, M. A., W. N. Meier, and J. S. Stewart. 2020. An enhancement to sea ice motion and age products at the National Snow and Ice Data Center. The Cryospheredoi.10.5194/tc-14-1519-2020.


Polar sunrise

After reaching its annual maximum on March 5, Arctic sea ice extent remained stable for several days before it started clearly declining. Continuing the pattern of this past winter, the Arctic Oscillation was in a persistently positive phase. Scientists participating in the Multidisciplinary drifting Observatory for the Study of Arctic Climate (MOSAiC) expedition finally reached shore after being held at sea for three weeks from a combination of logistical challenges and COVID-19 concerns.

Overview of conditions

Figure 1. Arctic sea ice extent for XXXX 20XX was X.XX million square kilometers (X.XX million square miles). The magenta line shows the 1981 to 2010 average extent for that month. Sea Ice Index data. About the data||Credit: National Snow and Ice Data Center|High-resolution image

Figure 1. Arctic sea ice extent for March 2020 was 14.78 million square kilometers (5.71 million square miles). The magenta line shows the 1981 to 2010 average extent for that month. Sea Ice Index data. About the data

Credit: National Snow and Ice Data Center
High-resolution image

The March 2020 Arctic sea ice extent was 14.78 million square kilometers (5.71 million square miles). This was the eleventh lowest in the satellite record, 650,000 square kilometers (251,000 square miles) below the 1981 to 2020 March average and 490,000 square kilometers (189,000 square miles) above the record low March extent in 2017.

At the end of the month, extent was particularly low in the Bering Sea after a rapid retreat during the second half of the month. Ice loss was also prominent in the Sea of Okhotsk and Gulf of St. Lawrence.

Conditions in context

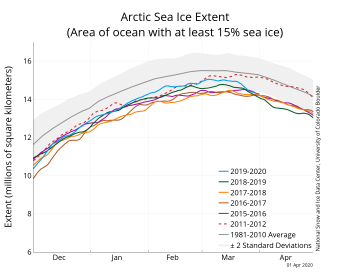
Figure 2. Figure 2. The graph above shows Arctic sea ice extent as of XXXX X, 20XX, along with daily ice extent data for four previous years and the record low year. 2018 to 2019 is shown in blue, 2017 to 2018 in green, 2016 to 2017 in orange, 2015 to 2016 in brown, 2014 to 2015 in purple, and 2011 to 2012 in dotted brown. The 1981 to 2010 median is in dark gray. The gray areas around the median line show the interquartile and interdecile ranges of the data. Sea Ice Index data.||Credit: National Snow and Ice Data Center|High-resolution image

Figure 2a. The graph above shows Arctic sea ice extent as of April 1, 2020, along with daily ice extent data for four previous years and the record low year. 2019 to 2020 is shown in blue, 2018 to 2017 in green, 2017 to 2016 in orange, 2016 to 2017 in brown, 2015 to 2016 in purple, and 2011 to 2012 in dashed red. The 1981 to 2010 median is in dark gray. The gray areas around the median line show the interquartile and interdecile ranges of the data. Sea Ice Index data.

Credit: National Snow and Ice Data Center
High-resolution image

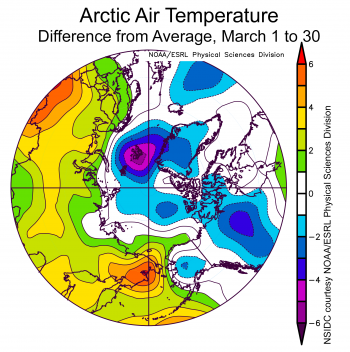
Figure 2b. This plot shows the departure from average air temperature in the Arctic at the 925 hPa level, in degrees Celsius, for March 1 to 30, 2020. Yellows and reds indicate higher than average temperatures; blues and purples indicate lower than average temperatures.||Credit: NSIDC courtesy NOAA Earth System Research Laboratory Physical Sciences Division| High-resolution image

Figure 2b. This plot shows the departure from average air temperature in the Arctic at the 925 hPa level, in degrees Celsius, for March 1 to 30, 2020. Yellows and reds indicate higher than average temperatures; blues and purples indicate lower than average temperatures.

Credit: NSIDC courtesy NOAA Earth System Research Laboratory Physical Sciences Division
High-resolution image

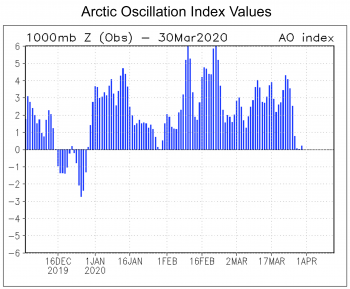
The plot shows the values of the Arctic Oscillation Index, which is a weather phenomenon indicating the state of the atmospheric circulation over the Arctic. ||Credit: NCEP/NOAA | High-resolution image

Figure 2c. The plot shows the values of the Arctic Oscillation Index, which is a weather phenomenon indicating the state of the atmospheric circulation over the Arctic.

Credit: National Centers for Environmental Prediction/National Oceanic and Atmospheric Administration
High-resolution image

After reaching its maximum on March 5, extent declined slowly until March 19 after which it declined rapidly for the next ten days. The decrease was most pronounced in the Bering Sea, where extent went from slightly above average at the time of the maximum to well below average by the end of the month. Overall, sea ice extent decreased 750,000 square kilometers (290,000 square miles) between March 5 and March 31, with 590,000 square kilometers (228,000 square miles) of this decrease occurring between March 19 and March 29.

Air temperatures in March at the 925 hPa level (approximately 2,500 feet above the surface) over the Arctic Ocean were near average to slightly below average (Figure 2b). Temperatures over the central Arctic Ocean were 2 to 3 degrees Celsius (4 to 5 degrees Fahrenheit) below average, but as much as 6 degrees Celsius (11 degrees Fahrenheit) below average in the region around Svalbard. Only in the Sea of Okhotsk and the Bering Sea were temperatures above average (2 to 5 degrees Celsius or 4 to 9 degrees Fahrenheit). Sea level pressure was very low over the Arctic Ocean, reflecting the strong positive mode of the Arctic Oscillation (AO) that has persisted through most of the past winter (Figure 2c). The AO index became more neutral by the end of March but has been positive through all of 2020 so far.

March 2020 compared to previous years

Figure 3. Monthly XXXXX ice extent for 1979 to 201X shows a decline of X.X percent per decade.||Credit: National Snow and Ice Data Center| High-resolution image

Figure 3. Monthly March ice extent for 1979 to 2020 shows a decline of 2.6 percent per decade.

Credit: National Snow and Ice Data Center
High-resolution image

Through 2020, the linear rate of decline for March extent is 2.6 percent per decade. This corresponds to a trend of 40,500 square kilometers (15,600 square miles) per year, which is roughly the size of Massachusetts and Connecticut combined. Over the 42-year satellite record, the Arctic has lost about 1.66 million square kilometers (641,000 square miles) of sea ice in March, based on the difference in linear trend values in 2020 and 1979. This is comparable in size to the size of the state of Alaska.

Thickness data from CryoSat-2

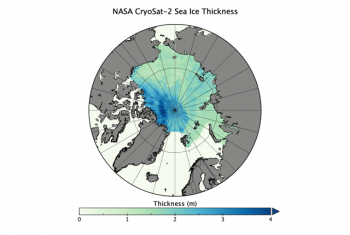
Figure 4b. This maps shows sea ice thickness for February 22, 2020. Light green depicts ice under a meter thin; dark blue depicts ice up to 4 meters thick. NASA Goddard (Kurtz and Harbeck, 2017) produces the thickness product and the NASA NSIDC Distributed Active Archive Center distributes it.||Credit: W. Meier, NSIDC | High-resolution image

Figure 4a. This maps shows sea ice thickness for February 22, 2020. Light green depicts ice under a meter thin; dark blue depicts ice up to 4 meters thick. NASA Goddard (Kurtz and Harbeck, 2017) produces the thickness product and the NASA NSIDC Distributed Active Archive Center distributes it.

Credit: W. Meier, NSIDC
High-resolution image

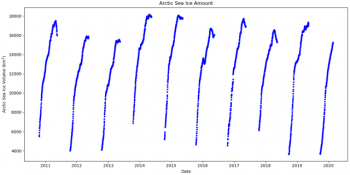
Figure 4a. This graph shows sea ice volume from European Space Agency (ESA) CryoSat-2 thickness for February 22, 2020. Ice volume is tracked between mid-October and mid-May. Ice volume is estimated from the NASA CryoSat-2 Sea Ice Elevation, Freeboard, and Thickness, Version 1 product (Kurtz and Harbeck, 2017). ||Credit: B. Raup, NSIDC | High-resolution image

Figure 4b. This graph shows sea ice volume from European Space Agency (ESA) CryoSat-2 satellite from October 20, 2010 through February 22, 2020. Ice volume is tracked between mid-October and mid-May. Ice volume is estimated from the NASA CryoSat-2 Sea Ice Elevation, Freeboard, and Thickness, Version 1 product (Kurtz and Harbeck, 2017).

Credit: B. Raup, NSIDC
High-resolution image

NASA Goddard produces sea ice thickness estimates based on data from the European Space Agency CryoSat-2 radar altimeter. The altimeter sends out radar pulses that reflect from the surface back to the satellite. By measuring the time it takes for the pulses to transmit to the surface and reflect back to the satellite, the elevation of the surface can be estimated. For sea ice, this corresponds to the freeboard—the part of the ice above the waterline. Using information about snow depth, and snow and sea ice density, total thickness can be estimated.

Maps of ice thickness are produced daily with about a 40-day lag, necessary to carefully process the data (Figure 4a). CryoSat-2 has been operating since 2010, providing nearly a decade long record of sea ice thickness and sea ice volume. Ice volume roughly triples from mid-October to mid-May due to the increase in extent and thickness through the winter (Figure 4b). However, the radar altimeter cannot obtain reliable estimates over sea during summer as surface melt contaminates the radar signal.

The future of pollutant transport via sea ice drift

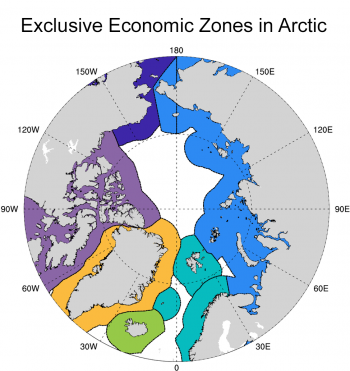
Figure 5. . Map of exclusive economic zones (EEZs) within the Arctic: Canada (purple), Greenland (orange), Iceland (green), Norway (turquoise), Russia (light blue), and USA (dark blue). As sea ice reduces there will be less opportunity for ice to drift from one EEZ to another, which has implications for the potential spread of pollutants. Image from DeRepentigny et al. (2020) courtesy American Geophysical Union (CC BY-NC-ND 4.0).

Figure 5. This map show the exclusive economic zones (EEZs) within the Arctic: Canada (purple), Greenland (orange), Iceland (green), Norway (turquoise), Russia (light blue), and USA (dark blue). As sea ice reduces there will be more opportunity for ice to drift from one EEZ to another, which has implications for the potential spread of pollutants.

Credit: DeRepentigny et al., 2020
High-resolution image

As the Arctic sea ice cover becomes less extensive, thinner, and more mobile, ice floes are able to travel longer distances in a shorter amount of time. Patricia DeRepentigny, a PhD candidate at the University of Colorado, led a study that uses the National Center for Atmospheric Research (NCAR) Community Earth System Model (CESM) to assess how the transport of sea ice across the Arctic Ocean will likely change throughout the twenty-first century. She performed CESM experiments with two different greenhouse gas emissions scenarios to assess the impact of societal choices. The area of sea ice exchanged between the different countries bordering the Arctic more than triples between the end of the twentieth century and the middle of the twenty-first century, with the Central Arctic Ocean joining the Russian coast as a major ice exporter. At the same time, the sea ice that drifts over long distances is predicted to diminish in favor of shorter drifts between neighboring Arctic countries. By the end of the twenty-first century, there are large differences between the two CESM experiments: in the high-emissions scenario, the proportion of sea ice leaving each region starts to reduce, whereas it continues to increase in the low-emissions scenario. This is because the Arctic Ocean goes completely ice free every summer under the high-emissions scenario, allowing ice floes less than a year to travel. The study raises concerns regarding risks associated with contaminants transported on distributed ice floes, especially in light of increased shipping and offshore development in the Arctic.

The return: MOSAiC update

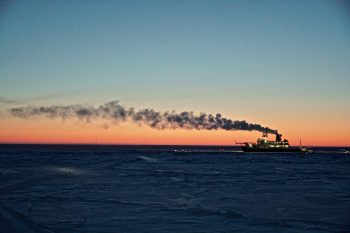
Figure 6a. The German icebreaker Polarstern drifts with the sea ice, where it has been lodged since September 2019 as part of the MOSAiC project. As the project heads into spring, a perpetual sunrise eclipses the horizon. ||Credit: J. Stroeve, NSIDC | High-resolution image

Figure 6a. The German icebreaker Polarstern drifts with the sea ice, where it has been lodged since September 2019 as part of the Multidisciplinary drifting Observatory for the Study of Arctic Climate (MOSAiC) project. As the project heads into spring, a perpetual sunrise eclipses the horizon.

Credit: J. Stroeve, NSIDC
High-resolution image

Figure 6b. The radiometer instrument is strapped to its tow-sled to measure snow depth. || Credit: J. Stroeve, NSIDC | High-resolution image

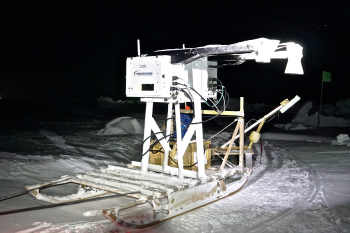
Figure 6b. The Ka/Ku radar is strapped to a tow-sled, looking straight down to simulate what a satellite altimeter would see when towed along the transects. This instrument was built by ProSensing specifically for the Multidisciplinary drifting Observatory for the Study of Arctic Climate (MOSAiC) expedition.

Credit: J. Stroeve, NSIDC
High-resolution image

After delays related to logistical challenges and the COVID-19 pandemic, the science crew of the second leg of the Multidisciplinary drifting Observatory for the Study of Arctic Climate (MOSAiC), including NSIDC scientist Julienne Stroeve, is finally back on shore. Stroeve and colleagues embarked on a supporting icebreaker on November 27, reaching the German Polarstern icebreaker—the basecamp for MOSAiC—on December 13. On leg two, Stroeve’s research focused on remote sensing of sea ice using various instruments, including a dual frequency Ka/Ku band polarimetric radar. This instrument was deployed at the remote sensing site, which consisted of a refrozen melt pond, and hourly measurements were collected. At the beginning of the instrument set up in October, the ice floe was about 80 centimeters (2.6 feet) thick but grew to nearly 2 meters (6.6 feet) thick by the end of February. The instrument was also towed along several kilometer-long transects using a sled that fixed the instrument position in a nadir (“stare”) mode to simulate returns seen by a radar altimeter (Figure 6b). The radar backscatter data will be useful to better understand how snowpack properties influence radar penetration and if a satellite radar altimeter mission using Ka- and Ku-bands can allow scientists to simultaneously map snow depth and ice thickness.

An update from the south

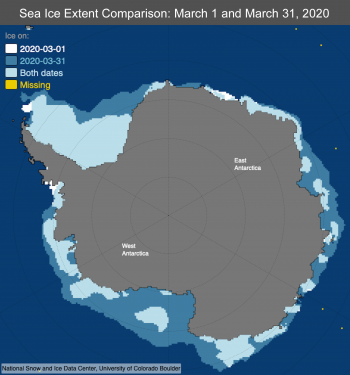
Figure 7: This map compares sea ice extent in Antarctica on March 1 and March 31, 2020. ||Credit: National Snow and Ice Data Center | High-resolution image

Figure 7. This map compares sea ice extent in Antarctica on March 1 and March 31, 2020.

Credit: National Snow and Ice Data Center
High-resolution image

In the Antarctic, sea ice extent has increased sharply since early March and at the end of the month is near the 1981 to 2010 average. This ends a 41-month period of below-average monthly sea ice extent. Ice growth has occurred all along the Antarctic coast, but most notably in the Ross Sea and eastern Weddell Sea regions. Air temperatures over most coastal areas for the month were near average within 1 degree Celsius (2 degrees Fahrenheit) of the 1981 to 2010 average, slightly above average near the southern Peninsula area at 1 to 3 degrees Celsius (2 to 5 degrees Fahrenheit), and notably below average in the Wilkes Land area of the ice sheet at 5 to 7 degrees Celsius (9 to 13 degrees Fahrenheit). The atmospheric circulation patterns were somewhat unusual, dominated by extensive low pressure in the Amundsen Sea and Ross Sea region, and another area of low pressure north of Dronning Maud Land. Offshore winds guided by these low-pressure areas correlate with the two areas of more rapid ice growth. Consistent with the strong low pressure in the Ross and Amundsen Seas, the Southern Annular Mode index was positive for the month.

References

DeRepentigny, P., A. Jahn, L. B. Tremblay, R. Newton, and S. Pfirman. 2020. Increased transnational sea ice transport between neighboring Arctic states in the 21st century. Earth’s Future, 8, e2019EF001284, doi.org:10.1029/2019EF001284.

Kurtz, N. and J. Harbeck. 2017. CryoSat-2 Level-4 Sea Ice Elevation, Freeboard, and Thickness, Version 1. Boulder, Colorado USA. NASA National Snow and Ice Data Center Distributed Active Archive Center. doi:10.5067/96JO0KIFDAS8.

No record-breaker maximum

Arctic sea ice appears to have reached its annual maximum extent on March 5. The 2020 maximum sea ice extent is the eleventh lowest in the 42-year satellite record, but the highest since 2013. The Antarctic minimum sea ice extent, which was noted in the previous post, was indeed reached on February 22. NSIDC will present a detailed analysis of the 2019 to 2020 winter sea ice conditions in our regular monthly post in early April.

Overview of conditions

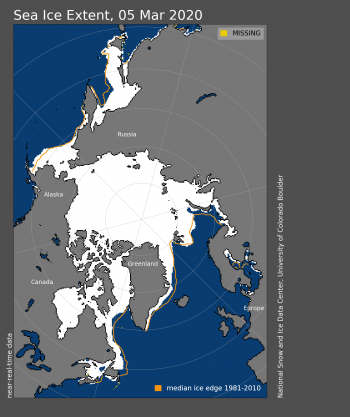
Figure 1. Arctic sea ice extent for XXXX XX, 20XX was X.XX million square kilometers (X.XX million square miles). The orange line shows the 1981 to 2010 average extent for that day. Sea Ice Index data. About the data||Credit: National Snow and Ice Data Center|High-resolution image

Figure 1. Arctic sea ice extent for March 5, 2020 was 15.05 million square kilometers (5.81 million square miles). The orange line shows the 1981 to 2010 average extent for that day. Sea Ice Index data. About the data

Credit: National Snow and Ice Data Center
High-resolution image

On March 5, 2020, Arctic sea ice likely reached its maximum extent for the year, at 15.05 million square kilometers (5.81 million square miles), the eleventh lowest in the 42-year satellite record. This year’s maximum extent is 590,000 square kilometers (228,000 square miles) below the 1981 to 2010 average maximum of 15.64 million square kilometers (6.04 million square miles) and 640,000 square kilometers (247,000 square miles) above the lowest maximum of 14.41 million square kilometers (5.56 million square miles) set on March 7, 2017. Prior to 2020, the four lowest maximum extents occurred from 2015 to 2018.

The date of the maximum this year, March 5, was seven days before the 1981 to 2010 median date of March 12.

Table 1. Ten lowest maximum Arctic sea ice extents (satellite record, 1979 to present)

Rank Year In millions of square kilometers In millions of square miles Date
1 2017 14.41 5.56 March 7
2 2018 14.47 5.59 March 17
3 2016
2015
14.51
14.52
5.60
5.61
March 23
February 25
5 2011
2006
14.67
14.68
5.66
5.67
March 9
March 12
7 2007
2019
14.77
14.78
5.70
5.71
March 12
March 13
9 2005
2014
14.95
14.96
5.77
5.78
March 12
March 21

For the Arctic maximum, which typically occurs in March, the uncertainty range is ~34,000 square kilometers (13,000 square miles), meaning that extents within this range must be considered effectively equal.

Maximum extent is not predictive of minimum extent

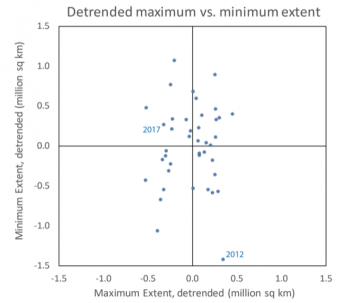
Figure 2. This plot compares de-trended maximum extent (x-axis) with minimum extent (y-axis). The yearly values shown are calculated by subtracting the linear trend value for that year from the total extent.

Credit: W. Meier, NSIDC
High-resolution image

Often there is a debate as to whether the maximum extent in March is predictive of the minimum extent in September. Both have statistically significant downward trends, so it is expected that both will tend to have low extents relative to the long-term averages. However, the specific maximum extent in any given year does not correlate to the minimum extent. When the trend is removed from both time series or de-trended, there is essentially no relation between the two, showing the year-to-year variability in extent. Plotting the de-trended maximum versus minimum extent (Figure 2) shows a near-random distribution. In other words, a relatively high maximum is not necessarily followed by a relatively high minimum. One example is 2012, where the maximum extent ranked only eighth lowest in 2012, and now sixteenth lowest in 2020, but the minimum was a record low for the satellite record. Similarly, 2017 has the lowest maximum in the satellite record, but the minimum ranked only seventh lowest at the time, and now is at the tenth lowest maximum extent. The reason why the seasonal maximum extent and the September minimum extent are not correlated is largely because summer weather conditions strongly shape the September minimum.

Final analysis pending

Please note this is a preliminary announcement of the sea ice maximum. At the beginning of April, NSIDC scientists will release a full analysis of winter conditions in the Arctic, along with monthly data for March.

A positively persistent, persistently positive Arctic Oscillation

Sea ice extent for February 2020 tracked below average, ranking as the thirteenth lowest monthly average in the satellite record. A brief pause in ice growth in the middle of February was related to the regional wind pattern. As has been the case for the past several months, the Arctic Oscillation was in a persistently positive phase. This manifested as unusually low sea level pressure over the Atlantic side of the Arctic Ocean and high pressure over Eastern Eurasia, extending eastward into Arctic Canada.

Overview of conditions

Figure 1. Arctic sea ice extent for XXXX 20XX was X.XX million square kilometers (X.XX million square miles). The magenta line shows the 1981 to 2010 average extent for that month. Sea Ice Index data. About the data||Credit: National Snow and Ice Data Center|High-resolution image

Figure 1. Arctic sea ice extent for February 2020 was 14.68 million square kilometers (5.67 million square miles). The magenta line shows the 1981 to 2010 average extent for that month. Sea Ice Index data. About the data

Credit: National Snow and Ice Data Center
High-resolution image

Arctic sea ice extent for February 2020 was 14.68 million square kilometers (5.67 million square miles), the thirteenth lowest in the satellite record. This was 620,000 square kilometers (239,000 square miles) below the 1981 to 2010 February average and 710,000 square kilometers (274,000 square miles) above the record low mark for February set in 2018. At the end of February, ice extent was below average over parts of the Barents and Kara Seas, and the eastern Greenland Sea.

Conditions in context

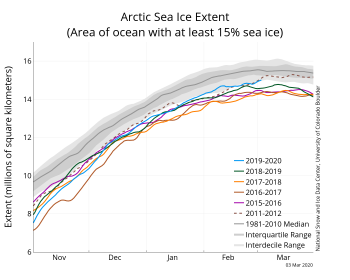
Figure 2a. The graph above shows Arctic sea ice extent as of March 2, 2020, along with daily ice extent data for four previous years and the record low year. 2019 to 2020 is shown in blue, 2018 to 2019 in green, 2017 to 2018 in orange, 2016 to 2017 in brown, 2015 to 2016 in purple, and 2011 to 2012 in dotted brown. The 1981 to 2010 median is in dark gray. The gray areas around the median line show the interquartile and interdecile ranges of the data. Sea Ice Index data.||Credit: National Snow and Ice Data Center|High-resolution image

Figure 2a. The graph above shows Arctic sea ice extent as of March 3, 2020, along with daily ice extent data for four previous years and the record low year. 2019 to 2020 is shown in blue, 2018 to 2019 in green, 2017 to 2018 in orange, 2016 to 2017 in brown, 2015 to 2016 in purple, and 2011 to 2012 in dashed brown. The 1981 to 2010 median is in dark gray. The gray areas around the median line show the interquartile and interdecile ranges of the data. Sea Ice Index data.

Credit: National Snow and Ice Data Center
High-resolution image

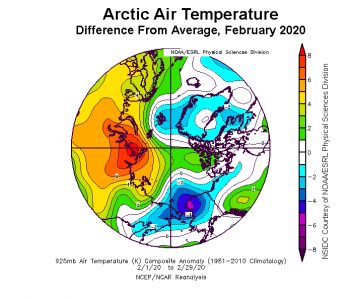
Figure 2b. This plot shows the departure from average air temperature in the Arctic at the 925 hPa level, in degrees Celsius, for February 2020. Yellows and reds indicate higher than average temperatures; blues and purples indicate lower than average temperatures. ||Credit: NSIDC courtesy NOAA Earth System Research Laboratory Physical Sciences Division High-resolution image|High-resolution image

Figure 2b. This plot shows the departure from average air temperature in the Arctic at the 925 hPa level, in degrees Celsius, for February 2020. Yellows and reds indicate higher than average temperatures; blues and purples indicate lower than average temperatures.

Credit: NSIDC courtesy NOAA Earth System Research Laboratory Physical Sciences Division
High-resolution image

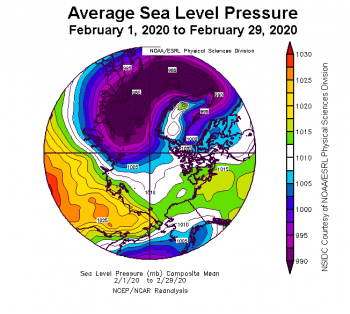
Figure 2c. This plot shows average sea level pressure in the Arctic in millibars (hPa) for February 2020. Yellows and reds indicate high air pressure; blues and purples indicate low pressure. ||Credit: NSIDC courtesy NOAA Earth System Research Laboratory Physical Sciences Division High-resolution image|High-resolution image

Figure 2c. This plot shows average sea level pressure in the Arctic in millibars (hPa) for February 2020. Yellows and reds indicate high air pressure; blues and purples indicate low pressure.

Credit: NSIDC courtesy NOAA Earth System Research Laboratory Physical Sciences Division
High-resolution image

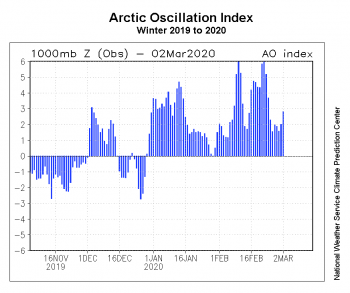
Figure2d. Over the past several months, the Arctic Oscillation has been in a persistently positive phase. This manifested as unusually low sea level pressure over the Atlantic side of the Arctic Ocean and high pressure over Eastern Eurasia, extending eastward into Arctic Canada. This figure shows the Observed Arctic Oscillation Index from November 2019 through March 1, 2020. Credit: National Weather Service Climate Prediction Center|High-resolution image

Figure 2d. Over the past several months, the Arctic Oscillation has been in a persistently positive phase. This manifested as unusually low sea level pressure over the Atlantic side of the Arctic Ocean and high pressure over Eastern Eurasia, extending eastward into Arctic Canada. This figure shows the Observed Arctic Oscillation Index from November 2019 through March 1, 2020. Credit: National Weather Service Climate Prediction Center
High-resolution image

Through the month, sea ice grew by an average of 22,100 square kilometers (8,500 square miles) per day, fairly close to the average rate over the 1981 to 2010 period of 20,200 square kilometers (7,800 square miles) per day.

Air temperatures at the 925 hPa level (about 2,500 feet above the surface, Figure 2b) were from 1 to 7 degrees Celsius (2 to 13 degrees Fahrenheit) above average across much of the Eurasian side of the Arctic Ocean, with especially large departures from average around the Taymyr Peninsula (Figure 2b). At the same time, northern Alaska and the Chukchi and Beaufort Seas saw temperatures by up to 6 degrees Celsius (11 degrees Fahrenheit) below average.

The sea level pressure pattern average for February was similar to that of January, with low pressure areas extending from the northern North Atlantic into the Kara Sea, paired with high pressure over eastern Eurasia and extending across Alaska and into northern Canada (Figure 2c). Pressures over the Barents and Kara Seas were as much as 18 hPa below the 1981 to 2010 average. This pattern was associated with a positive phase of the Arctic Oscillation (AO), continuing the basic AO pattern that has persisted since December. A very high positive AO index (4 to 6) marked portions of February, which has been associated with warm air and stormy weather from Northern Europe into the Barents Sea. This likely explains the reduction in sea ice extent in the Barents Sea and the week-long pause in sea ice growth for the Arctic as a whole during the middle of the month. Beginning around February 22, total Arctic sea ice extent started to increase again, driven by substantial increases in sea ice extent in the Bering Sea, and modest ice growth in the Barents Sea.

Previous studies, led by University of Washington scientist Ignatius Rigor (e.g., Rigor et al., 2002), suggest that a positive winter phase of the Arctic Oscillation favors low sea ice extent the subsequent September. Wind patterns “flush” old, thick ice out of the Arctic Ocean through the Fram Strait and promote the production of thin ice along the Eurasian coast that is especially prone to melting out in summer. However, in recent years, this relationship has not been as clear (Stroeve et al., 2011). The potential effects this winter’s positive AO on the summer evolution of ice extent and the September 2020 minimum bears watching.

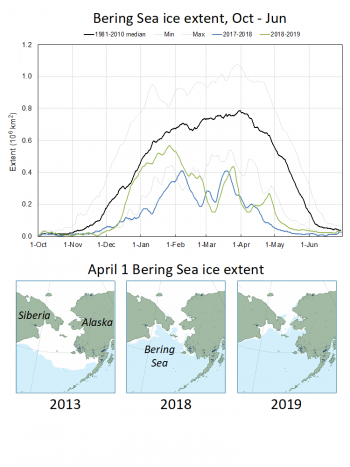
The Bering Sea ice extent is near-average, which is in marked contrast to the previous two years when extent was at or near record lows for the satellite record through much of the winter (Thoman et al., 2020).

February 2020 compared to previous years

Figure 3. Monthly February sea ice extent for 1979 to 2020 shows a decline of 2.91 percent per decade.||Credit: National Snow and Ice Data Center| High-resolution image

Figure 3. Monthly February sea ice extent for 1979 to 2020 shows a decline of 2.91 percent per decade.

Credit: National Snow and Ice Data Center
High-resolution image

Including 2020, the linear rate of decline for February ice extent is 2.91 percent per decade. This corresponds to a trend of 44,500 square kilometers (17,200 square miles) per year, which is roughly twice the size of the state of New Hampshire. Over the 42-year satellite record, the Arctic has lost about 1.75 million square kilometers (676,000 square miles) of sea ice in February, based on the difference in linear trend values in 2020 and 1979. This is comparable to the size of the state of Alaska.

Nearing the minimum in the south

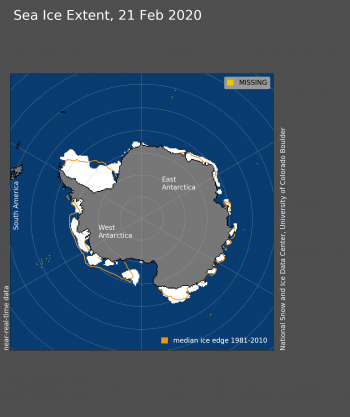
Figure 4. Antarctic sea ice extent likely reached its annual minimum on February 20 and 21, 2020. Antarctic sea ice extent for February 20 and 21, 2020 was 2.69 million square kilometers (1.04 million square miles). The magenta line shows the 1981 to 2010 average extent for that month. Sea Ice Index data. About the data||Credit: National Snow and Ice Data Center|High-resolution image

Figure 4. Antarctic sea ice extent likely reached its annual minimum on February 20 and 21, 2020. Antarctic sea ice extent for February 20 and 21, 2020 was 2.69 million square kilometers (1.04 million square miles). The orange line shows the 1981 to 2010 average extent for February 21. Sea Ice Index data. About the data

Credit: National Snow and Ice Data Center
High-resolution image

As of February 20 and 21, Antarctic sea ice extent likely reached its annual minimum at 2.69 million square kilometers (1.04 million square miles). However, as of March 1, sea ice extent has increased only marginally above the minimum value, to 2.71 million square kilometers (1.05 million square miles). The latest Antarctic minimum over the satellite record was March 3. We anticipate that sea ice will continue to expand as late summer and autumn proceed.

At this time of year, Antarctic sea ice cover is characterized by a number of small remnant patches of ice around the coast, with the largest being the western Weddell Sea and the Amundsen-Ross Sea coastal area. Overall sea ice remains below the 1981 to 2010 average, a trend that has persisted since September 2016. Sea ice extent in the Weddell area is near average overall, while ice extent in the Amundsen-Ross region is well below average. However, a patch of sea ice in the Pine Island Bay region is hampering research vessels in the area seeking to study ice-ocean interaction near some of the very large and rapidly changing glaciers draining the West Antarctic Ice Sheet.

The increasing influence of ocean waves on sea ice

A new project from University of Washington’s Applied Physics Laboratory is focusing on the complex ways that ocean waves and sea ice are interacting, as reported in a recent ARCUS webinar by researcher Jim Thomson. In October 2019, a storm-generated swell of 3- to 4-meter (10- to 13-foot) waves was observed in the Chukchi Sea. These waves are significantly larger than any previously observed in the region and are linked to declining autumn sea ice cover. Waves and sea ice have a complex range of interactions (Squire, 2018). Sea ice acts as a barrier between the ocean and atmosphere, limiting the influence of winds on the ocean surface. Waves encountering an open pack are strongly damped by the interaction of ice floes bumping together. However, large waves can fracture the ice pack and set landfast ice in motion, further breaking up the ice pack and eventually reducing the damping effect. In some cases in Antarctica, the loss of sea ice damping of waves may trigger ice shelf collapse if the ice shelves have been pre-conditioned and weakened (Massom et al., 2018). When ice is forming, waves can push pancakes of ice together, aiding in ice formation. The Coastal Ocean Dynamics in the Arctic (CODA) and Stratified Ocean Dynamics of the Arctic (SODA) projects are dedicated to further understanding these complex interactions.

Introducing the Sea Ice Analysis Tool

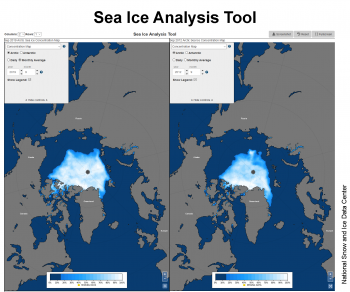
Figure 6. NSIDC developed the Sea Ice Analysis Tool to allow users to interactively analyze sea ice data from the Sea Ice Index while allowing them to visualize the data using different reference and average periods. ||Credit: National Snow and Ice Data Center| High-resolution image

Figure 5. NSIDC developed the Sea Ice Analysis Tool to allow users to interactively analyze sea ice data from the Sea Ice Index while allowing them to visualize the data using different reference and average periods.

Credit: National Snow and Ice Data Center
High-resolution image

NSIDC has developed a new visualization tool—the Sea Ice Analysis Tool—that helps users customize sea ice extent and concentration data more easily than ever before. Users have the capability to create graphs or maps that show changes in sea ice based on their chosen criteria.

Drawing on input from the user community, the Arctic Sea Ice News & Analysis (ASINA) team developed the Sea Ice Analysis Tool as a way to allow users to interactively analyze sea ice data from the Sea Ice Index while allowing them to visualize the data using different reference and average periods. This is a change from other ASINA tools, such as ChArctic, that do not have this same flexibility because they use static averaging periods.

This new tool allows users to analyze monthly-averaged or daily sea ice extent and concentration via interactive maps and graphs. In addition, the user can plot monthly ice extent anomalies, map sea ice concentration anomalies, and display images of trends in sea ice concentration, with anomalies being departures from the long-term average.

All maps and graphs are customizable; they can be created for a variety of dates, averaging periods, and trends. In addition, maps can be zoomed to focus on a specific region.

Further reading

Gautier, A. 2020. Seeing sea ice: A new tool shows dynamic changes. NSIDC.org.

Massom, R. A., T. A. Scambos, L. G. Bennetts, P. Reid, V. A. Squire, and S. E. Stammerjohn. 2018. Antarctic ice shelf disintegration triggered by sea ice loss and ocean swell. Nature. doi.org/10.1038/s41586-018-0212-1.

Rigor, I. G., J. M. Wallace, and R. L. Colony. 2002. Response of Sea Ice to the Arctic Oscillation. Journal of Climate. doi.org/10.1175/1520-0442(2002)015<2648:ROSITT>2.0.CO;2.

Squire, V. A fresh look at how ocean waves and sea ice interact. 2018. Philosophical Transactions of the Royal Society A: Mathematical, Physical and Engineering Sciences. doi.org.colorado.idm.oclc.org/10.1098/rsta.2017.0342.

Stroeve, J. C., J. Maslanik, M. C. Serreze, I. Rigor,  W. Meier, and C. Fowler. 2011. Sea ice response to an extreme negative phase of the Arctic Oscillation during winter 2009/2010, Geophyical Research Letters. doi:10.1029/2010GL045662.

Thoman, Jr., R. L., U. S. Bhatt, P. A. Bieniek, B. R. Brettschneider, M. Brubaker, S. L. Danielson, Z. Labe, R. Lader, W. N. Meier, G. Sheffield, and J. E. Walsh. 2020. The record low Bering Sea ice extent in 2018: Context, impacts, and an assessment of the role of anthropogenic climate change. Bulletin of the American Meteorological Society. doi:10.1175/BAMS-D-19-0175.1.

Thomson, J., Y. Fan, S. Stammerjohn, J. Stopa, W. E. Rogers, F. Girard-Ardhuin, F. Ardhuin, H. Shen, W. Perrie, H. Shen, S. Ackley, A. Babanin, Q. Liu, P. Guest, T. Maksym, P. Wadhams, C. Fairall, O. Persson, M. Doble, H. Graber, B. Lundr, V. Squires, J. Gemmricht, S. Lehneru, B. Holt, M. Meylan, J. Brozenax, and J. R. Bidlot. 2016. Emerging trends in the sea state of the Beaufort and Chukchi seas. Ocean Modelling. doi.org/10.1016/j.ocemod.2016.02.009.

A mostly ho-hum January

Sea ice extent for January 2020 tracked well below average, with the monthly average tied at eighth lowest in the satellite record. While air temperatures were above average across much of the Arctic Ocean, it was colder than average over the northern Barents Sea, Alaska, the eastern Canadian Arctic Archipelago, and Greenland.

Overview of conditions

Figure 1. Arctic sea ice extent for January 2020 was 13.65 million square kilometers (5.27 million square miles). The magenta line shows the 1981 to 2010 average extent for that month. Sea Ice Index data. About the data||Credit: National Snow and Ice Data Center|High-resolution image

Figure 1. Arctic sea ice extent for January 2020 was 13.65 million square kilometers (5.27 million square miles). The magenta line shows the 1981 to 2010 average extent for that month. Sea Ice Index data. About the data

Credit: National Snow and Ice Data Center
High-resolution image

Arctic sea ice extent for January 2020 was 13.65 million square kilometers (5.27 million square miles), placing it eighth lowest in the satellite record along with 2014. This was 770,000 square kilometers (297,000 square miles) below the 1981 to 2010 January average and 570,000 square kilometers (220,000 square miles) above the record low mark for January set in 2018. At the end of January, ice extent was below average over parts of the Bering Sea, the Sea of Okhotsk, and the East Greenland Sea. The near average extent in the Barents Sea contrasts with recent years, which were characterized by well below average extent in this area.

Conditions in context

Figure 2a. The graph above shows Arctic sea ice extent as of XXXX X, 20XX, along with daily ice extent data for four previous years and the record low year. 2018 to 2019 is shown in blue, 2017 to 2018 in green, 2016 to 2017 in orange, 2015 to 2016 in brown, 2014 to 2015 in purple, and 2011 to 2012 in dotted brown. The 1981 to 2010 median is in dark gray. The gray areas around the median line show the interquartile and interdecile ranges of the data. Sea Ice Index data.||Credit: National Snow and Ice Data Center|High-resolution image

Figure 2a. The graph above shows Arctic sea ice extent as of February 3, 2020, along with daily ice extent data for four previous years and the record low year. 2019 to 2020 is shown in blue, 2018 to 2019 in green, 2017 to 2018 in orange, 2016 to 2017 in brown, 2015 to 2016 in purple, and 2012 to 2013 in dotted brown. The 1981 to 2010 median is in dark gray. The gray areas around the median line show the interquartile and interdecile ranges of the data. Sea Ice Index data.

Credit: National Snow and Ice Data Center
High-resolution image

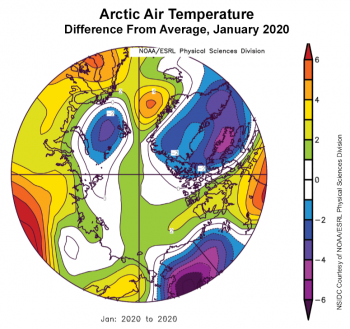
Figure 2b. This plot shows the departure from average air temperature in the Arctic at the 925 hPa level, in degrees Celsius, for March 2019. Yellows and reds indicate higher than average temperatures; blues and purples indicate lower than average temperatures. ||Credit: NSIDC courtesy NOAA Earth System Research Laboratory Physical Sciences Division|High-resolution image

Figure 2b. This plot shows the departure from average air temperature in the Arctic at the 925 hPa level, in degrees Celsius, for January 2020. Yellows and reds indicate higher than average temperatures; blues and purples indicate lower than average temperatures.

Credit: NSIDC courtesy NOAA Earth System Research Laboratory Physical Sciences Division
High-resolution image

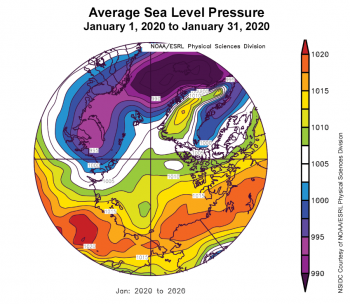
Figure 2c. This plot shows average sea level pressure in the Arctic in millibars (hPa) from January 1, 2020 to January 31, 2020. Yellows and reds indicate high air pressure; blues and purples indicate low pressure. ||Credit: NSIDC courtesy NOAA Earth System Research Laboratory Physical Sciences Division|High-resolution image

Figure 2c. This plot shows average sea level pressure in the Arctic in millibars (hPa) from January 1, 2020 to January 31, 2020. Yellows and reds indicate high air pressure; blues and purples indicate low pressure.

Credit: NSIDC courtesy NOAA Earth System Research Laboratory Physical Sciences Division
High-resolution image

Through the month, sea ice grew by an average of 45,200 square kilometers (17,500 square miles) per day, fairly close to the average rate over the 1981 to 2010 period of 42,700 square kilometers (16,500 square miles per day). This contrasts with December, when the growth rate was considerably faster than average.

Air temperatures at the 925 hPa level (about 2,500 feet above the surface) were from 1 to 3 degrees Celsius (2 to 5 degrees Fahrenheit) above average across much of the Arctic Ocean, but temperatures were up to 5 to 6 degrees Celsius (9 to 11 degrees Fahrenheit) below average over the northern Barents Sea and southern Alaska (Figure 2b). Temperatures were also below average over much of the eastern Canadian Arctic Archipelago and Greenland.

The sea level pressure pattern average for the month was somewhat unusual, with low pressure extending from the northern North Atlantic into the Kara Sea, contrasting with high pressure over eastern Eurasia and extending across Alaska and northern Canada (Figure 2c). Pressures over the Kara Sea region were as much as 15 hPa below the 1981 to 2010 average. This pattern was associated with a strongly positive phase of the Arctic Oscillation through most of the month. However, toward the end of January, the Arctic Oscillation Index had returned to near neutral conditions.

January 2020 compared to previous years

Figure 3. Monthly XXXXX ice extent for 1979 to 201X shows a decline of X.X percent per decade.||Credit: National Snow and Ice Data Center| High-resolution image

Figure 3. Monthly January ice extent for 1979 to 2020 shows a decline of 3.15 percent per decade.

Credit: National Snow and Ice Data Center
High-resolution image

Including 2020, the linear rate of decline for January ice extent is 3.15 percent per decade. This corresponds to a trend of 45,400 square kilometers (17,500 square miles) per year, which is roughly twice the size of the state of New Hampshire. Over the 42-year satellite record, the Arctic has lost about 1.86 million square kilometers (718,000 square miles) of ice in January, based on the difference in linear trend values in 2020 and 1979. This is an area larger than the state of Alaska.

Check-in on Antarctic sea ice

Figure 4. Antarctic sea ice extent for XXXX 20XX was X.XX million square kilometers (X.XX million square miles). The magenta line shows the 1981 to 2010 average extent for that month. Sea Ice Index data. About the data||Credit: National Snow and Ice Data Center|High-resolution image

Figure 4. Antarctic sea ice extent for January 2020 was 4.51 million square kilometers (1.74 million square miles). The magenta line shows the 1981 to 2010 average extent for that month. Sea Ice Index data. About the data

Credit: National Snow and Ice Data Center
High-resolution image

In the Antarctic, the rate of ice loss slowed considerably over the month of January. During the month, extent declined 3.19 million square kilometers (1.23 million square miles), which is slower than the 1981 to 2010 average loss of 3.79 million square kilometers (1.46 million square miles). By the end of the month, extent was nearly within the interquartile range of the median extent, though still below average. January is the month of the second largest seasonal ice loss, behind December, as the Antarctic extent approaches its annual minimum, usually in February. Extent was lower than average in the eastern and southeastern part of the Weddell Sea, where cooler conditions prevailed (1 to 2 degrees Celsius, or 2 to 4 degrees Fahrenheit, below average) and higher than average in the northern Weddell. In the eastern Ross Sea, ice cover was dispersed and lower than average despite fairly cool conditions there. Elsewhere around Antarctica, extent was near average, with the ice retreating back to near the coast. The northern Peninsula and much of the Wilkes Land sector of the Southern Ocean was 1 to 2 degrees Celsius (2 to 4 degrees Fahrenheit) above average .

New study implicates ozone-destroying substances in Arctic warming

A new study from Columbia University presents evidence that half of the Arctic sea ice loss and surface warming over the 1955 to 2005 period can be attributed to the greenhouse effect of ozone-depleting substances (ODS). This includes, for example, chlorofluorocarbons—better known as CFCs. ODS concentrations peaked towards the end of the last century, well after the Montreal Protocol of 1987, which called for an end to their production. While the continuing decline of ODS concentrations should lead to healing of the well-known Antarctic Ozone Hole, the fact that that these ODS are also potent greenhouse gases implies that their continued decline in the atmosphere will help to reduce the rate of Arctic warming.

Further Reading:

Polvani, L. M., M. Previdi, M. R. England, G. Chiodo and K. L. Smith. 2020. Substantial twentieth-century Arctic warming caused by ozone-depleting substance. Nature Climate Change. doi:10.1038/s41558-019-0677-4.

Erratum

A reader alerted us that we mistakenly said January 2020 was had the ninth lowest monthly average for sea ice extent. On February 7, we corrected this to say it was tied for eighth lowest.

That’s a wrap: A look back at 2019 and the past decade

The year 2019 saw an early melt onset and high sea surface temperatures during summer in the Beaufort and Chukchi Seas. The September minimum extent ended up tied with 2007 and 2016 for second lowest in the satellite record. Autumn freeze up was slow. In December, the Chukchi Sea finally completely refroze, Hudson Bay iced over, and sea ice extended south into the Bering Sea. The year 2019 still ended up with low extent in the Bering Sea. Taking a longer view, the defining feature of the decade of the 2010s was consistently low Arctic sea ice extent compared to long-term averages.

Overview of conditions

Figure 1. Arctic sea ice extent for XXXX 20XX was X.XX million square kilometers (X.XX million square miles). The magenta line shows the 1981 to 2010 average extent for that month. Sea Ice Index data. About the data||Credit: National Snow and Ice Data Center|High-resolution image

Figure 1. Arctic sea ice extent for December 2019 was 11.95 million square kilometers (4.61 million square miles). The magenta line shows the 1981 to 2010 average extent for that month. Sea Ice Index data. About the data

Credit: National Snow and Ice Data Center
High-resolution image

At the close of December, sea ice growth had gained enough ground for daily extent to rank only seventh lowest, the highest at this time since 2014. Extent averaged for the month was 11.95 million square kilometers (4.61 million square miles), tied with 2006 as the fifth lowest December extent in the satellite record. This was 890,000 square kilometers (344,000 square miles) below the 1981 to 2010 December average and 490,000 square kilometers (189,000 square miles) above the record low mark for December set in 2016.

Total ice extent is less variable this time of year as compared to summer. The reason is that over most longitudes, ice extends to the coast and, thus, cannot grow southward. The only place where extent varies is where the southern limit of ice is not bound by land—the Bering Sea, Sea of Okhotsk, East Greenland Sea, Barents Sea, and Baffin Bay. Other than the East Greenland Sea, which is essentially at average levels, these other regions have slightly below average extents. The Chukchi Sea finally froze up completely on December 24. Only 2016 and 2017 saw open water in the Chukchi later in the season.

Conditions in context

Figure 2a. The graph above shows Arctic sea ice extent as of January 5, 2020, along with daily ice extent data for four previous years and the record low year. 2019 to 2020 is shown in blue, 2018 to 2019 in green, 2017 to 2018 in orange, 2016 to 2017 in brown, 2015 to 2016 in purple, and 2012 to 2013 in dotted brown. The 1981 to 2010 median is in dark gray. The gray areas around the median line show the interquartile and interdecile ranges of the data. Sea Ice Index data.||Credit: National Snow and Ice Data Center|High-resolution image

Figure 2a. The graph above shows Arctic sea ice extent as of January 6, 2020, along with daily ice extent data for four previous years and the record low year. 2019 to 2020 is shown in blue, 2018 to 2019 in green, 2017 to 2018 in orange, 2016 to 2017 in brown, 2015 to 2016 in purple, and 2012 to 2013 in dotted brown. The 1981 to 2010 median is in dark gray. The gray areas around the median line show the interquartile and interdecile ranges of the data. Sea Ice Index data.

Credit: National Snow and Ice Data Center
High-resolution image

Figure 2b. This plot shows the departure from average air temperature in the Arctic at the 925 hPa level, in degrees Celsius, for December 2019. Yellows and reds indicate higher than average temperatures; blues and purples indicate lower than average temperatures. ||Credit: NSIDC courtesy NOAA Earth System Research Laboratory Physical Sciences Division |High-resolution image

Figure 2b. This plot shows the departure from average air temperature in the Arctic at the 925 hPa level, in degrees Celsius, for December 2019. Yellows and reds indicate higher than average temperatures; blues and purples indicate lower than average temperatures.

Credit: NSIDC courtesy NOAA Earth System Research Laboratory Physical Sciences Division
High-resolution image

December 2019 sea ice grew by an average of 82,100 square kilometers (31,700 square miles) per day. This is faster than the 1981 to 2010 average gain of 64,100 square kilometers (24,700 square miles per day) and is the third fastest December ice growth rate in the satellite record, behind 2006 and 2016. Such fast growth is not surprising. There was considerable ocean heat, particularly in the Chukchi Sea, which delayed freeze up. When the Chukchi waters finally lost their heat, the Arctic was in 24-hour darkness and the cold atmosphere allowed ice to grow rapidly.

Temperatures at the 925 mb level (about 2,500 feet above sea level) were above average over most of the Arctic Ocean. As expected due to continued open water during much of the month, the Chukchi Sea was particularly warm, up to 5 degrees Celsius (9 degrees Fahrenheit) above average (Figure 2b). However, temperatures north of Greenland were also 5 degrees Celsius (9 degrees Fahrenheit) above average. This may be related to strong low pressure over Scandinavia combined with higher than average pressure over the central Arctic Ocean, acting to funnel in warm air from the south.

December 2019 compared to previous years

Figure 3. Monthly December ice extent for 1979 to 2019 shows a decline of X.X percent per decade.||Credit: National Snow and Ice Data Center| High-resolution image

Figure 3. Monthly December ice extent for 1979 to 2019 shows a decline of 3.6 percent per decade.

Credit: National Snow and Ice Data Center
High-resolution image

Including 2019, the linear rate of decline for December ice extent is 3.6 percent per decade. This corresponds to a trend of 46,500 square kilometers (18,000 square miles) per year, which is roughly twice the size of the state of New Jersey. Over the 41-year satellite record, the Arctic has lost about 1.9 million square kilometers (734,000 square miles) of ice in December, based on the difference in linear trend values in 2019 and 1979. This is comparable to the size of Alaska and California combined.

The Arctic Report Card and a view from the north

Figure 4. The Polarstern, frozen into the sea ice in the dark Arctic night during the MOSAiC expedition. ||Photo credit: Alfred-Wegener-Institut/Esther Horvath (CC-BY 4), from http://ciresblogs.colorado.edu/mosaic/2019/12/03/creating-a-mountain/.| High-resolution image

Figure 4. This photo shows the RV Polarstern, the German icebreaker that is frozen into Arctic sea ice during the Multidisciplinary drifting Observatory for the Study of Arctic Change expedition.

Photo credit: Alfred-Wegener-Institut/Esther Horvath
High-resolution image

On December 10, the National Oceanic and Atmospheric Administration (NOAA) 2019 Arctic Report Card was released at the American Geophysical Union Fall Meeting in San Francisco. The report focuses on conditions over the past year in the Arctic. One of the primary topics presented was the impact of low sea ice extent and other changes in the Arctic on Indigenous Peoples, who for the first time contributed directly to the report.

In mid-December, NSIDC senior research scientist and ASINA-contributor Julienne Stroeve joined the second leg of the Multidisciplinary drifting Observatory for the Study of Arctic Change (MOSAiC) expedition. She is now aboard the RV Polarstern, a German icebreaker that is frozen into sea ice north of Siberia, and she will stay on the ship through mid-February. The ship will remain locked in sea ice for a year, hosting several hundred scientists studying the ice, the atmosphere, and the ocean and its biogeochemistry as it drifts across the Arctic Ocean toward Greenland. Stroeve reports that as of January 4, 2020, the ship is located at 87 degrees N and 115 degrees E, about 335 kilometers (208 miles) from the pole. Air temperatures have ranged between -25 to -35 degrees Celsius (-13 to -31 degrees Fahrenheit), with a wind chill of -55 degrees Celsius (-67 degrees Fahrenheit) at times. The ship has been enveloped in complete darkness since mid-October, and the sun will not rise above the horizon until mid-March.

Stroeve is part of the “Remote Sensing City” group, a team that is using passive and active microwave instruments to study the sea ice and to gather improved information on sea ice thickness and snow depth. The extreme conditions of the far north have offered unique challenges to the scientists, including the arrival of a major storm that opened up a lead directly under their research site. The storm endangered the group’s equipment, though they were luckily able to move their instruments to safer ice. The instruments are currently situated on multiyear ice but the group is considering moving them to first-year ice to obtain data on salinated ice and snow. Moving the instruments and cables to a new site would require a major effort from the group, but gathering data from first-year ice would be valuable.

The expedition can be followed via the MOSAiC website as well as through a blog written by our Cooperative Institute for Research in Environmental Sciences (CIRES) colleague, Matthew Shupe, who is an atmospheric scientist and a co-coordinator of the MOSAiC project.

The southern view

Figure 5. Antarctic sea ice extent for December 2019 was 9.30 million square kilometers (3.59 million square miles). The orange line shows the 1981 to 2010 average extent for that month. Sea Ice Index data. About the data||Credit: National Snow and Ice Data Center|High-resolution image

Figure 5. Antarctic sea ice extent for December 2019 was 9.30 million square kilometers (3.59 million square miles). The orange line shows the 1981 to 2010 average extent for that month. Sea Ice Index data. About the data

Credit: National Snow and Ice Data Center
High-resolution image

In the Southern Hemisphere, the summer ice loss rate slowed somewhat during the month. Daily sea ice extent remains below average, but is well above the record low levels seen in 2018. The December monthly average extent was 9.30 million square kilometers (3.59 million square miles). This is the fifth lowest December extent in the satellite record, above the record low mark set in 2016 as well as 2018, 1982, and 1979. Regionally, there was markedly low extent in the eastern Weddell Sea, while extent in the sector between the Ross and Amundsen Seas was well above average. Slightly above-average extent remained along much of the East Antarctic coast.

CIRES scientist and ASINA-contributor Ted Scambos is currently in Antarctica studying Thwaites Glacier as part of the International Thwaites Glacier Collaboration, a five-year partnership between the US National Science Foundation and the UK Natural Environment Research Council. Scambos is the lead American scientific coordinator for the mission and a member of the Thwaites-Amundsen Regional Survey and Network (TARSAN) project team.

2019: The year in review

Figure 6a. This figure shows Chukchi Sea ice extent for 2019, 2018, and 2012, along with the 1981 to 2010 median and minimum and maximums for different periods. ||Credit: Kevin Wood, University of Washington Joint Institute for the Study of the Atmosphere and Ocean (JISAO) and the NOAA Pacific Marine Environmental Laboratory | High-resolution image

Figure 6a. This figure shows Chukchi Sea ice extent for 2019, 2018, and 2012, along with the 1981 to 2010 median and minima and maxima for different periods.

Credit: Kevin Wood, University of Washington Joint Institute for the Study of the Atmosphere and Ocean (JISAO) and the NOAA Pacific Marine Environmental Laboratory
High-resolution image

Figure 6b. This figure shows the daily Bering Sea ice extent for October through June 2017 to 2018 and 2018 to 2019 compared to average. This figure is based on NSIDC Sea Ice Index data (top). It also shows a Bering Sea ice extent map for April 1 of 2013, 2018, and 2019, the date of the average maximum extent for the region, from MASIE (bottom). ||Credit: National Snow and Ice Data Center|High-resolution image

Figure 6b. The graph, based on NSIDC Sea Ice Index Data, shows the daily Bering Sea ice extent for October through June 2017 to 2018 and 2018 to 2019 compared to average. The three maps show Bering Sea ice extent for April 1 in 2013, 2018, and 2019, the date of the average maximum extent for the region, from the Multisensor Analyzed Sea Ice Extent (MASIE) product.

Credit: National Snow and Ice Data Center
High-resolution image

Throughout the year, below average extent characterized Arctic sea ice, but with much variation. Overall, winter extent was not as low as compared to the previous four years from 2015 to 2018. The seasonal maximum, reached on March 13, was seventh lowest in the satellite record. The seasonal onset of melt was particularly early, contributing to record low extent during April. During May and June, the rate of ice loss remained well below average. Extent dropped to record low levels in mid-July through early August but the loss then slowed considerably compared to average. The minimum extent, reached on September 18, tied with 2007 and 2016 as the second lowest extent in the satellite record at 4.15 million square kilometers (1.60 million square miles). Autumn freeze up was initially slow, particularly in the Chukchi Sea (Figure 6a). Here, sea ice extent was at record low levels during October and November; sea surface temperatures remained 5 to 7 degrees Celsius (9 to 13 degrees Fahrenheit) above average well into the autumn.

As was also the case in 2018, the Bering Sea had extremely low sea ice cover during the winter of 2019 (Figure 6b). NSIDC Distributed Active Archive Center scientist and ASINA-contributor Walt Meier was a co-author on a recently-published study (Thoman et al., 2020) reporting that the extreme low sea ice extent in this region was unlikely to have occurred without anthropogenic warming.

Air temperatures in the Arctic region were above average throughout the year, particularly during spring and summer. Zach Labe of the University of California, Irvine, using data from the NCEP/NCAR Reanalsysis, noted that 925 mb air temperatures north of 70 degrees N latitude were among the three highest—since the satellite record began in 1979—for all months between April and October, including record highs in May and August. The NASA Goddard Institute for Space Studies data record shows that the 2019 annual average Arctic temperatures were the second highest in the satellite record, below 2016. Sea surface temperatures, as shown in Upper layer Temperature of the Polar Oceans (UpTempO) buoys, were above average throughout the summer, with temperatures in many ice-free areas exceeding 5 degrees Celsius (9 degrees Fahrenheit) above average. Warm ocean conditions lingered well into autumn, inhibiting ice growth.

In the Antarctic, the summer extent (January through March) was higher than in recent years, but still below the 1981 to 2010 average. The winter extent reached near-average levels until a steep decline in the early spring put extent well below average, with near record low extent by November. More moderate declines thereafter kept extents low, but well above record values, through the end of 2019.

A look back at the 2010s

Figure 7a. This figure shows decadal-average daily sea ice extent for the Arctic (top) and Antarctic (bottom). ||Credit: National Snow and Ice Data Center|High-resolution image

Figure 7a. This figure shows decadal-average daily sea ice extent for the Arctic (top) and the Antarctic (bottom).

Credit: National Snow and Ice Data Center
High-resolution image

Figure 7b. This figure shows the September 2019 Arctic sea ice extent (in white), overlaid with contours (in magenta) of decadal average September extents for the 1980s, 1990s, 2000s, and 2010s. Image basemap from NASA Blue Marble. ||Credit: National Snow and Ice Data Center|High-resolution image

Figure 7b. This figure shows the September 2019 Arctic sea ice extent (white), overlaid with contours (magenta) of decadal average September extents for the 1980s, 1990s, 2000s, and 2010s. The image base map is from the NASA Blue Marble.

Credit: National Snow and Ice Data Center
High-resolution image

Arctic sea ice extent was persistently low through the decade, punctuated by the record low September minimum of 2012. Overall, eight of the ten lowest September monthly average extents in the satellite record occurred during the past decade and the thirteen lowest extents have occurred in the last thirteen years from 2007 to 2019. Because consistently low extents defined the decade, the September trend was essentially zero over 2010 to 2019. October and April showed the largest downward trends during the decade of 10.3 percent and 8.3 percent, respectively. This may reflect later freeze up and earlier melt onset indicative of higher spring and autumn temperatures. However, caution should be used in interpreting trends over a ten-year period because year-to-year variations are high and outliers can strongly affect the trend value over such a short period. Another way to examine decadal changes is by comparing decadal averages. Extent in the 1990s was lower than the 1980s, extent in the 2000s was lower than the 1990s, and the 2010s had the lowest extent (Figure 7a and 7b).

The story is much different in the Antarctic. Ice extents between the decades are nearly indistinguishable from each other (Figure 7a). The 1980s had slightly lower extents during March through June and the 2010s had slightly higher extents because of record high extents earlier in the decade. But overall, the differences are small.

Arctic thickness and volume also remained low throughout the decade, as indicated by the Pan-Arctic Ice Ocean Modeling and Assimilation System (PIOMAS) volume estimates and thickness estimates from the European Space Agency (ESA) CryoSat-2 satellite. Sea ice age fields show that multiyear ice, or ice that has survived at least one summer melt season, covered about 30 percent of the Arctic Ocean winter ice cover on average during the 2010s compared to about 50 percent in the 1980s. The oldest ice (more than 4-years old), which once covered about 30 percent of the Arctic Ocean in the 1980s, has nearly disappeared by the end of this decade.

There were significant research advances in the past decade, far more than can be recapped here. However, we discuss a few as examples. First, our ability to observe the ice greatly increased with the advent of satellite altimeters allowing researchers to estimate thickness over the entire Arctic Ocean. The European Space Agency CryoSat-2 satellite was launched at the beginning of the decade in April 2010, while the NASA ICESat-2 satellite, short for Ice, Cloud and land Elevation Satellite, launched near the end of the decade. Also spanning the decade was NASA Operation IceBridge, an airborne mission that flew over sea ice and land ice for over 10 years, filling in key observational gaps between ICESat, which de-orbited in 2010, and ICESat-2, which launched in 2018.

Modeling studies helped gain a better understanding of what the future holds. Countering speculation after the 2007 record low extent that a sea ice “tipping point” may have been reached, modeling studies (e.g., Tietsche et al., 2011) show that a tipping point scenario is unlikely. Over the long-term, it seems that sea ice is responding largely linearly to rising carbon dioxide levels, suggesting that our future emission trajectory will determine when and whether ice-free summer conditions will occur (Notz and Stroeve, 2016). Under our current emission trajectory, ice-free conditions are likely in the coming decades. However, modeling studies indicate that natural climate variability will play a big role in determining the first occurrence of a seasonally ice free Arctic Ocean, with at least a 20-year uncertainty window (Jahn et al., 2016).

There was great interest in potential links between strong Arctic warming and mid-latitude weather patterns. Jennifer Francis at the University of Rutgers and Steve Vavrus at the University of Wisconsin (Francis and Vavrus, 2012) argued for a link between the Arctic warming and changes in the jet stream that would result in more extremes in mid-latitude weather. This initiated heated debate within the science community. Some studies found support for the hypothesis, but others presented contradicting evidence (Cohen et al., 2019). At this point, the issue remains open.

The Intergovernmental Panel on Climate Change recently published their Special Report on the Oceans and Cryosphere in a Changing Climate, providing an overview of the state of the science.

Further Reading

Cohen, J. and co-authors. 2019. Divergent consensuses on Arctic amplification influence on midlatitude severe winter weather. Nature Climate Change. doi:10.1038/s41558-019-0662-y.

Francis, J. A., and S. J. Vavrus. 2012. Evidence linking Arctic amplification to extreme weather in mid-latitudes. Geophysical Research Letters. doi:10.1029/2012GL051000.

Jahn, A., J. E. Kay, M. M. Holland, and D. M. Hall. 2016. How predictable is the timing of a summer ice-free Arctic? Geophysical Research Letters. doi:10.1002/2016GL070067.

Notz, D., and J. Stroeve. 2016. Observed Arctic sea-ice loss directly follows anthropogenic CO2 emission. Science. doi:10.1126/science.aag2345.

Thoman, Jr., R. L., U. S. Bhatt, P. A. Bieniek, B. R. Brettschneider, M. Brubaker, S. L. Danielson, Z. Labe, R. Lader, W. N. Meier, G. Sheffield, and J. E. Walsh. 2020. The record low Bering Sea ice extent in 2018: Context, impacts, and an assessment of the role of anthropogenic climate change. Bulletin of the American Meterological Society. doi:10.1175/BAMS-D-19-0175.1.

Tietsche, S., D. Notz, J. H. Jungclaus, and J. Marotzke. 2011. Recovery mechanisms of Arctic summer sea ice. Geophysical Research Letters. doi:10.1029/2010GL045698.