Entering December, which is the start of winter in the Northern Hemisphere, sea ice extent remains far below average, dominated by the lack of ice on both the Pacific and Atlantic sides of the Arctic Ocean. As was the case for October, air temperatures averaged for November were well above average over much of the Arctic Ocean, notably over open water areas. Averaged for the month, total ice extent for November 2020 was the second lowest in the satellite record.
Overview of conditions
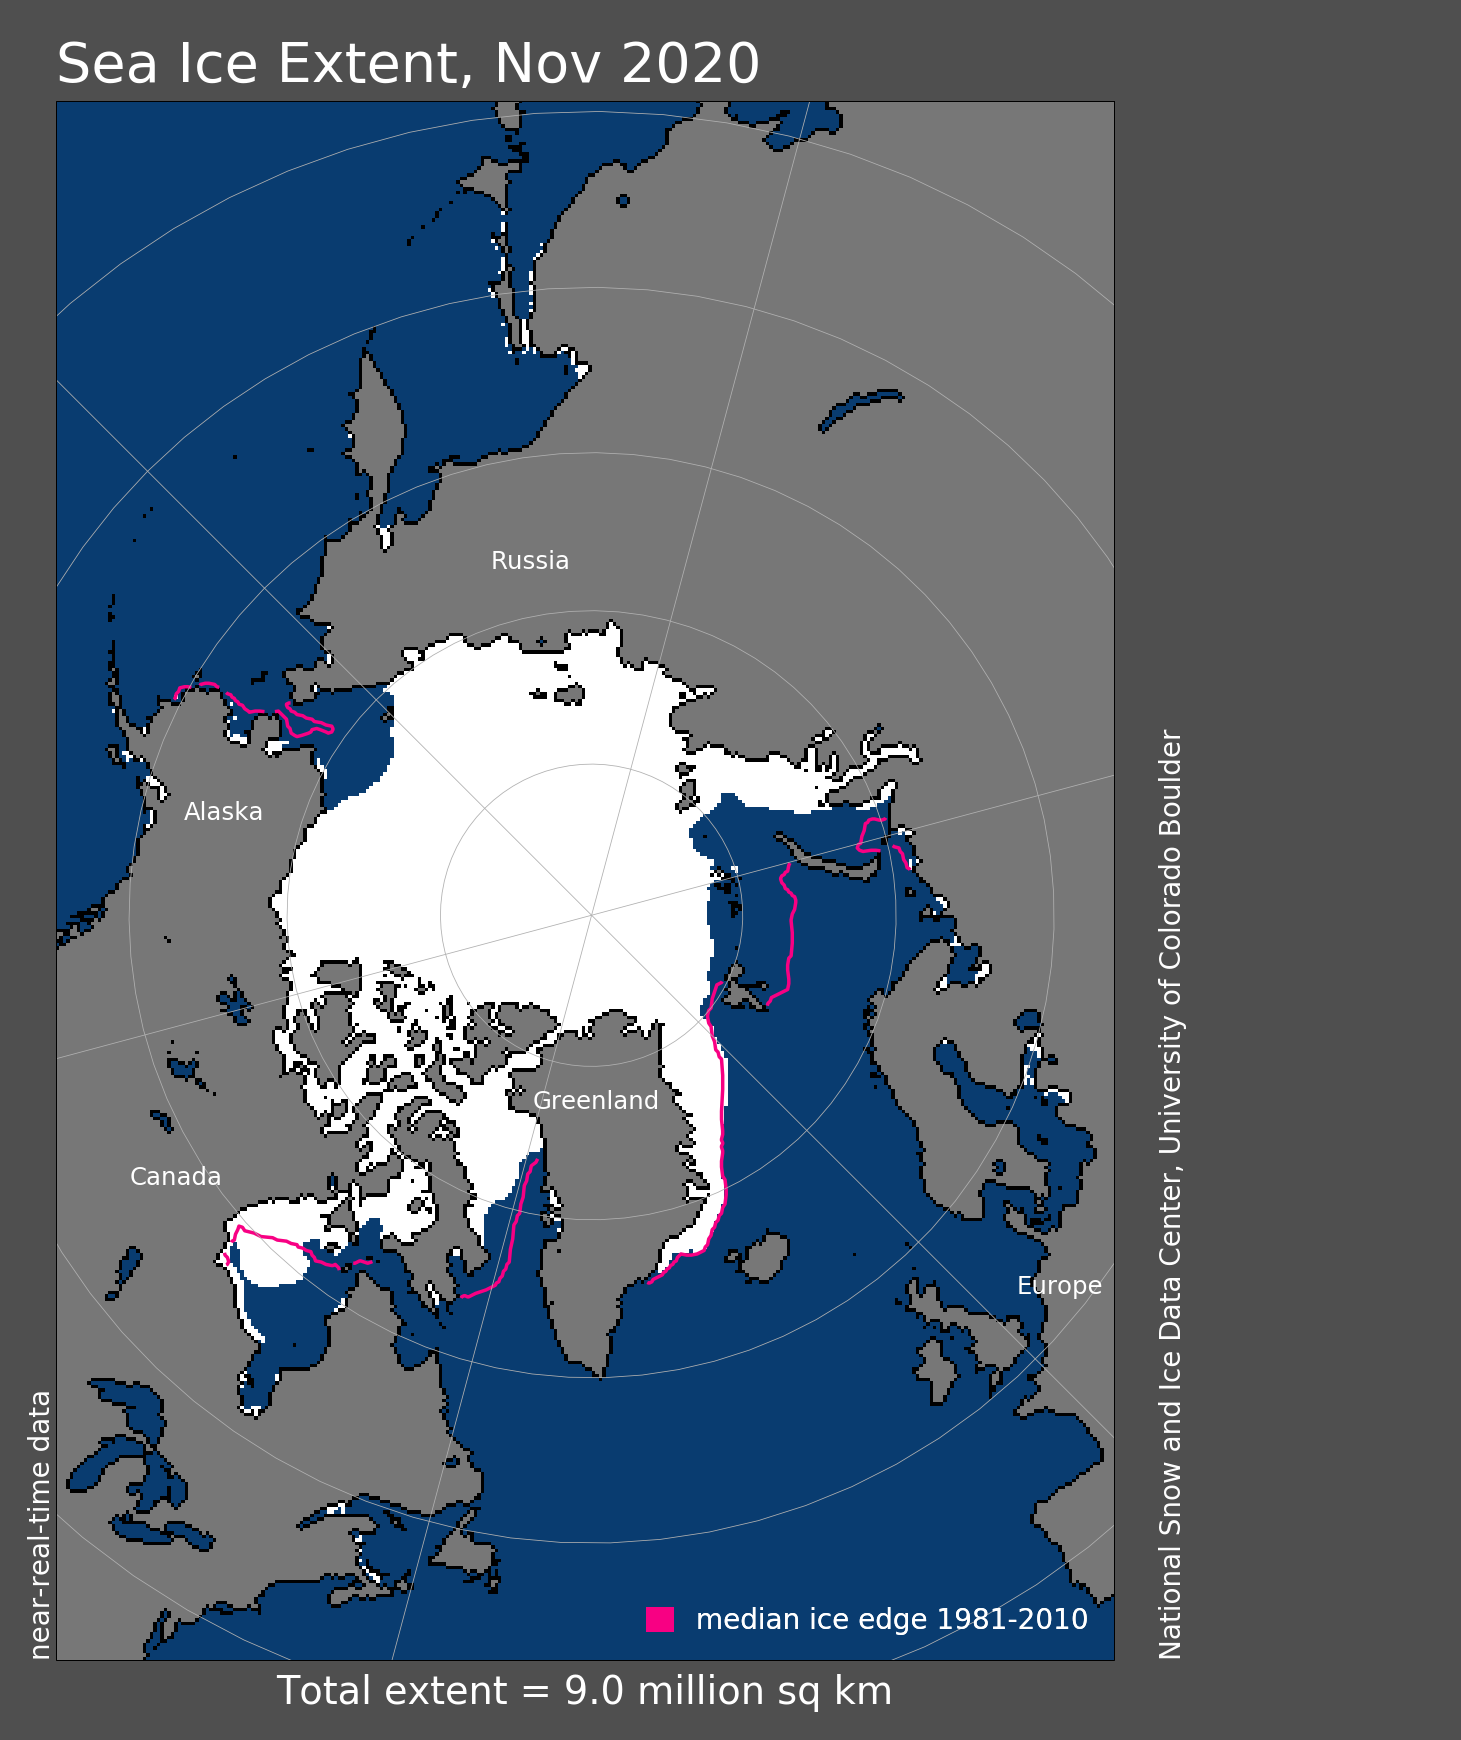
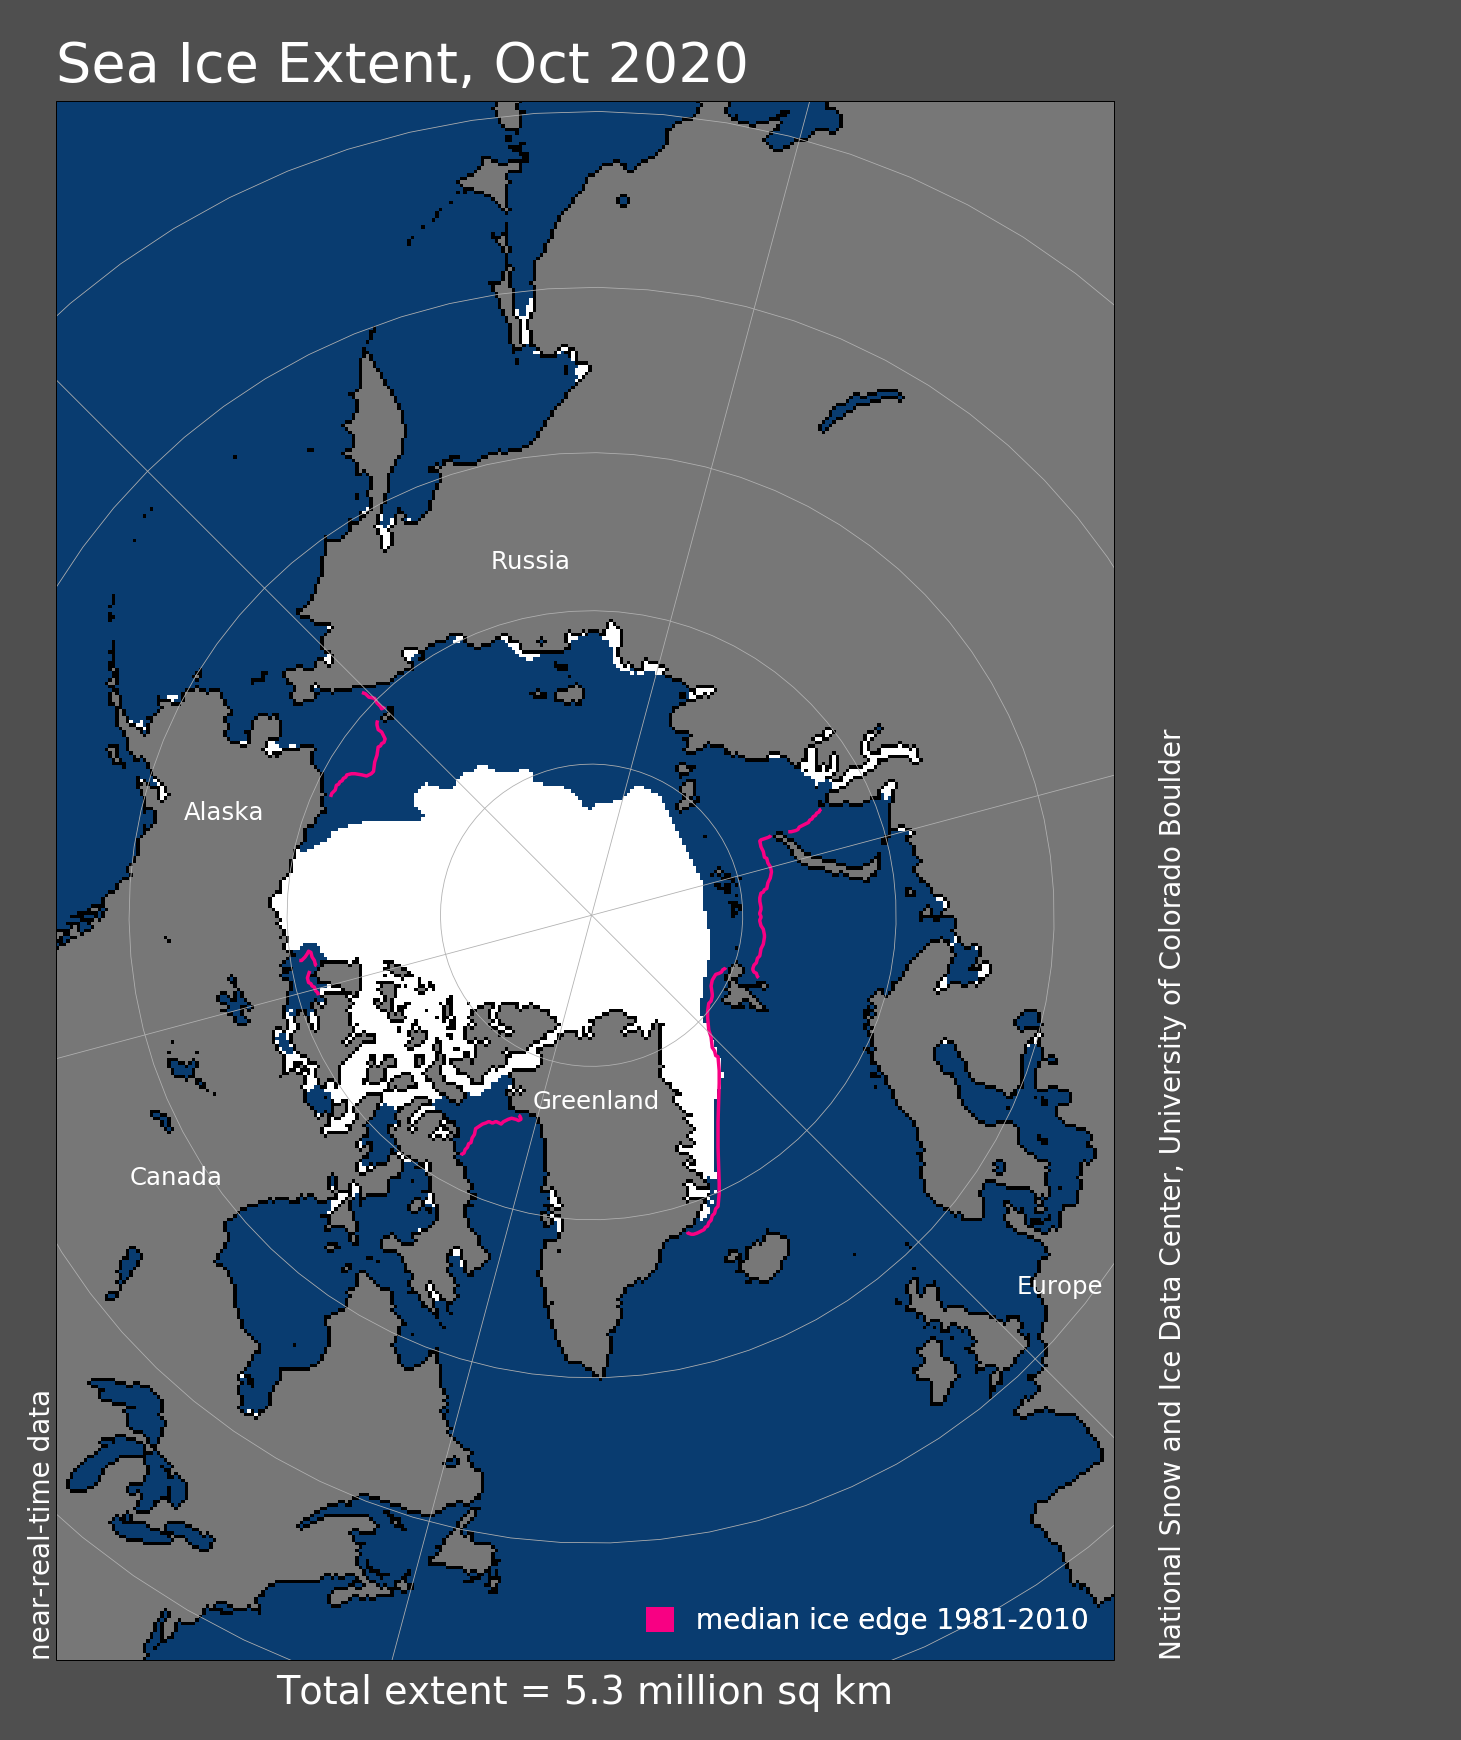
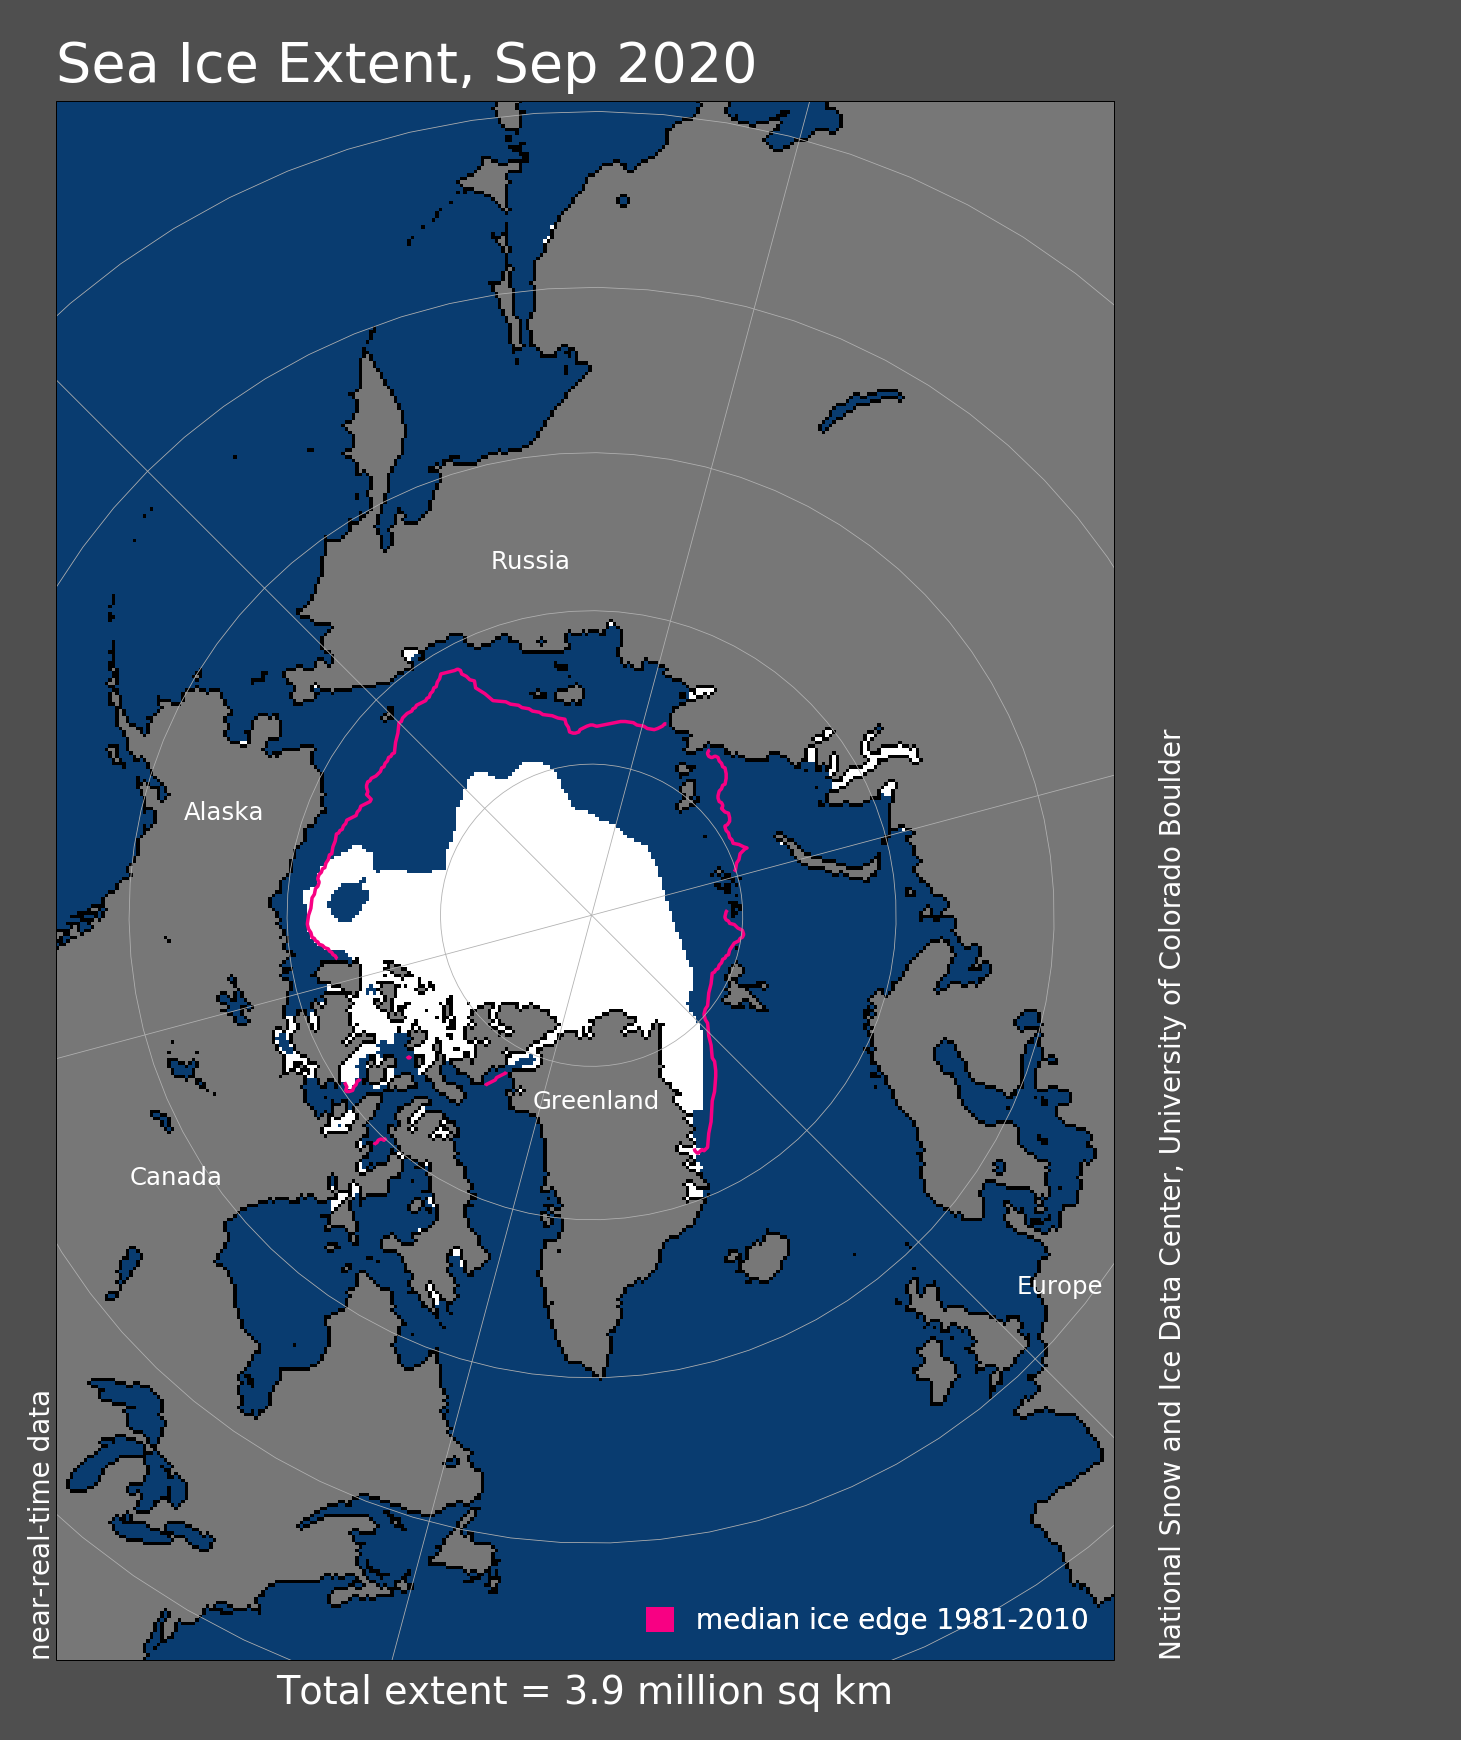
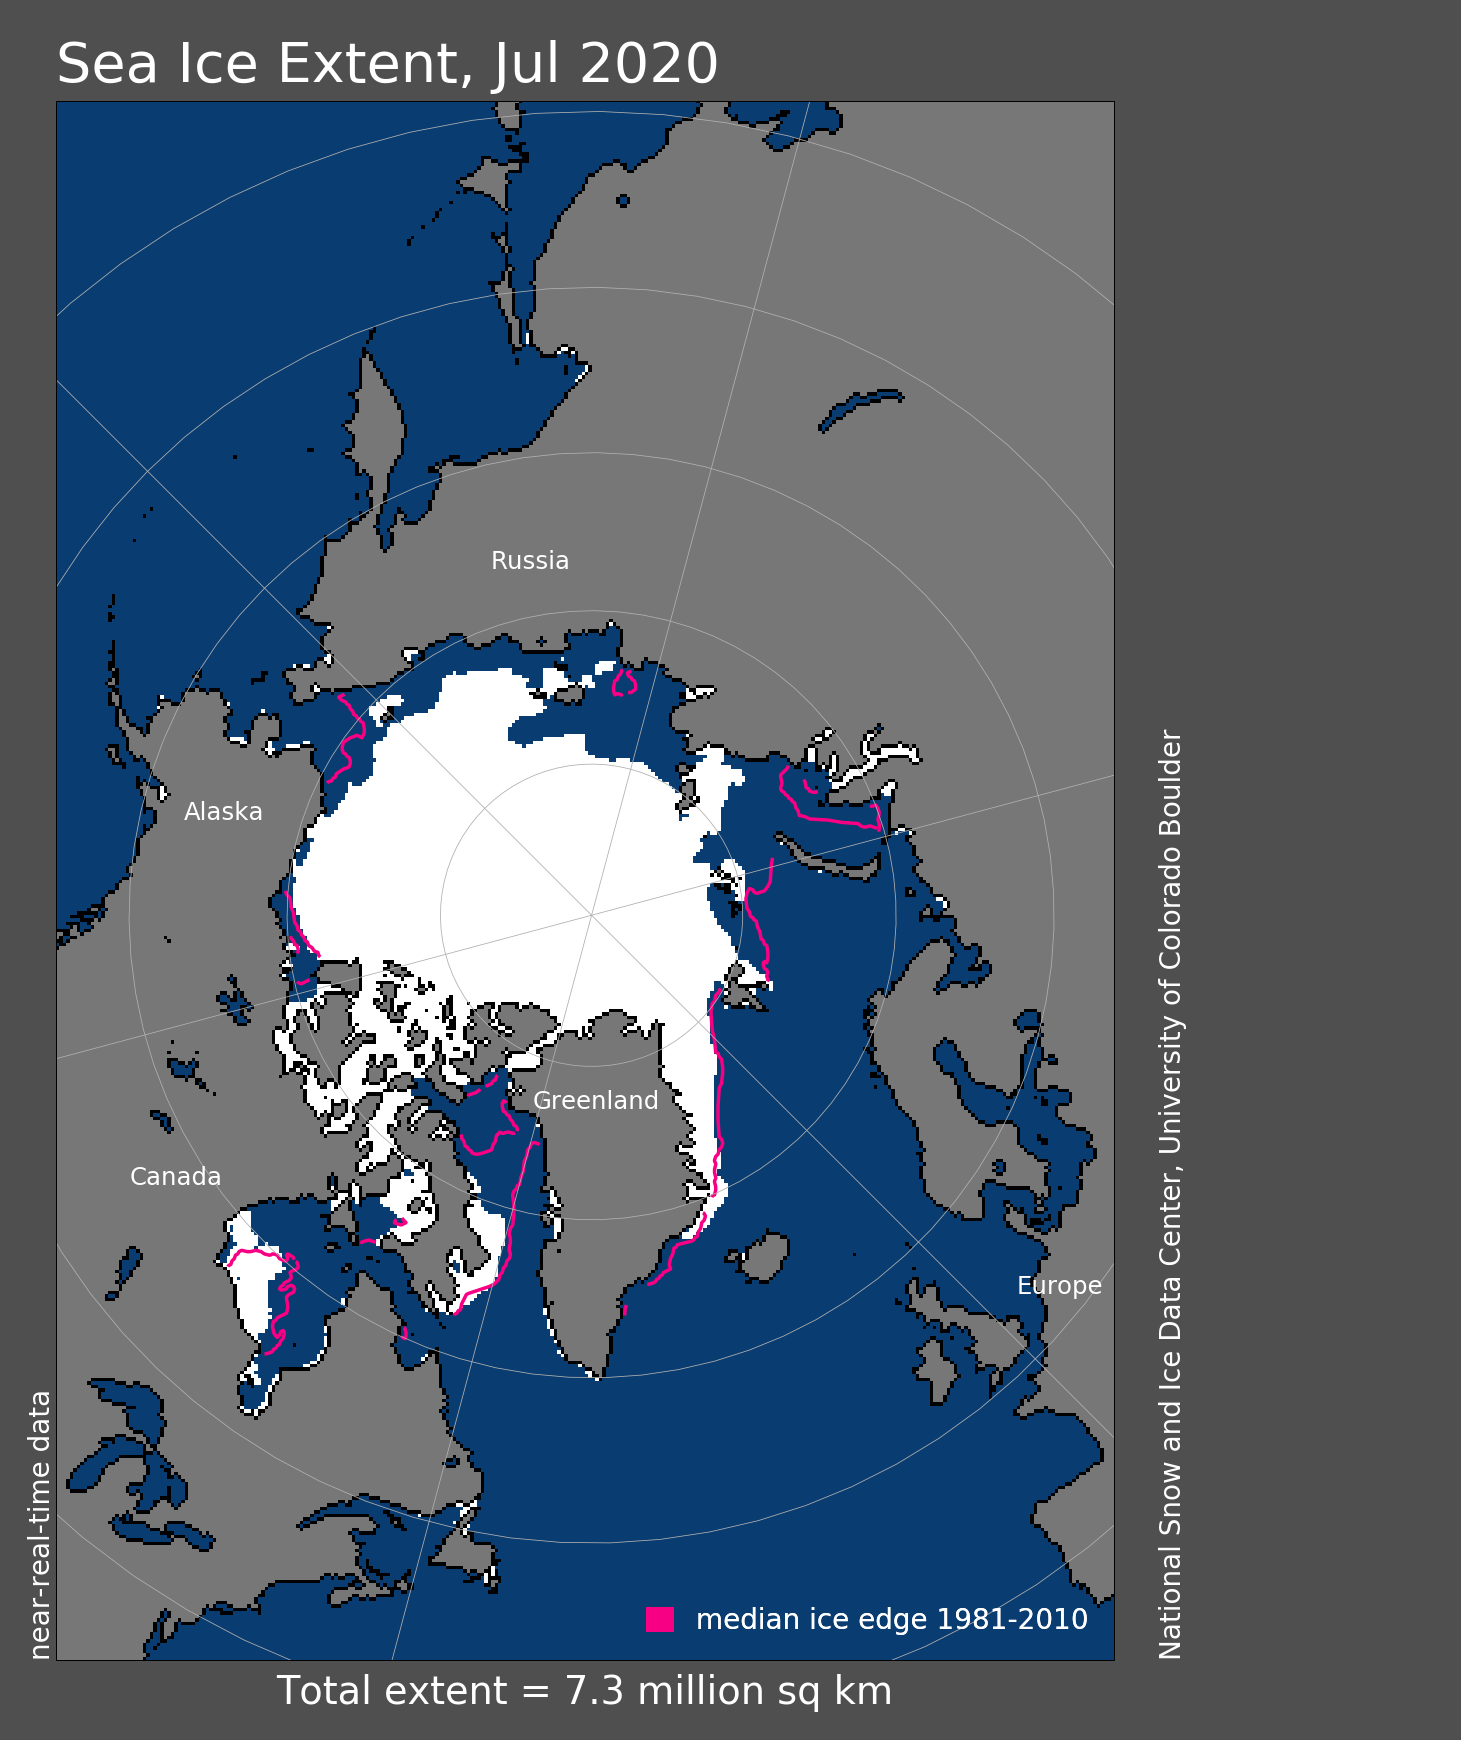
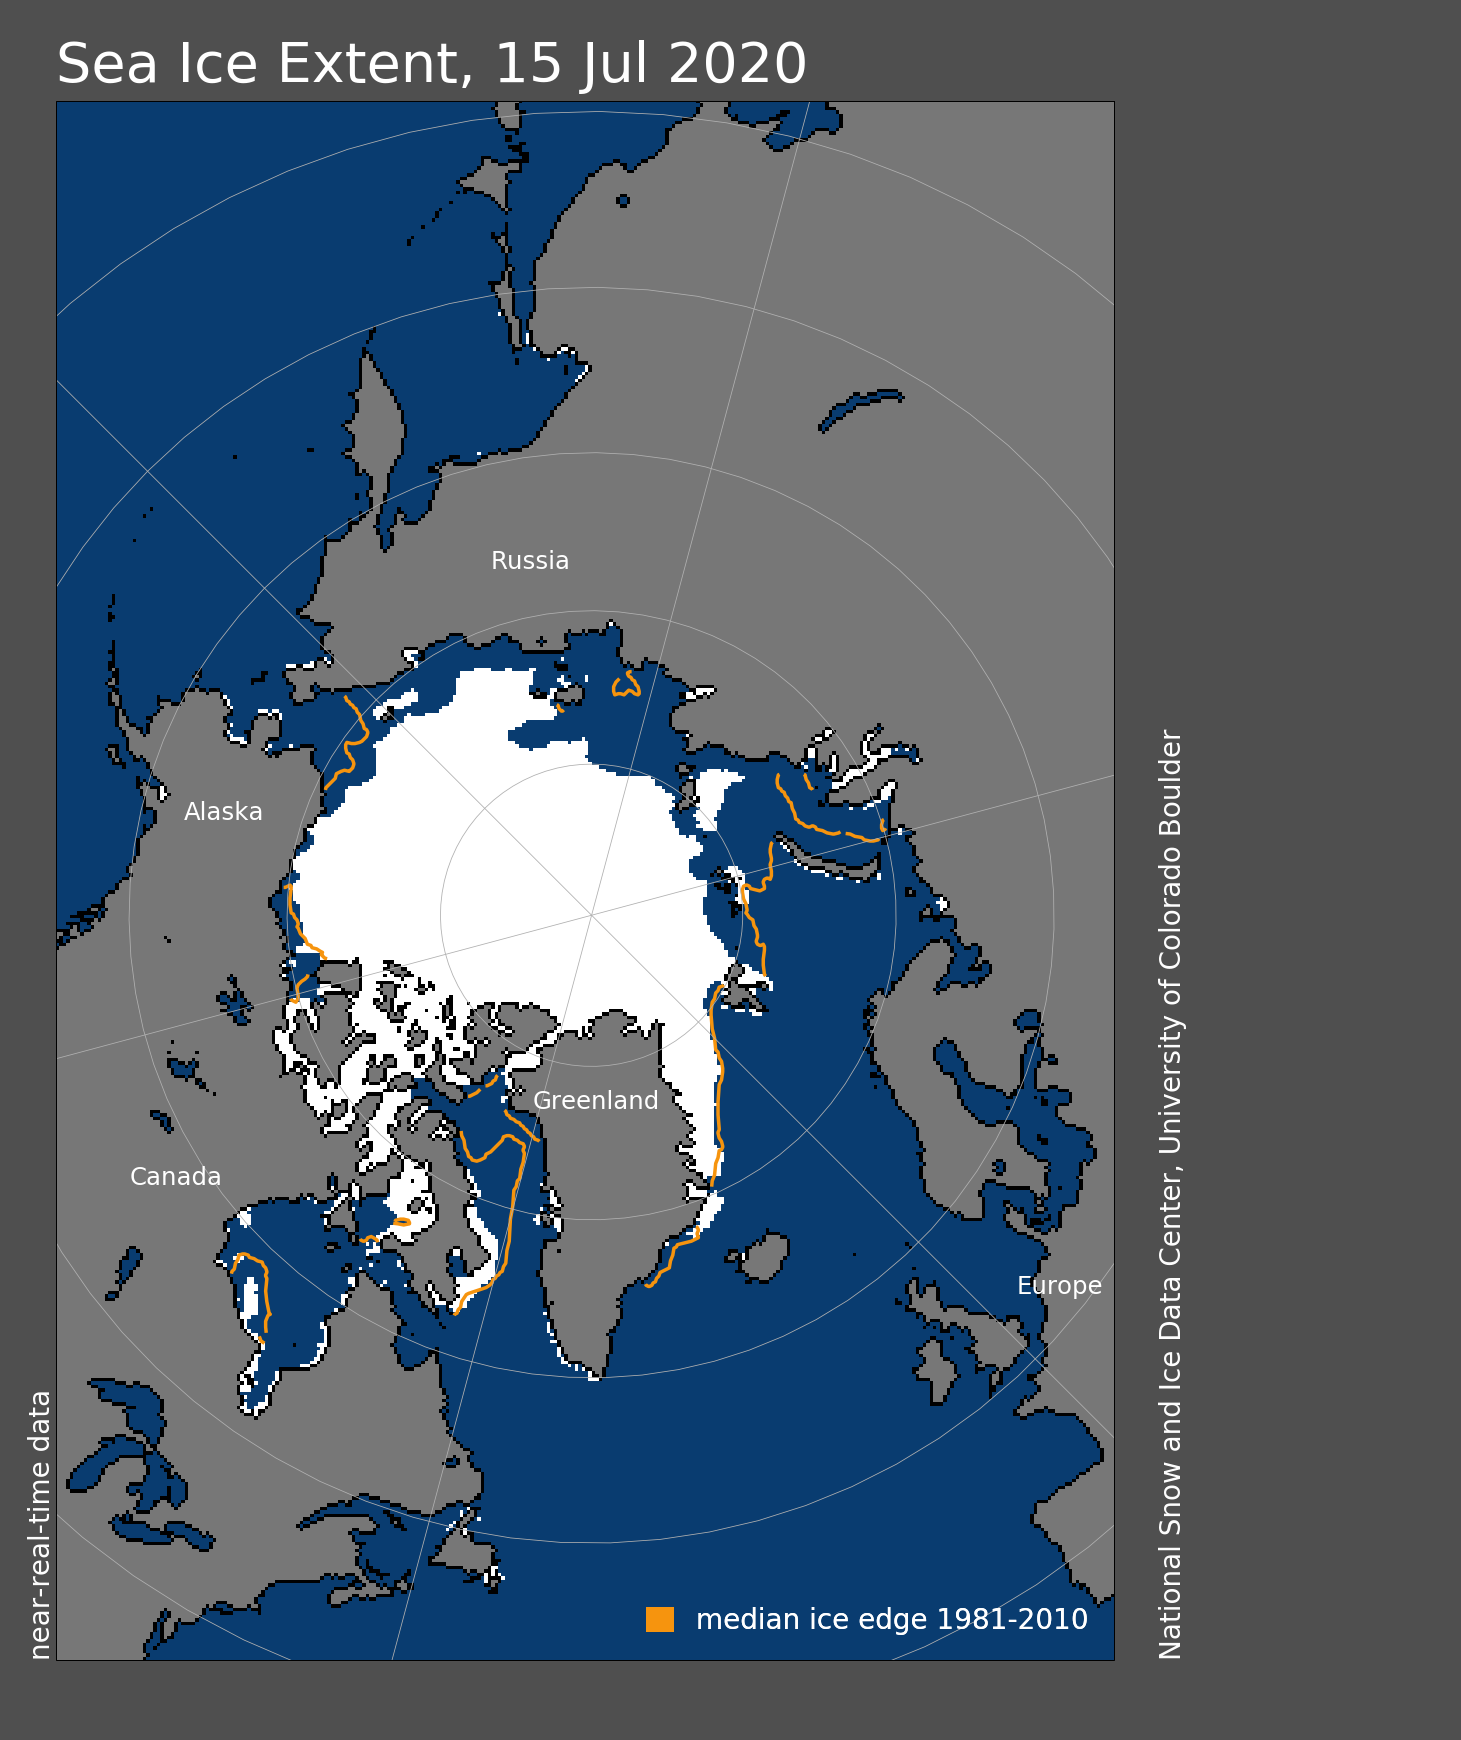
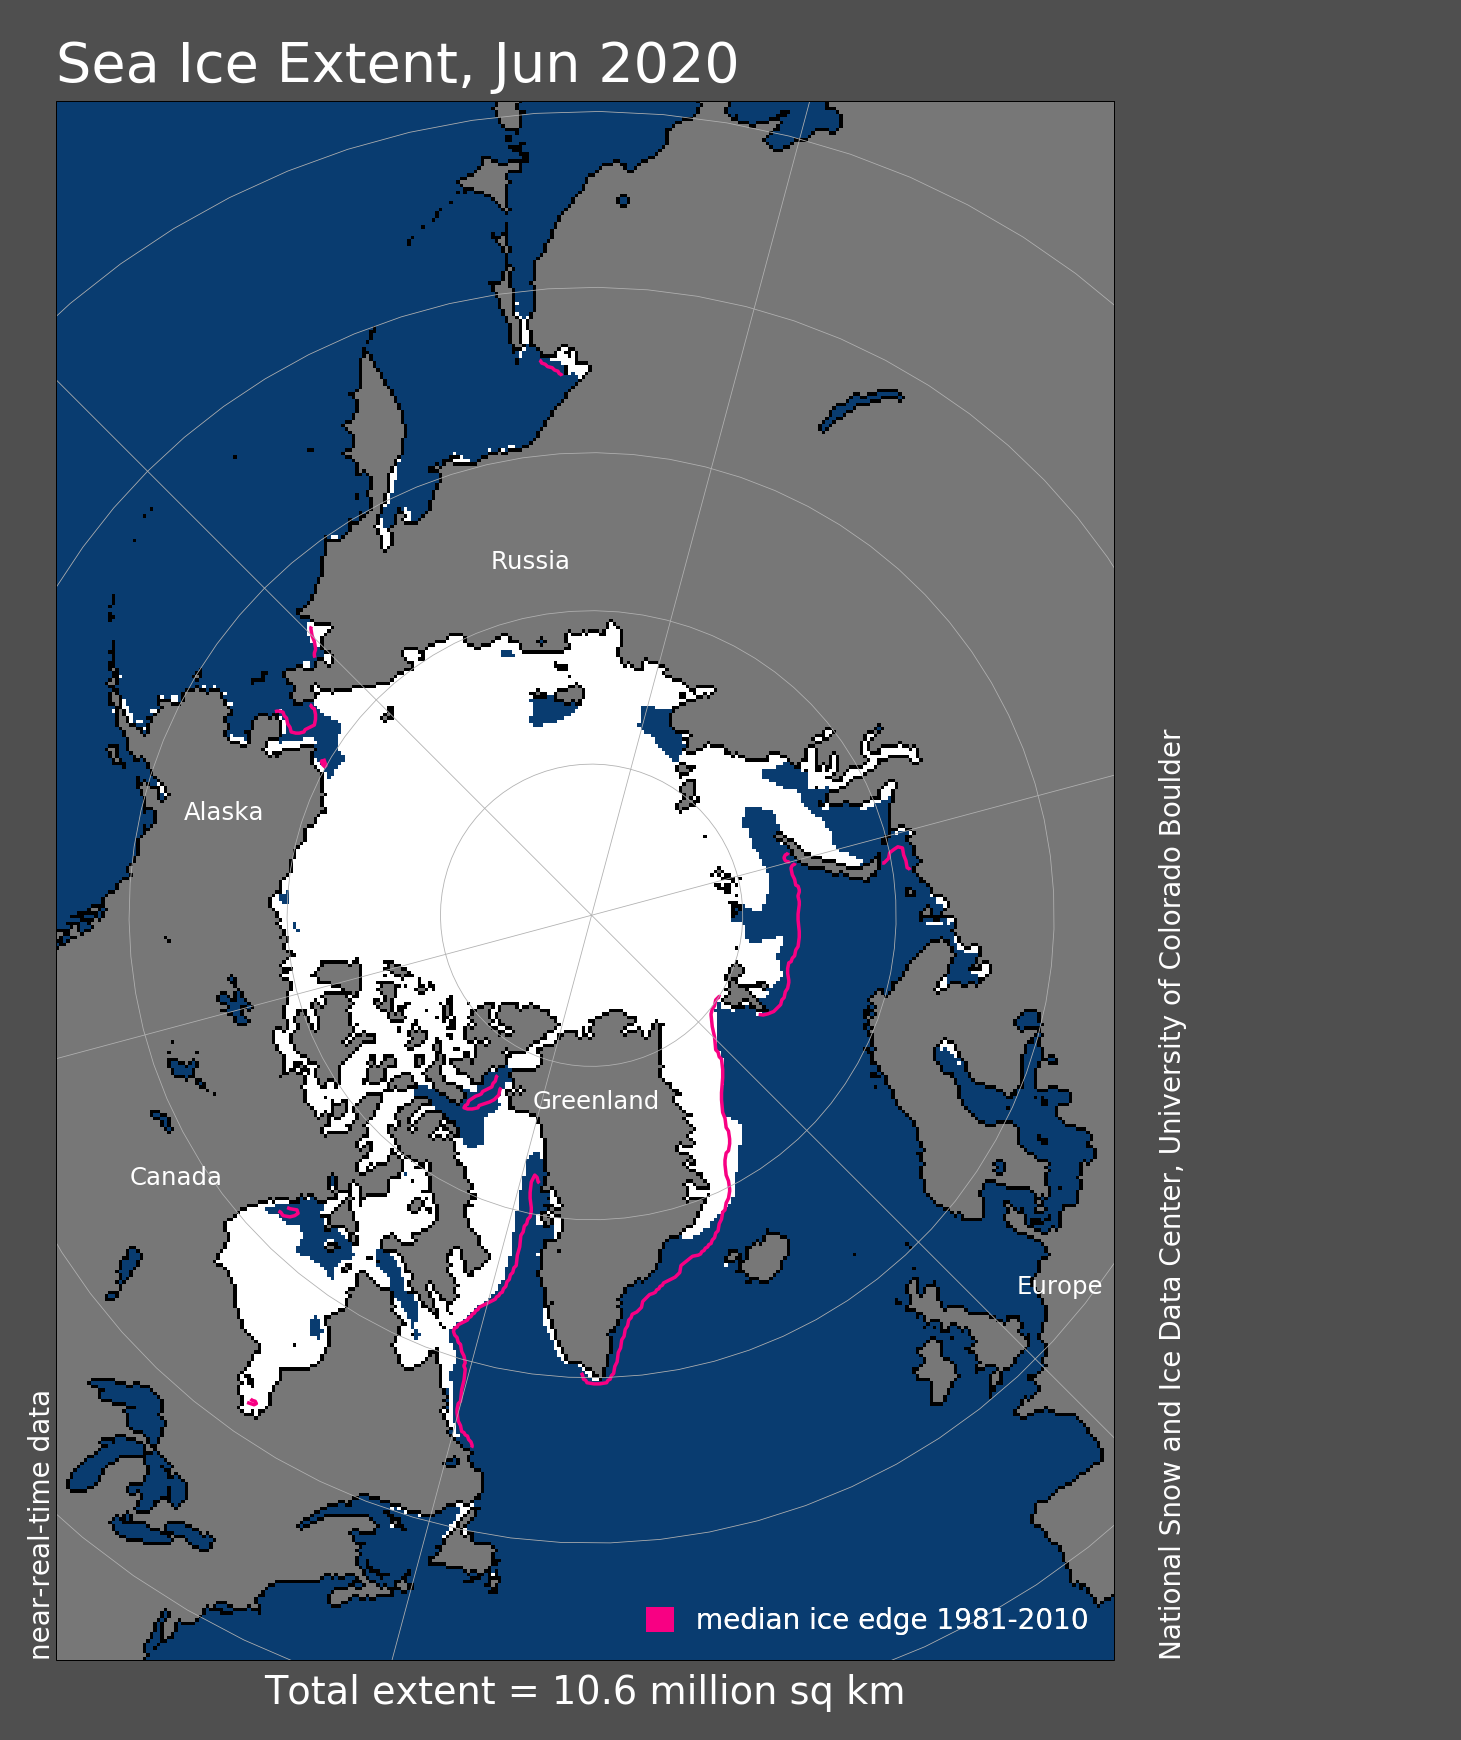
Figure 1. Arctic sea ice extent for November 2020 was 8.99 million square kilometers (3.47 million square miles). The magenta line shows the 1981 to 2010 average extent for that month. Sea Ice Index data. About the data
Credit: National Snow and Ice Data Center
High-resolution image
As reported in our previous post, sea ice extent averaged for October 2020 was the lowest in the satellite record. While extent increased through November as part of the annual cycle of autumn and winter growth, the November average extent of 8.99 million square kilometers (3.47 million square miles), ended up as second lowest in the satellite record for the month, just above 2016. This was 1.71 million square kilometers (660,000 square miles) below the 1981 to 2010 average and 330,000 square kilometers (127,000 square miles) above the record low of November 2016. Entering December, extent remains especially low over both the Barents and Kara Seas on the Atlantic side and the Chukchi Sea on the Pacific side of the Arctic Ocean.
Conditions in context
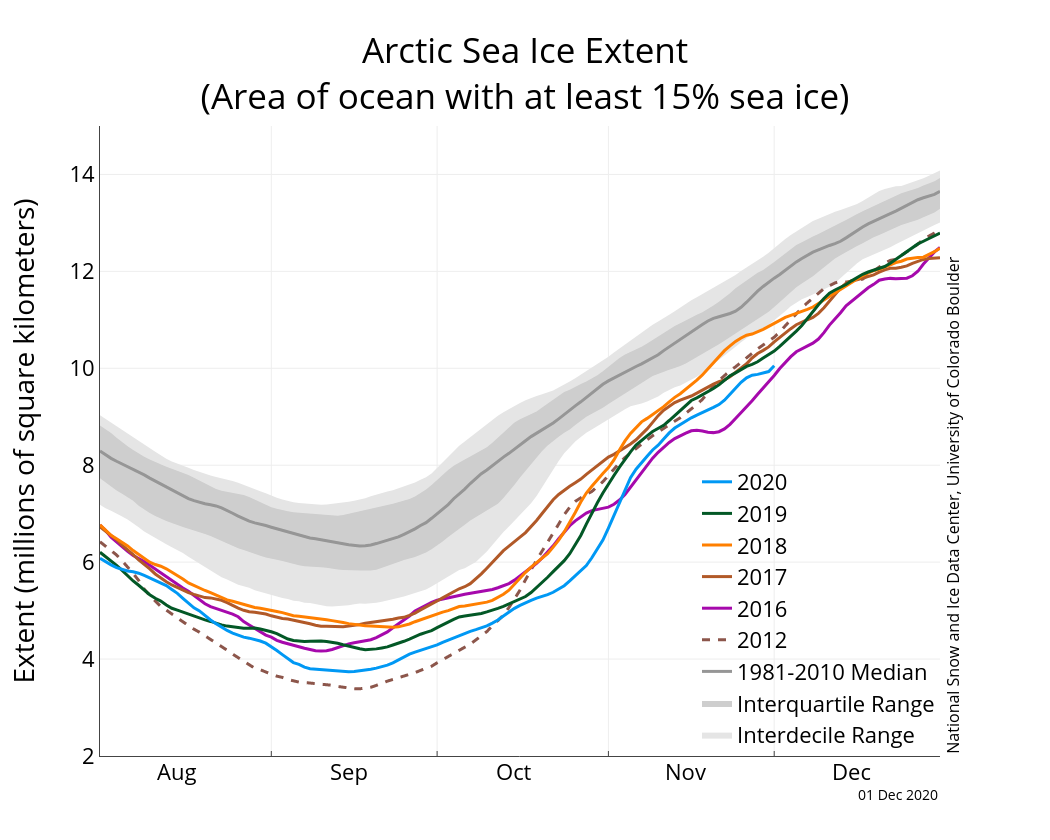
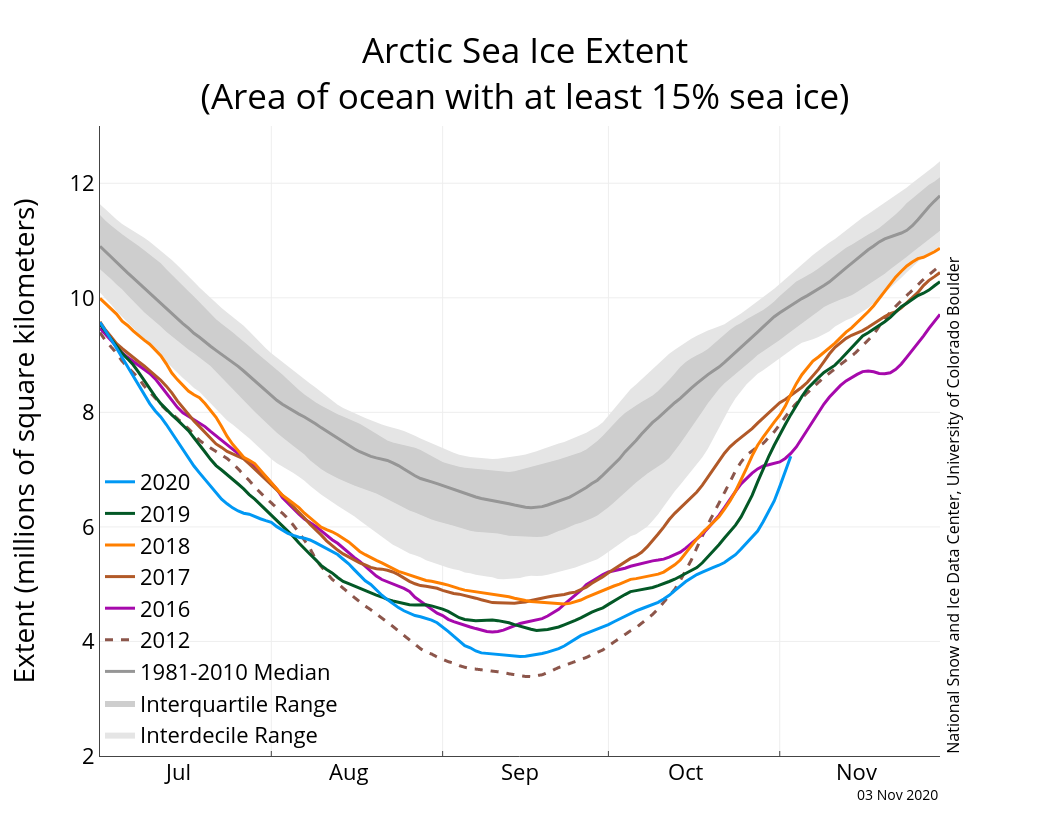
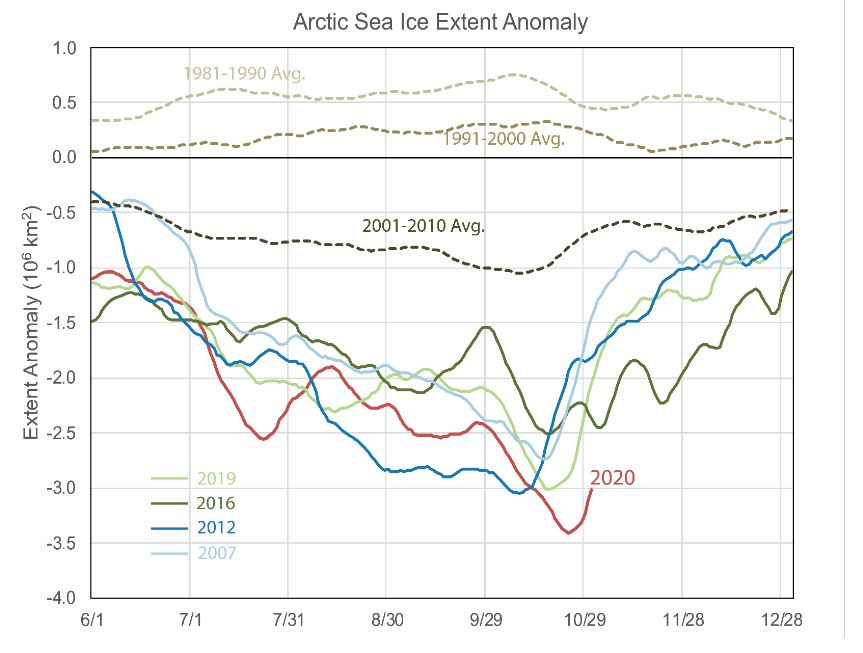
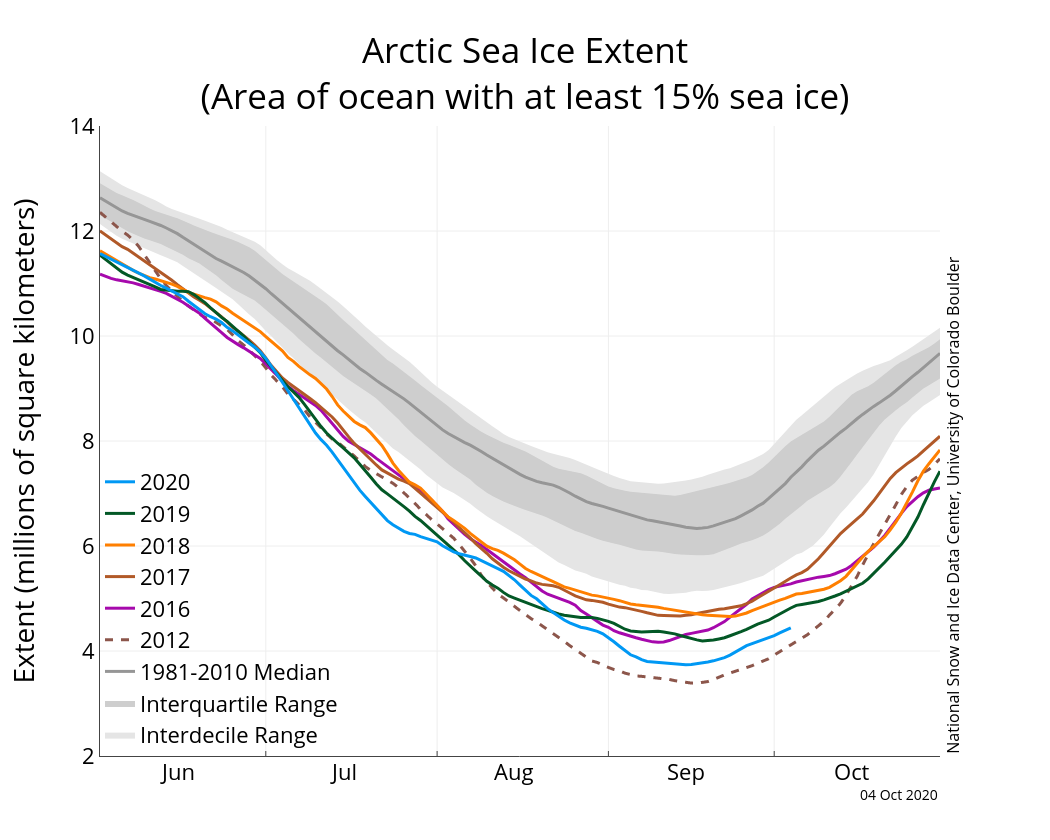
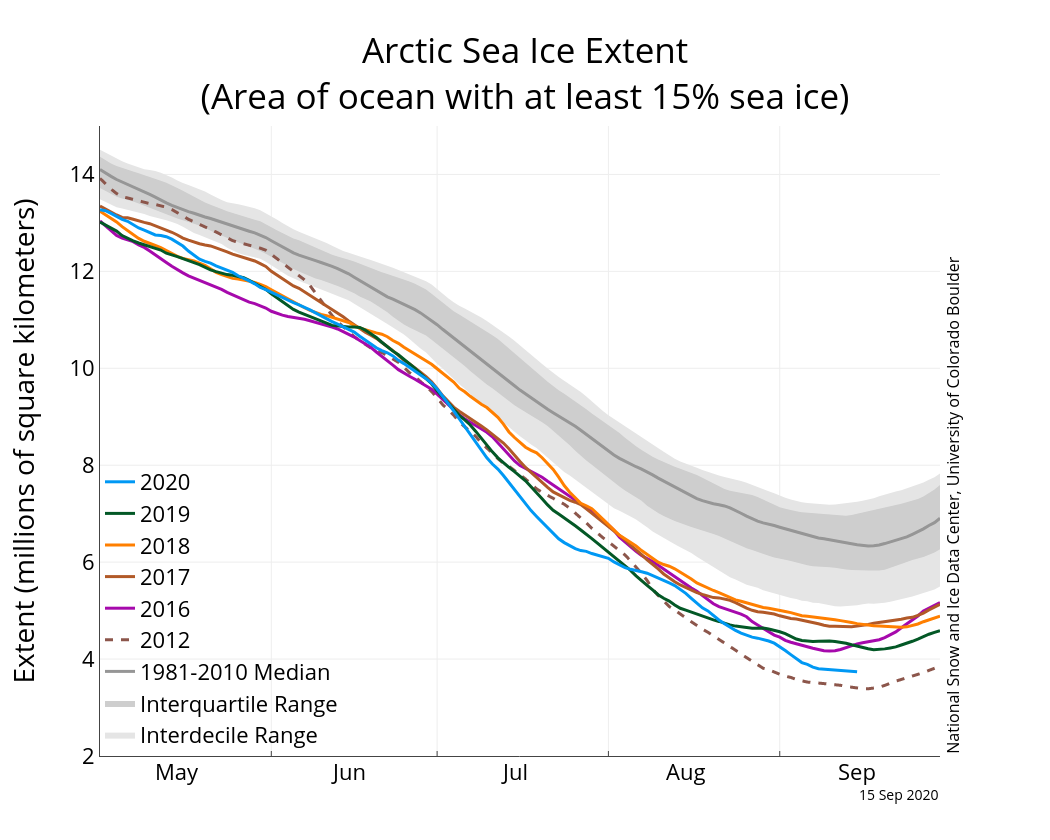
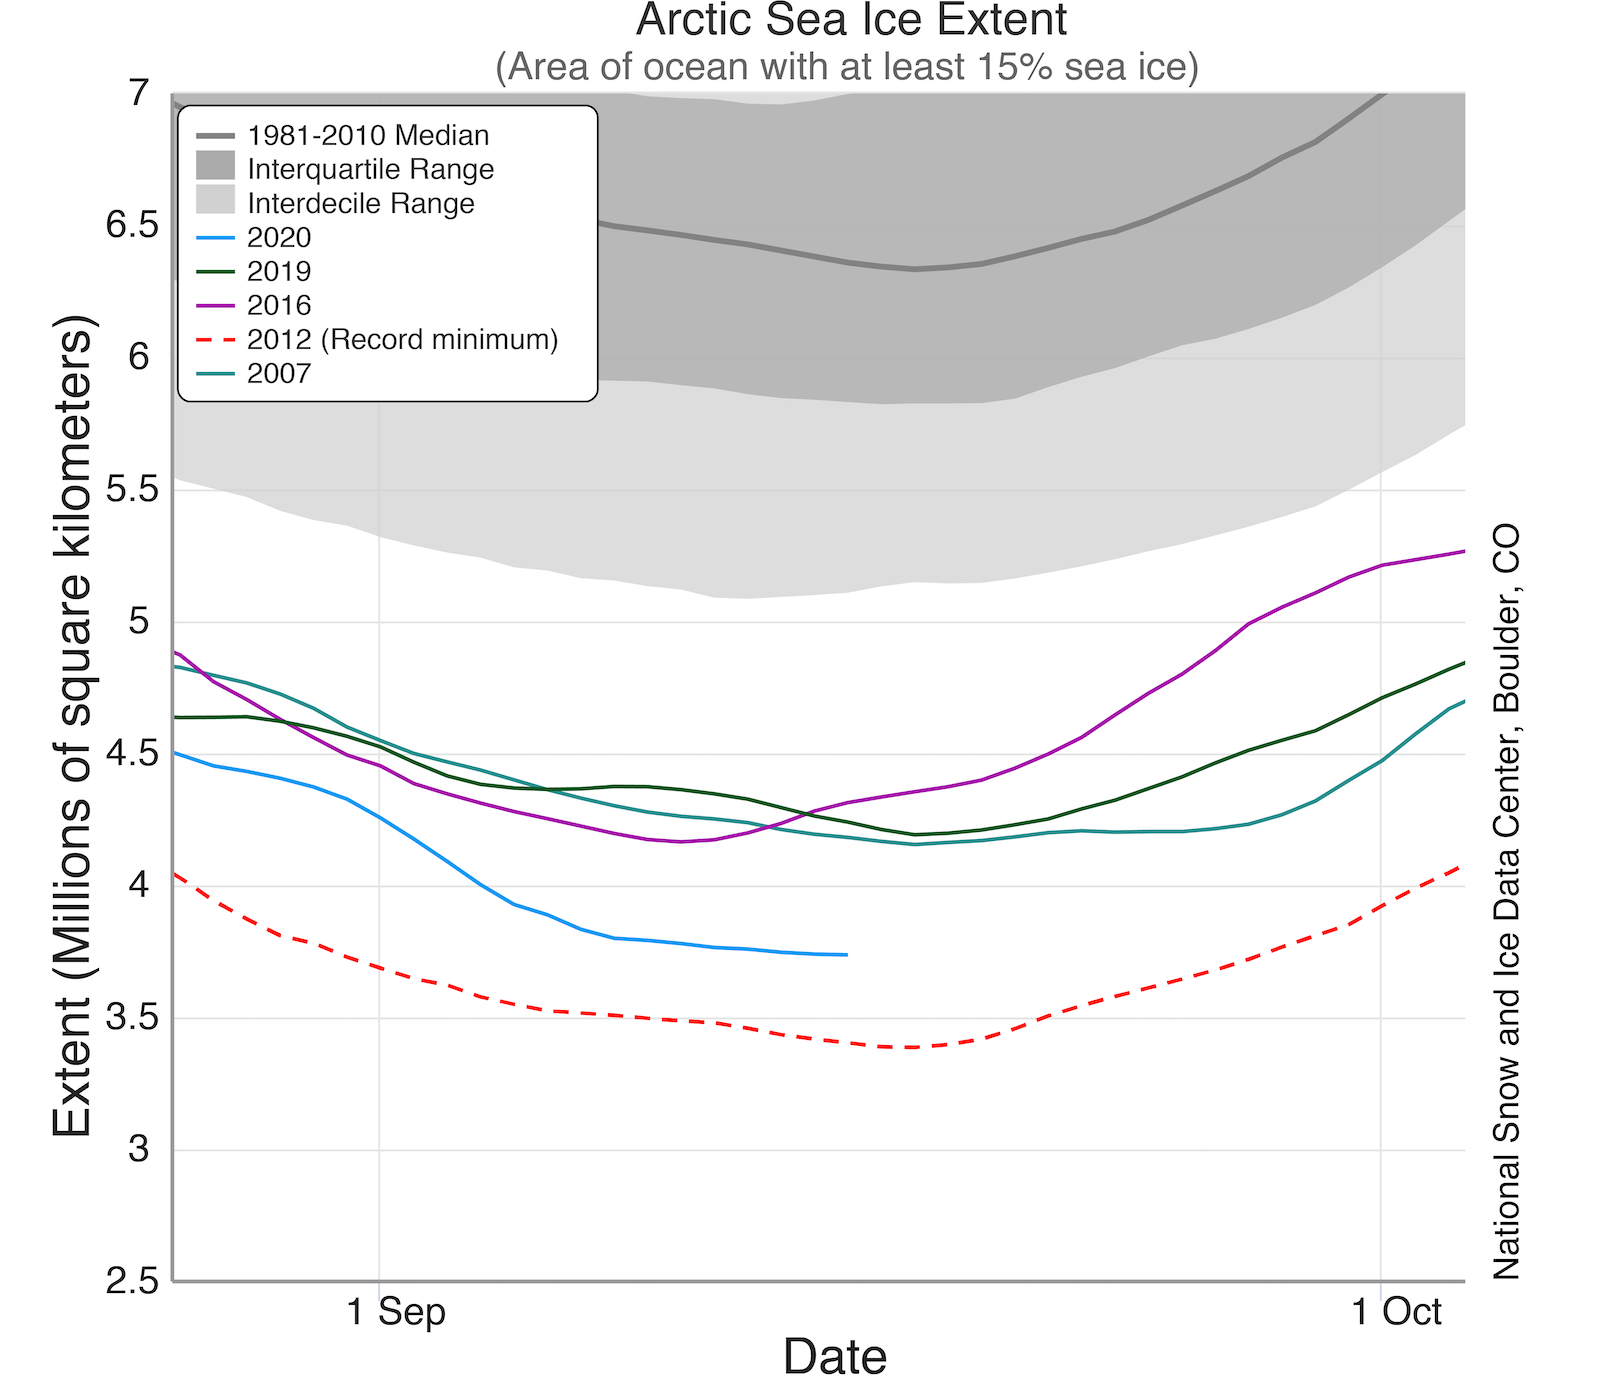
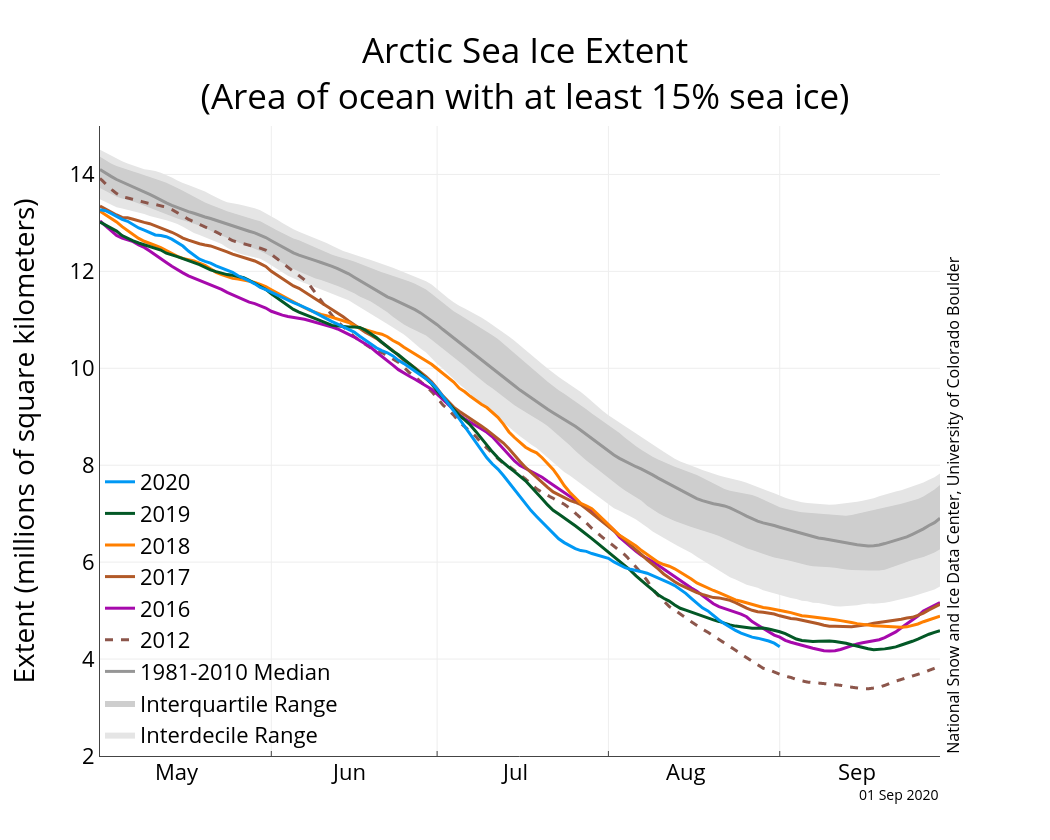
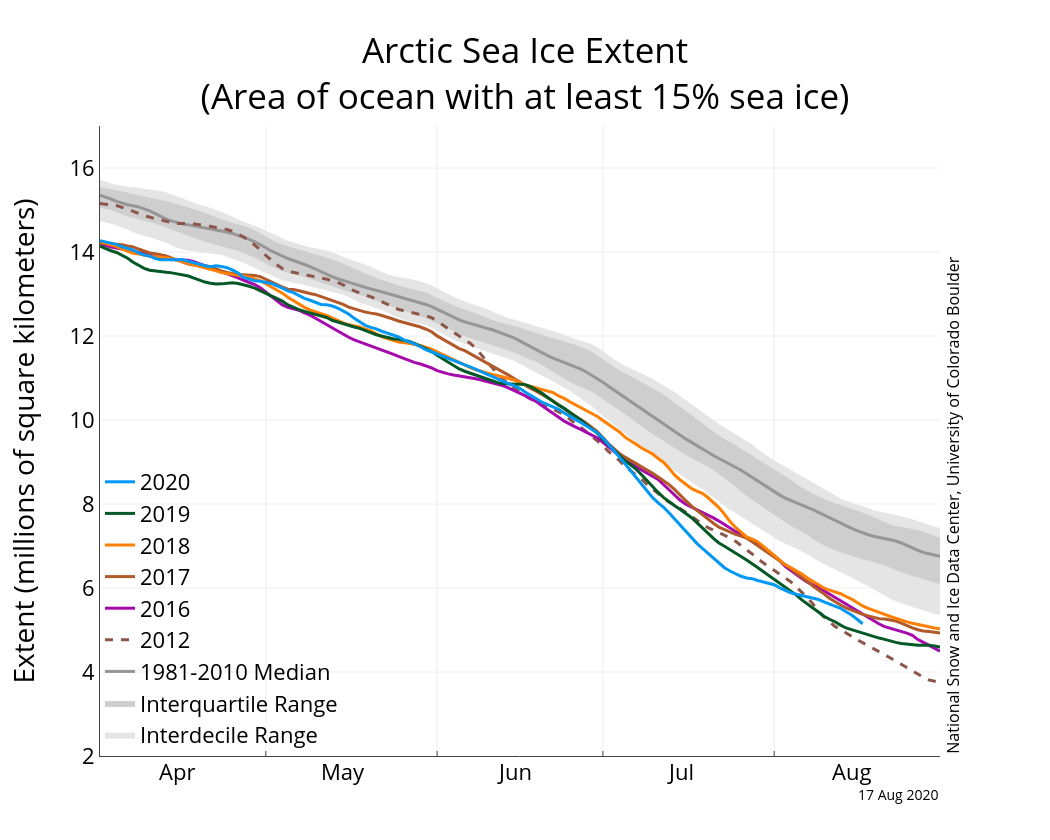
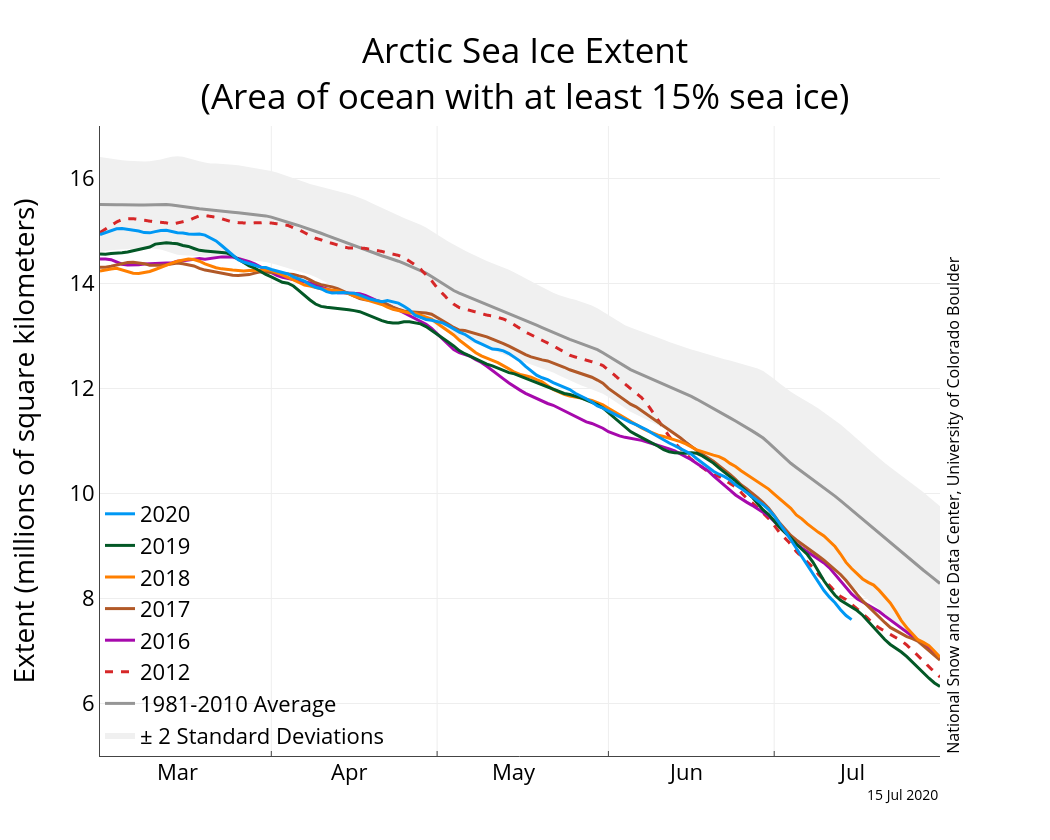
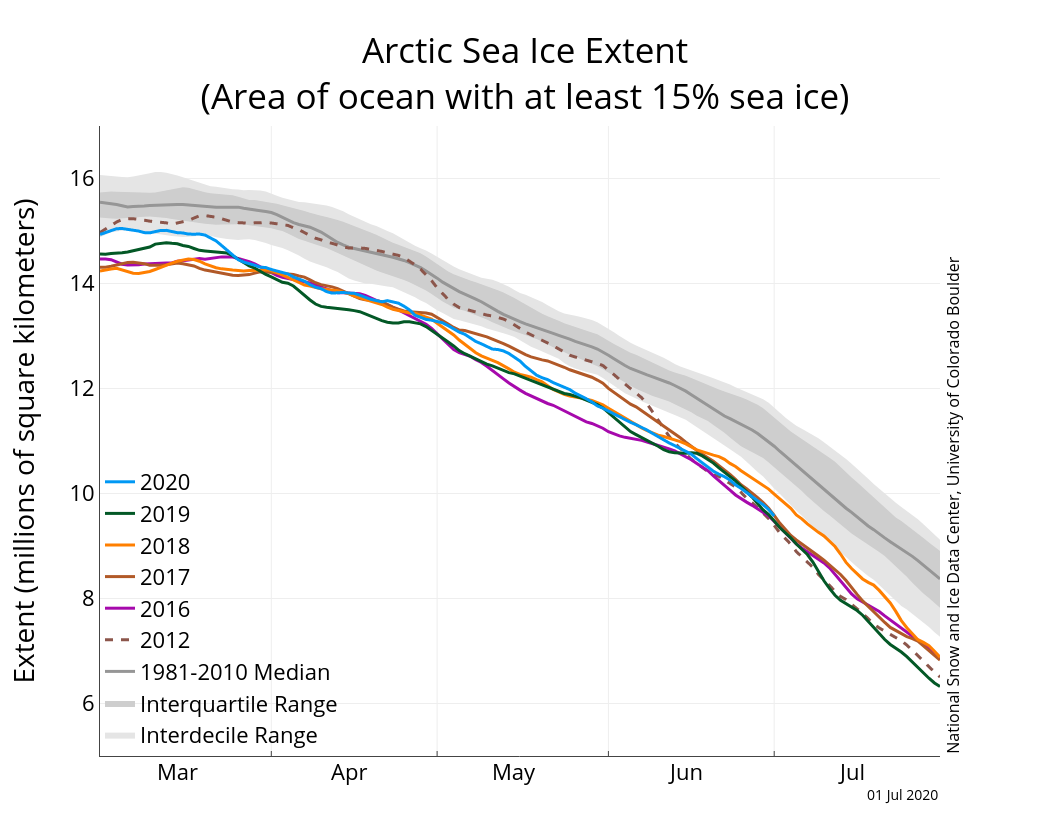
Figure 2a. The graph above shows Arctic sea ice extent as of December 1, 2020, along with daily ice extent data for five previous years and the record low year. 2020 is shown in blue, 2019 in green, 2018 in orange, 2017 in brown, 2016 in magenta, and 2012 in dashed brown. The 1981 to 2010 median is in dark gray. The gray areas around the median line show the interquartile and interdecile ranges of the data. Sea Ice Index data.
Credit: National Snow and Ice Data Center
High-resolution image
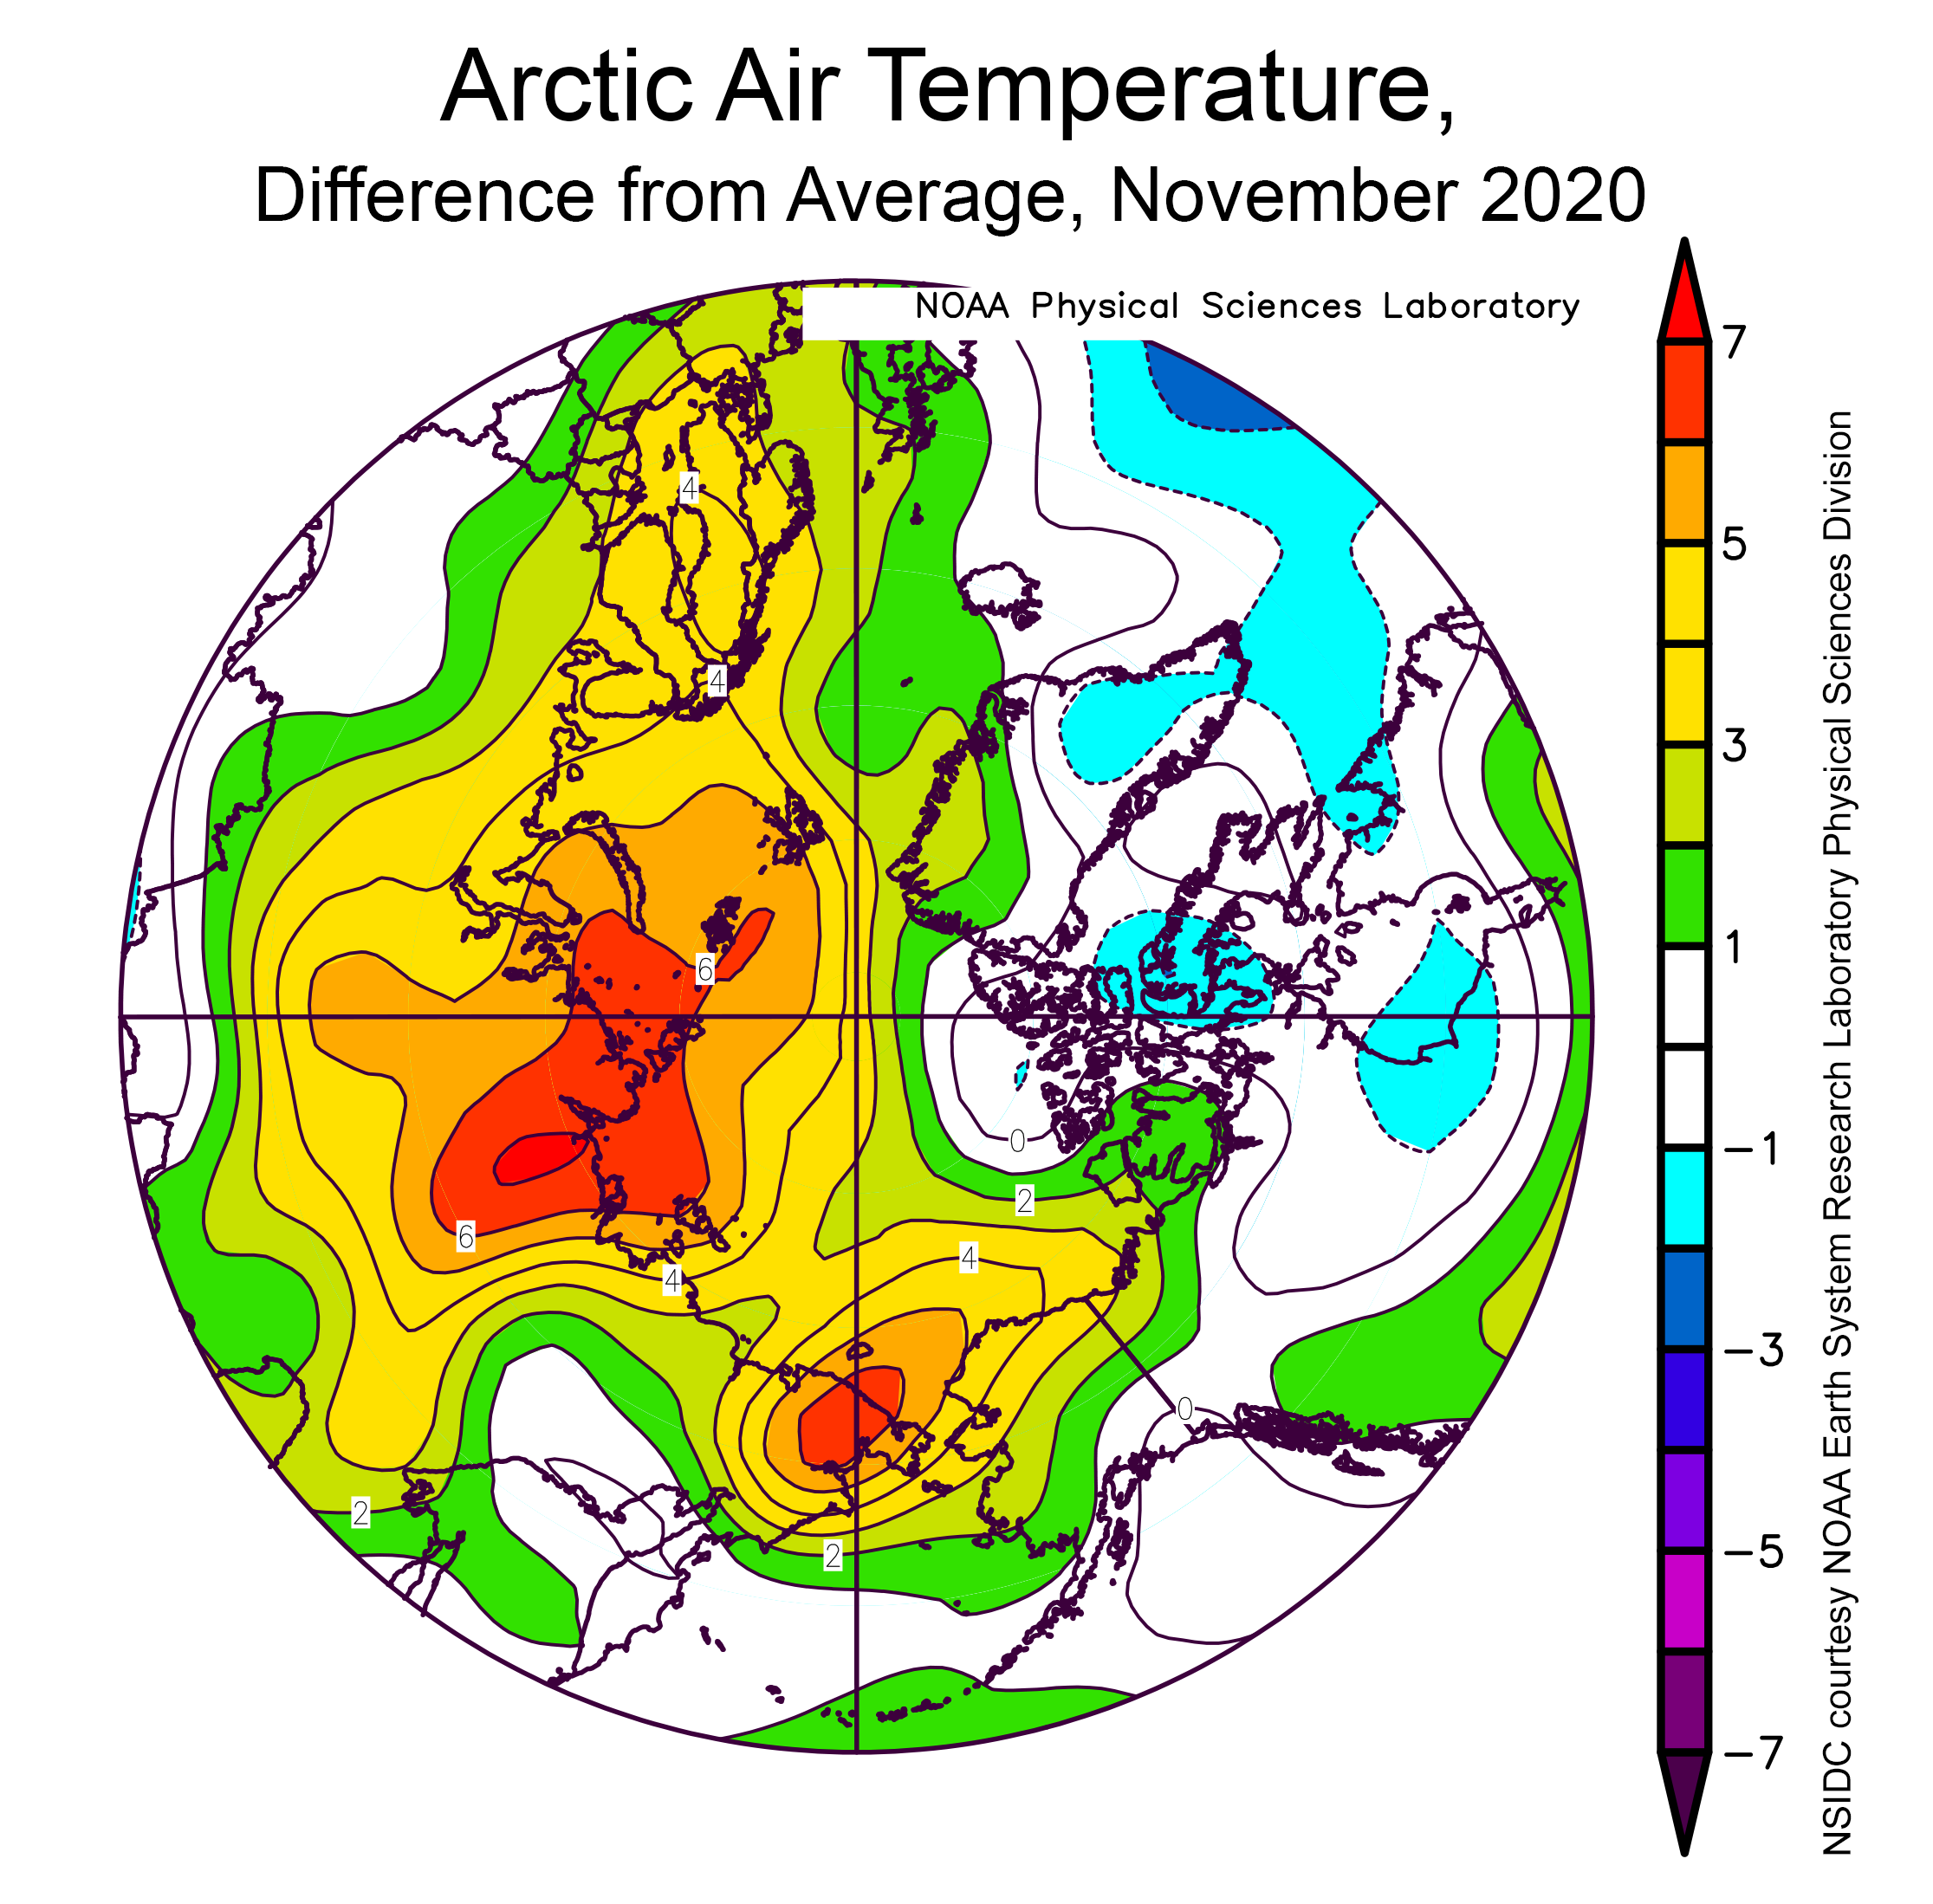
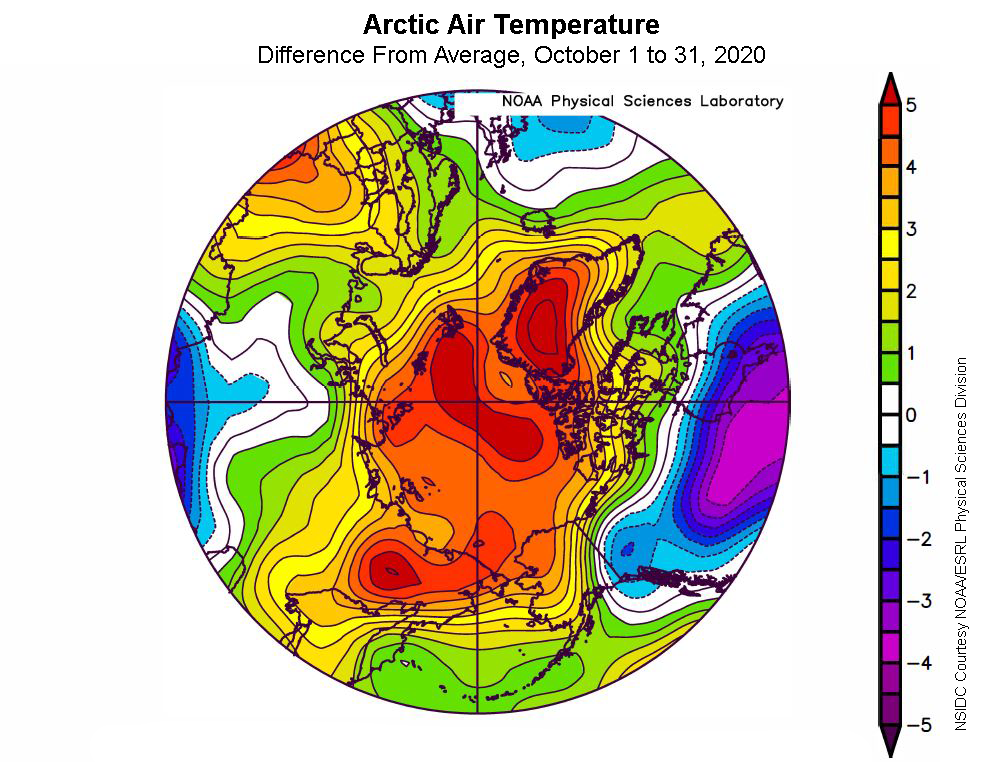
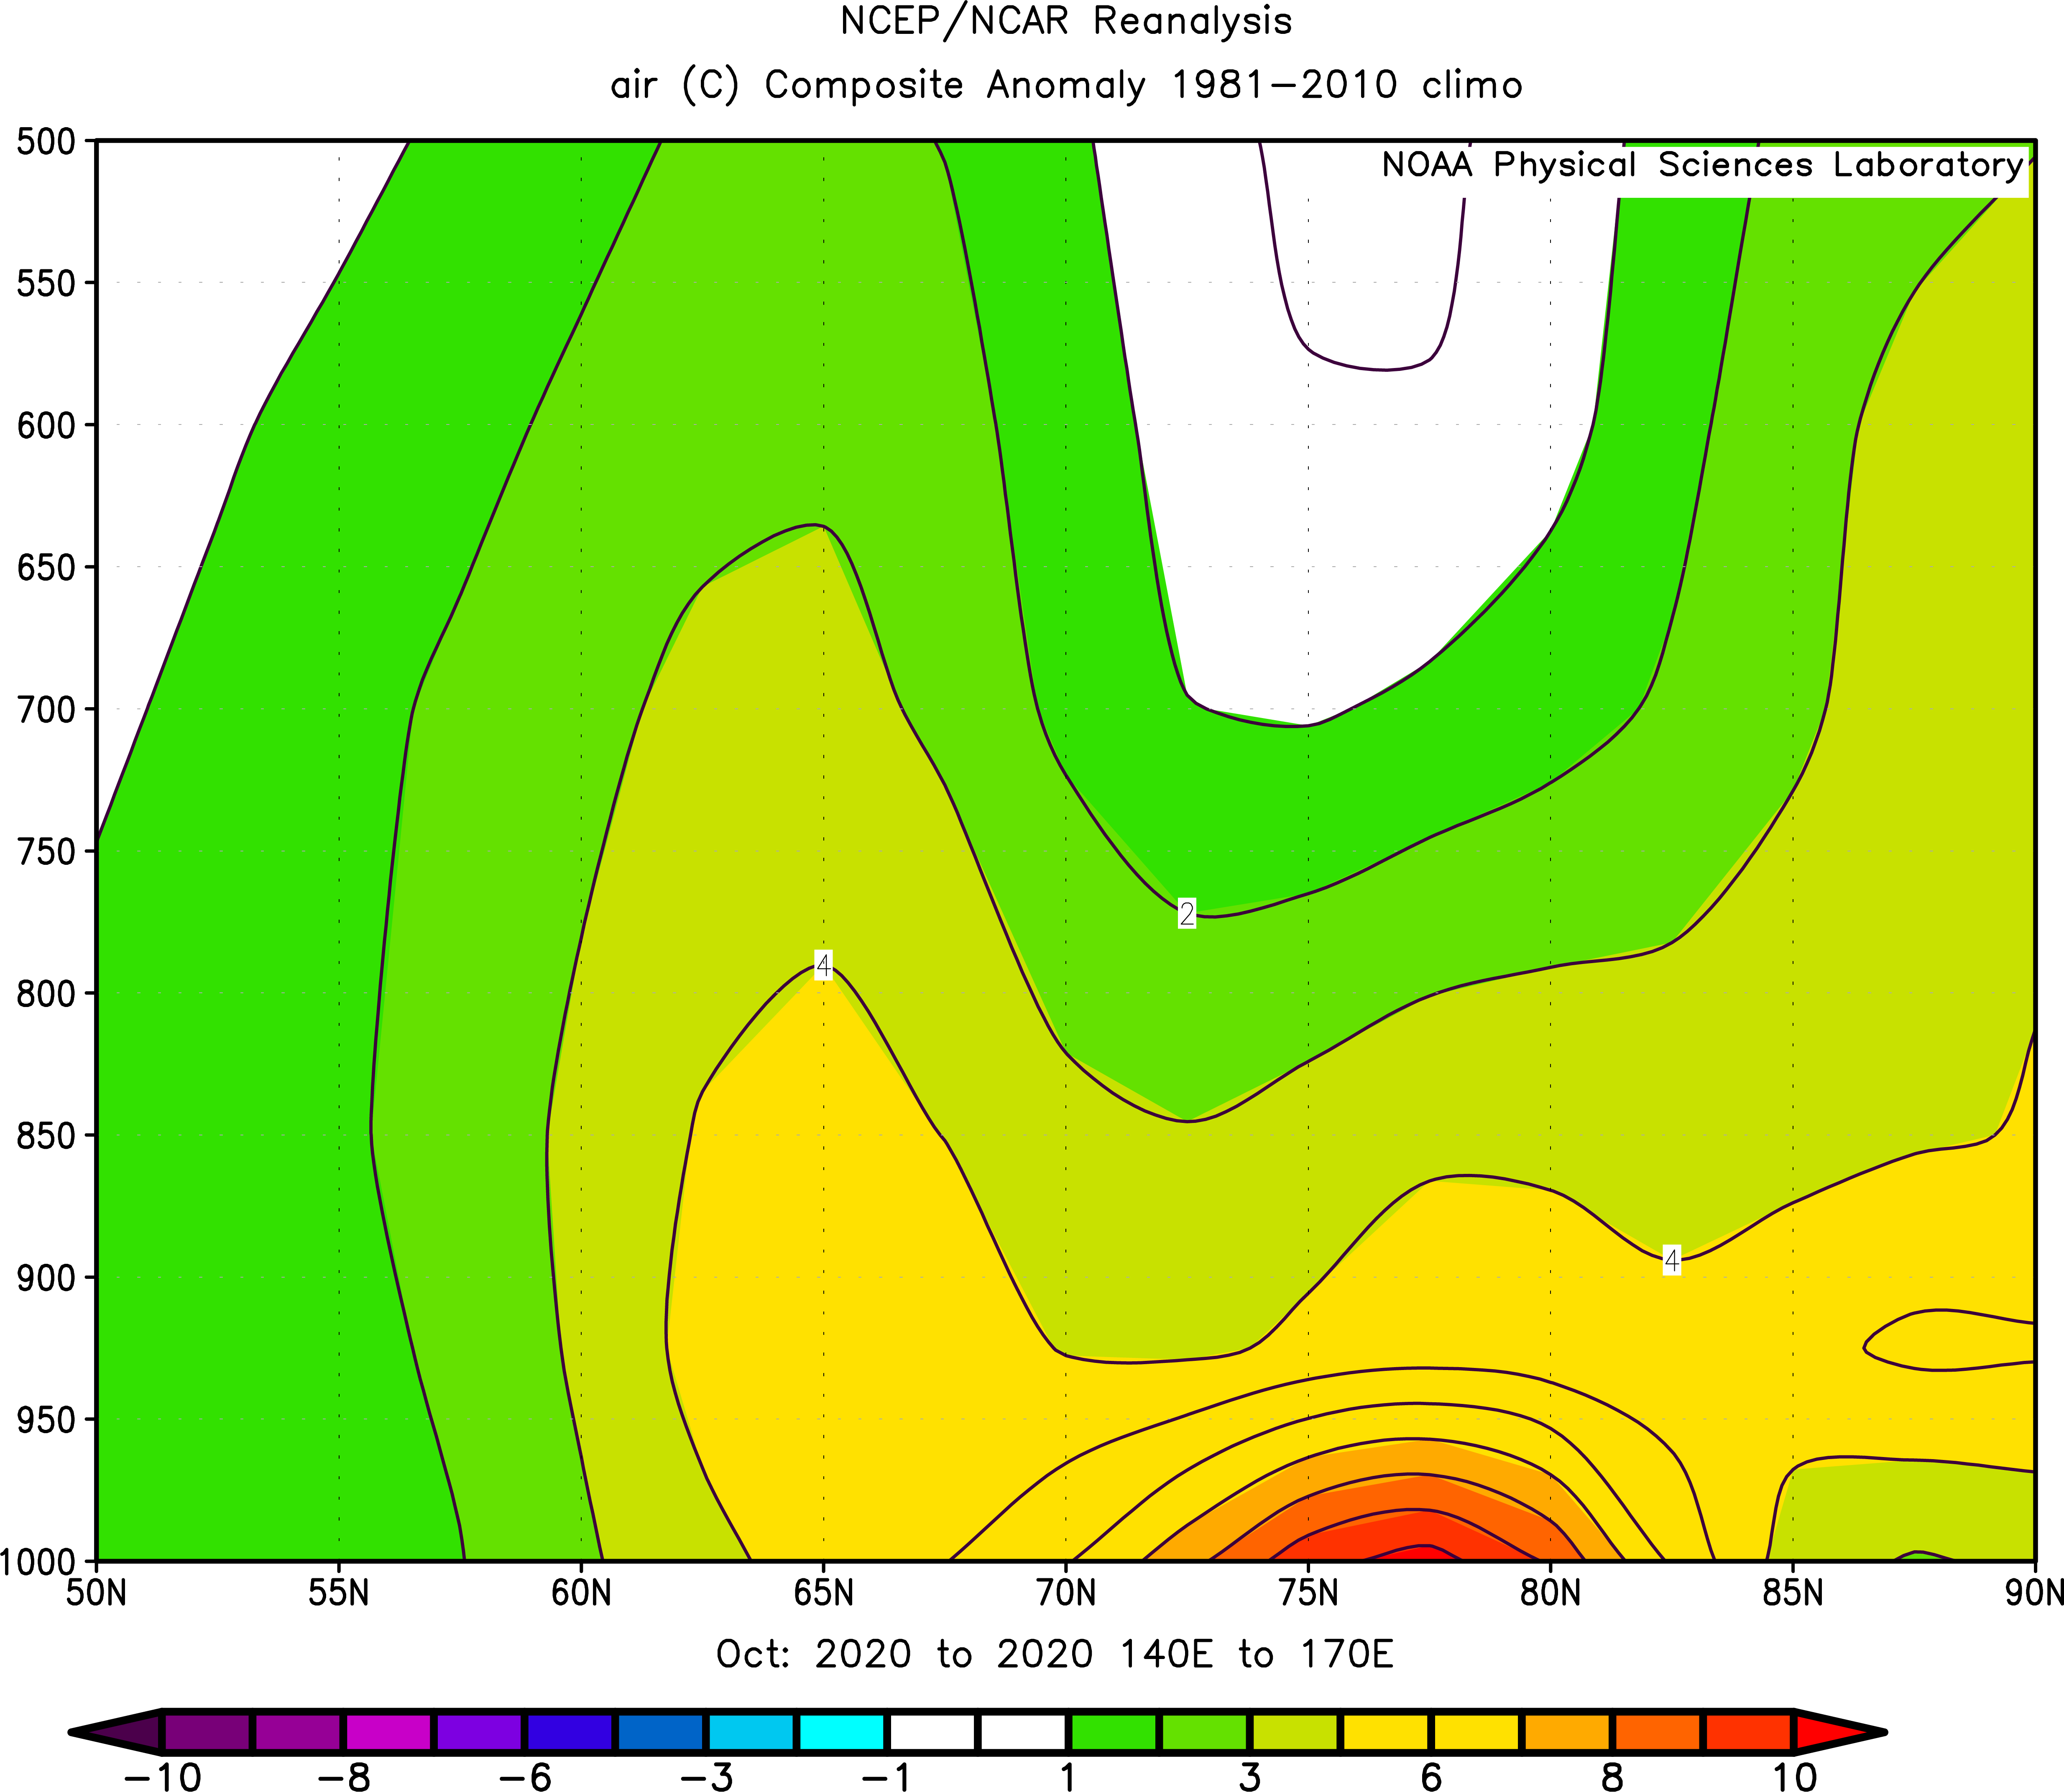
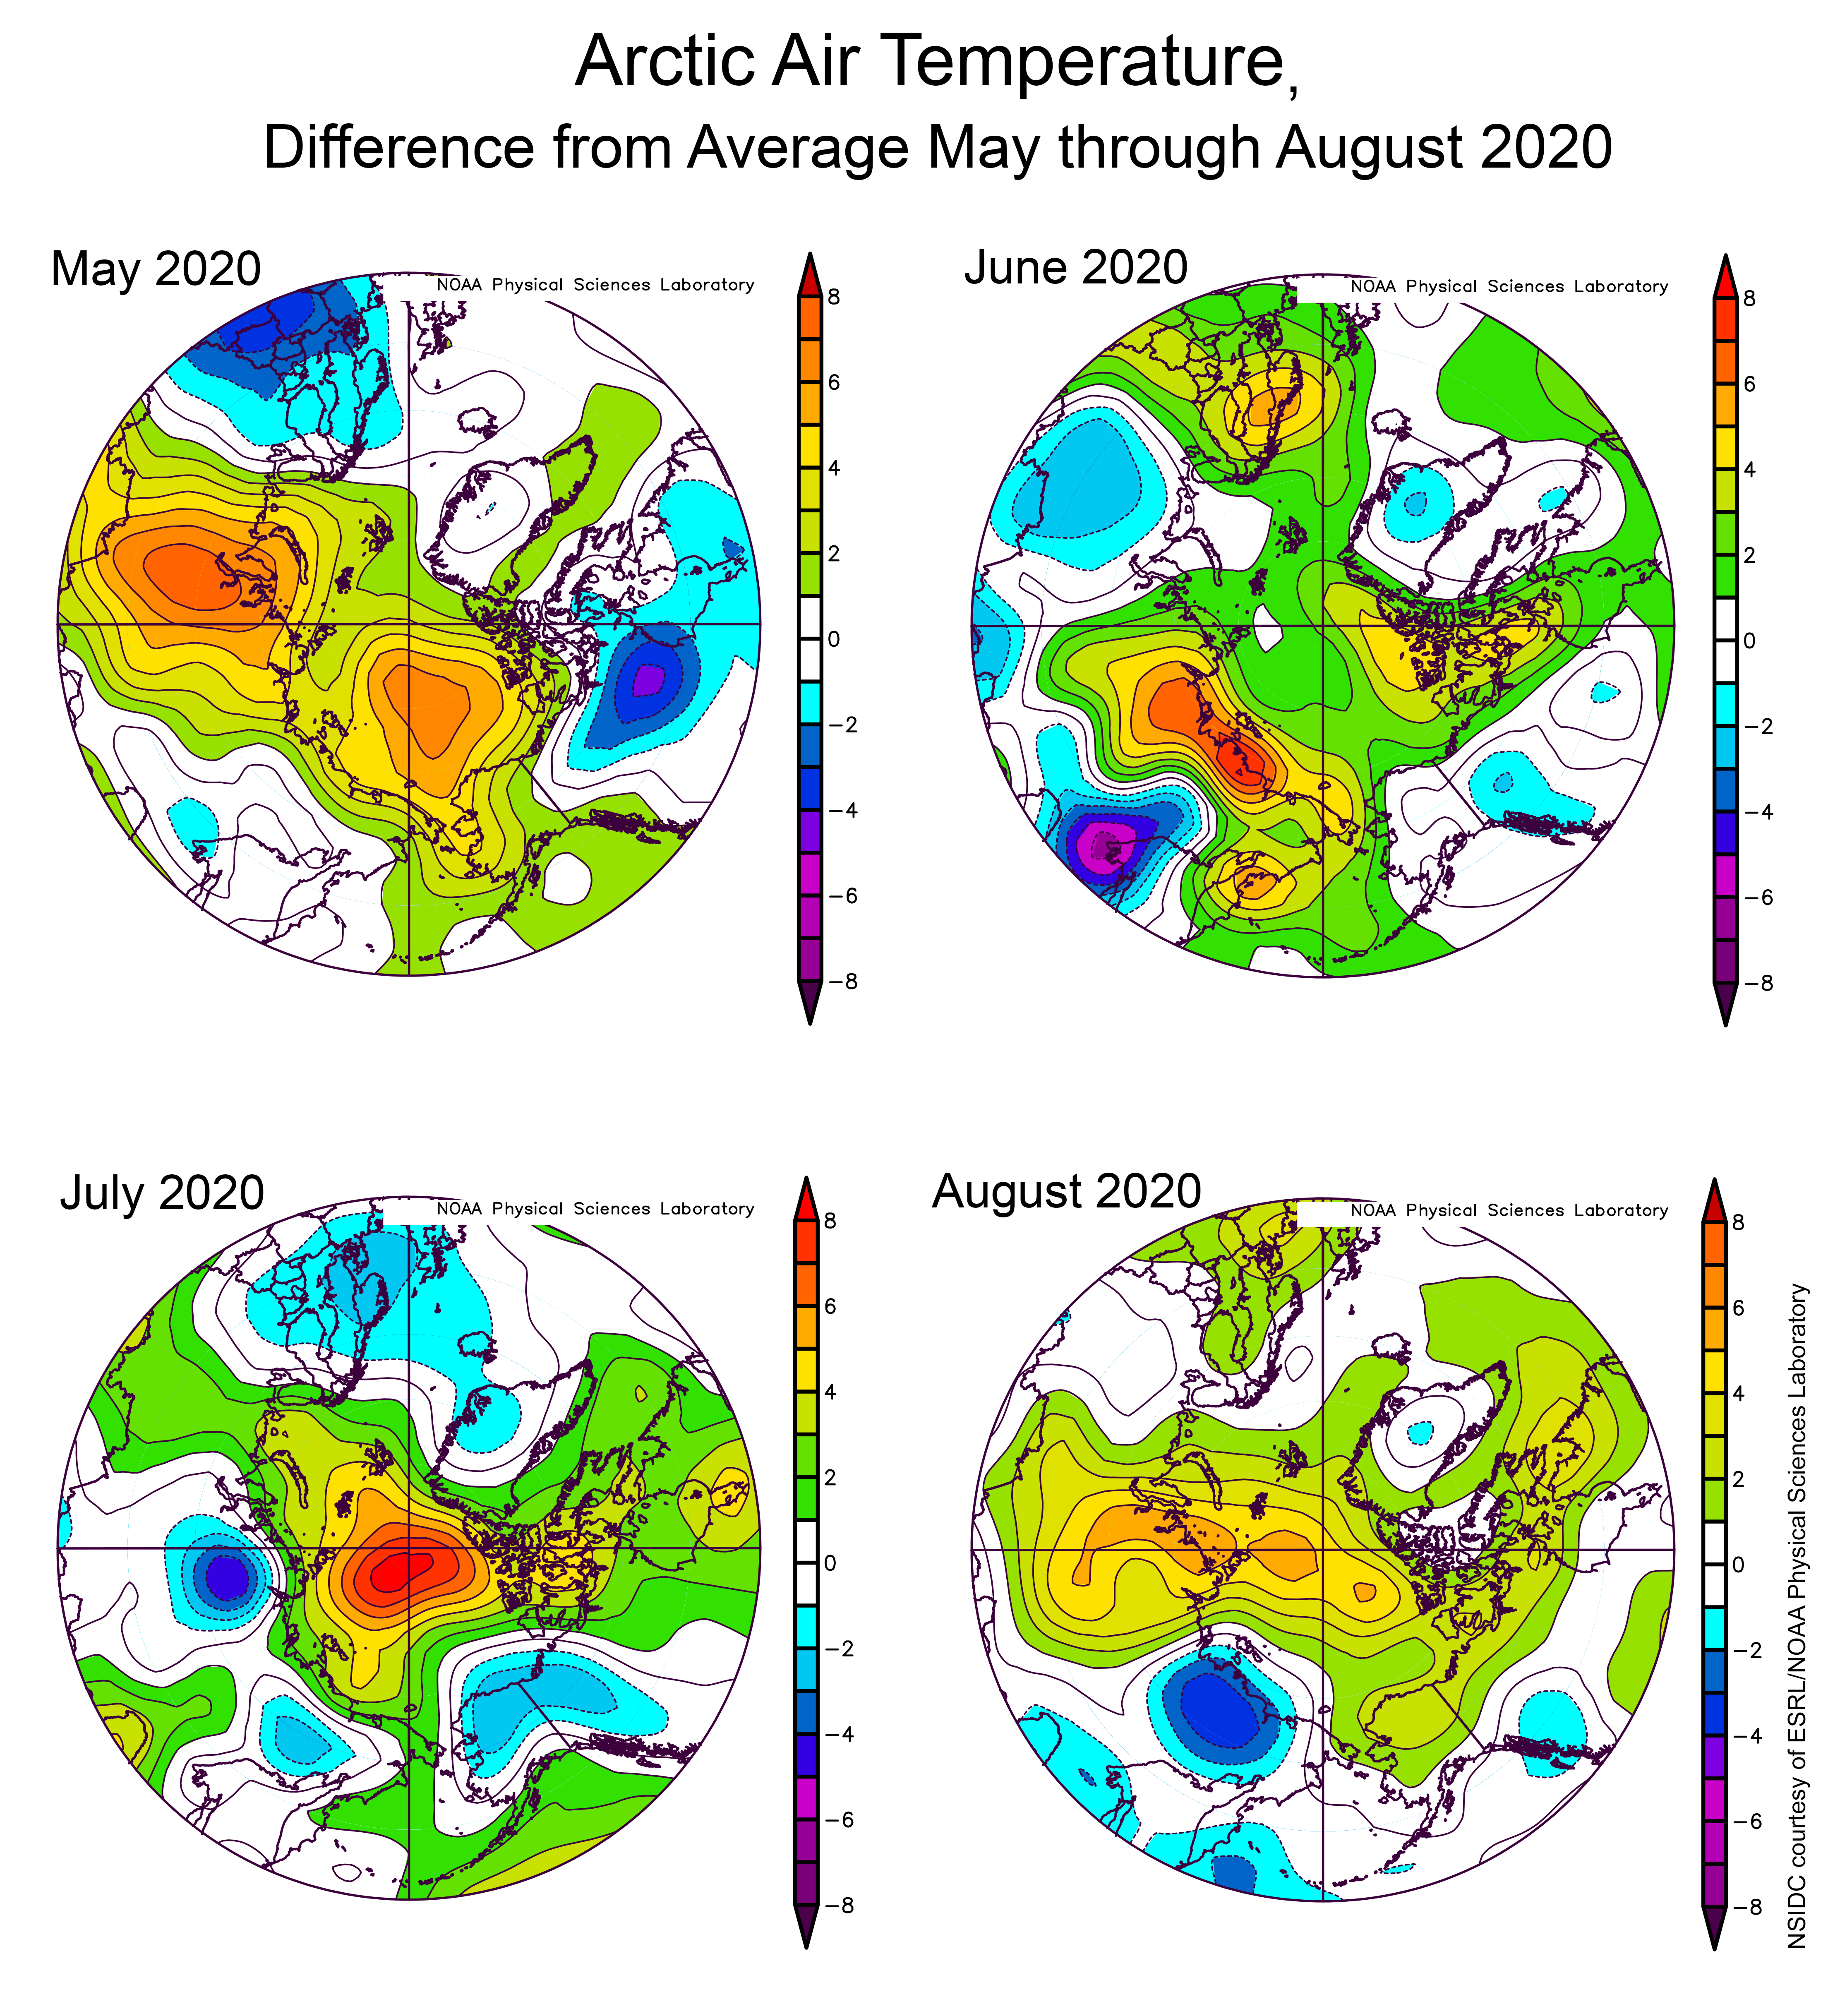
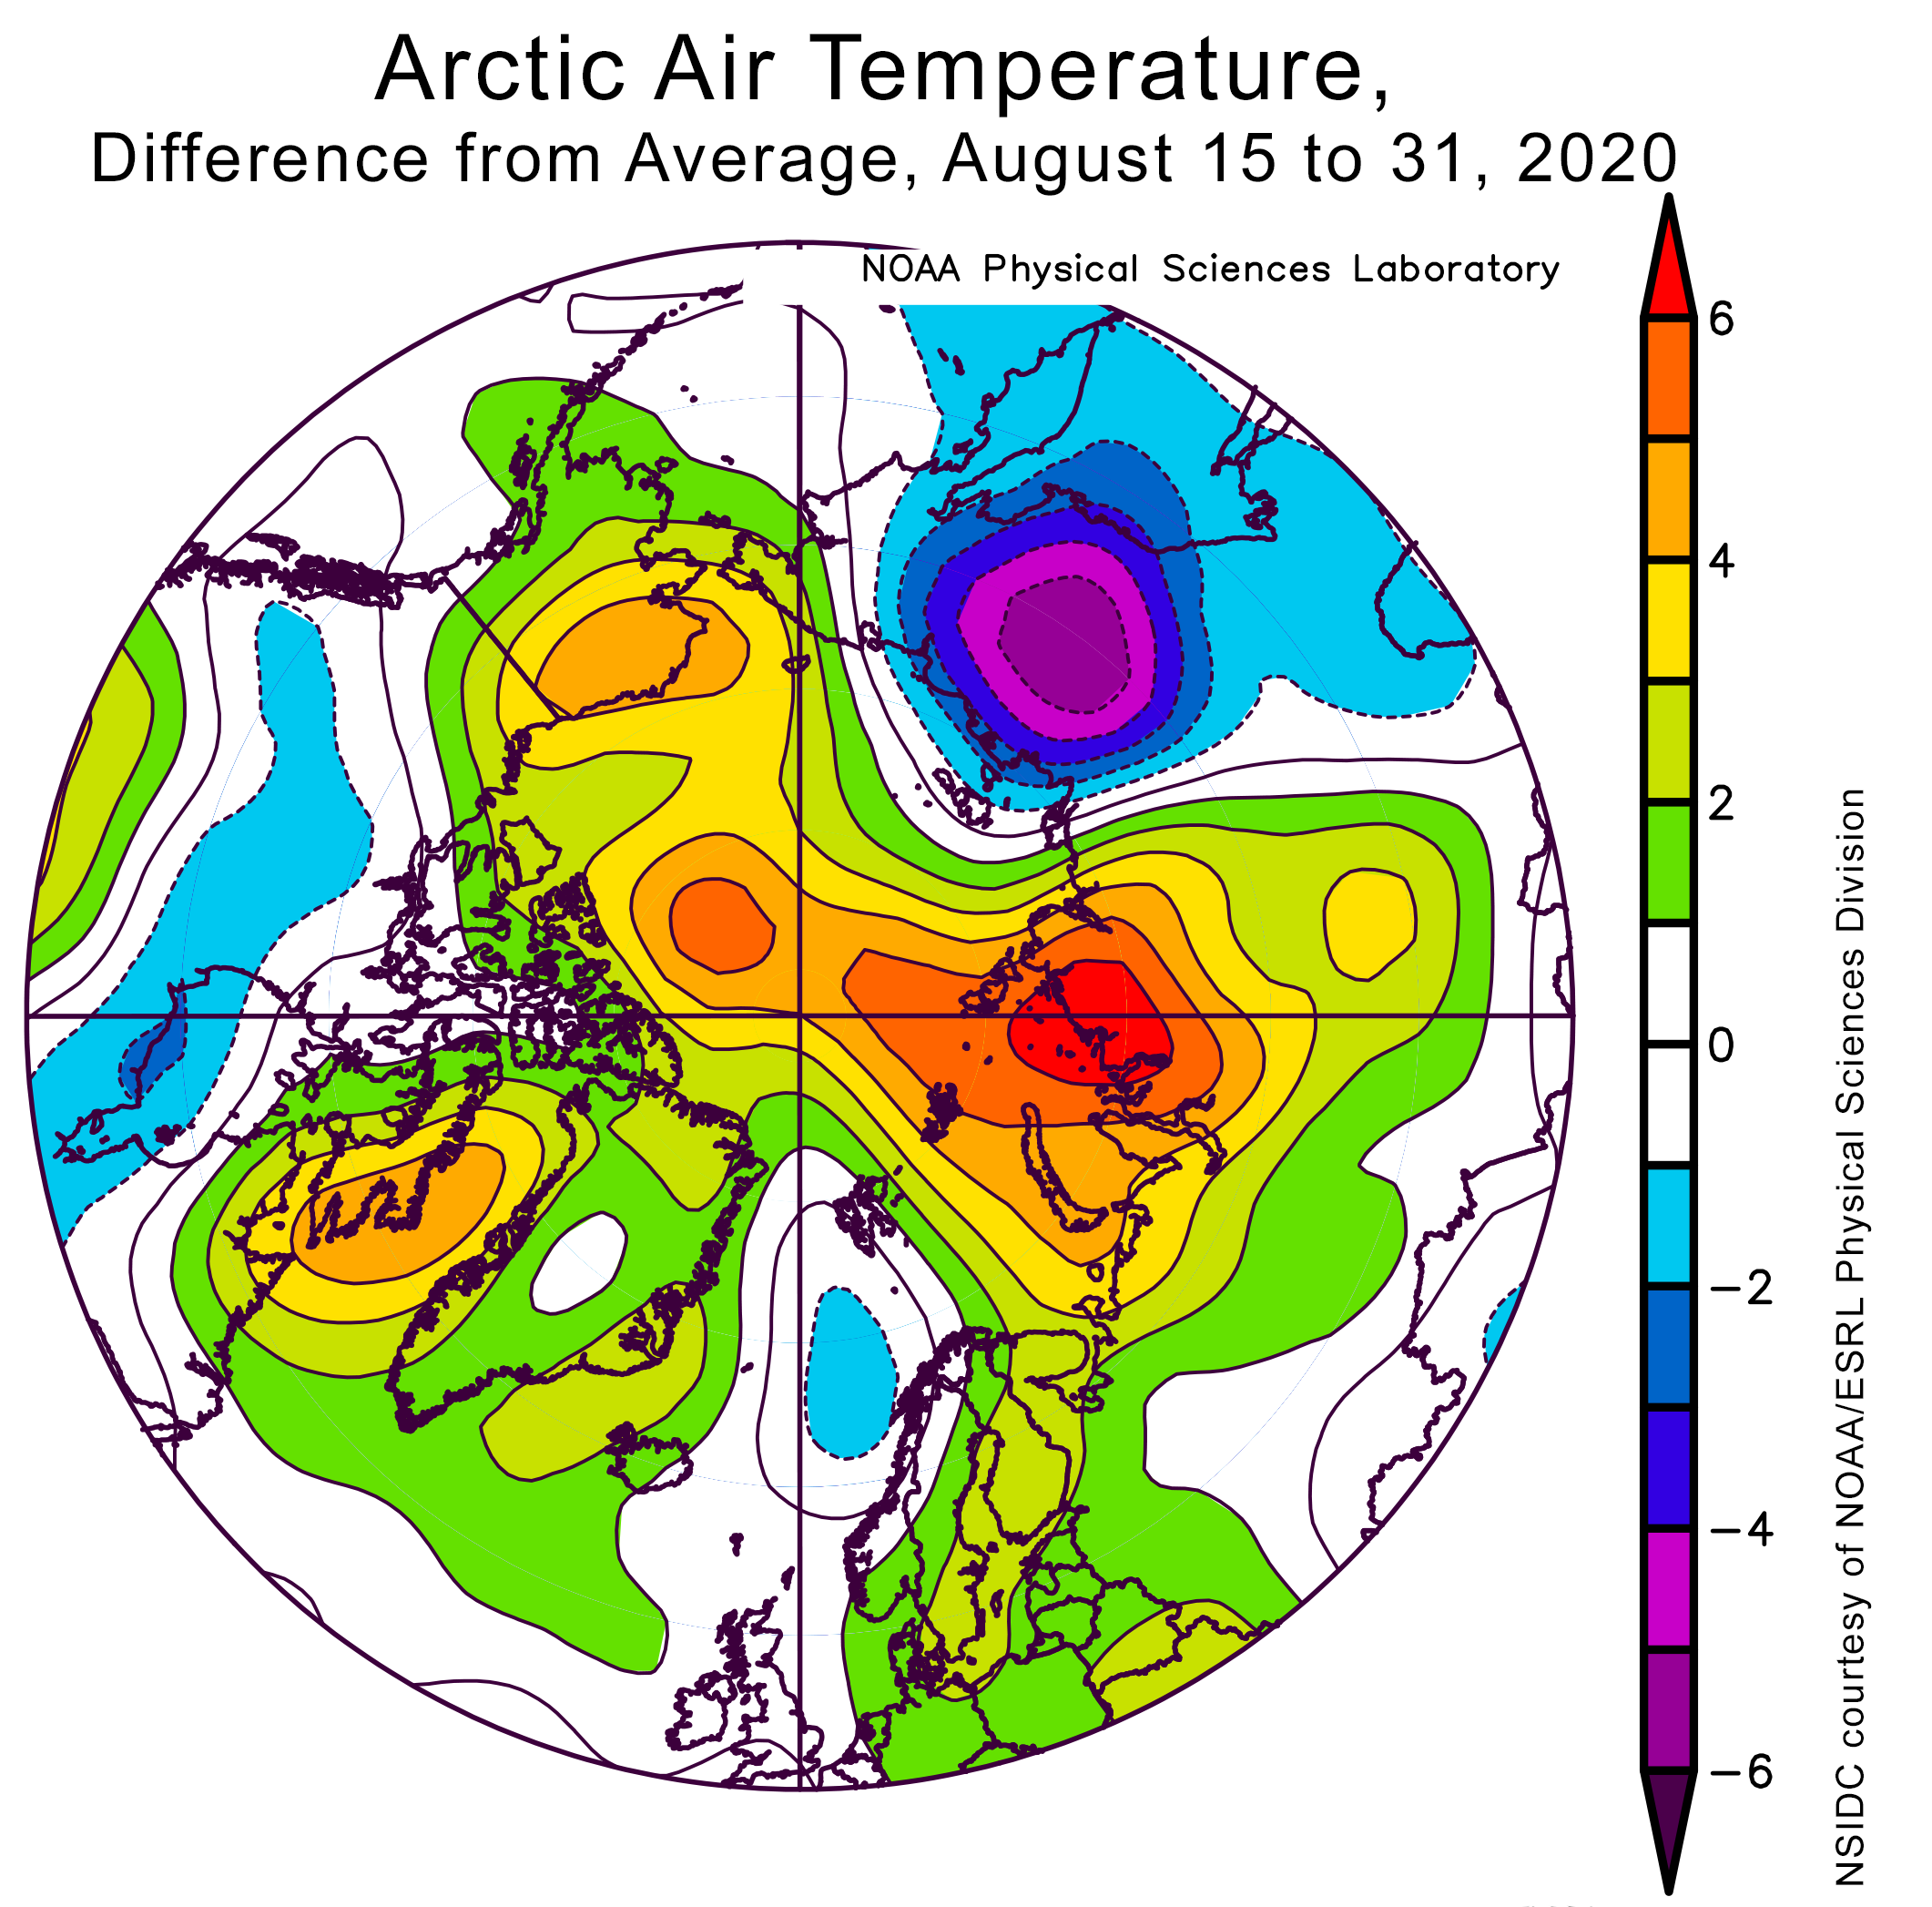
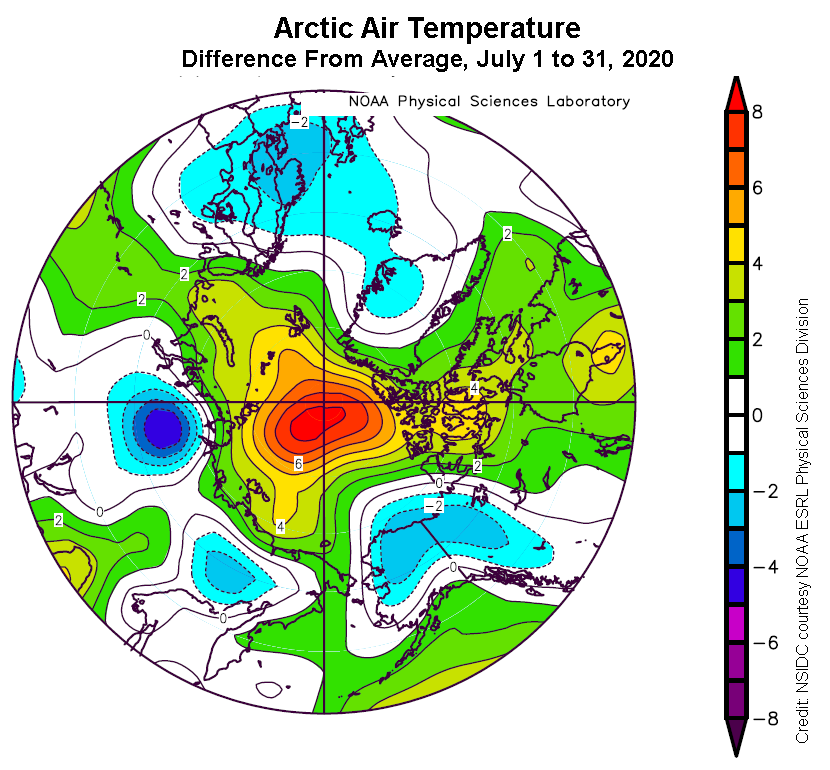
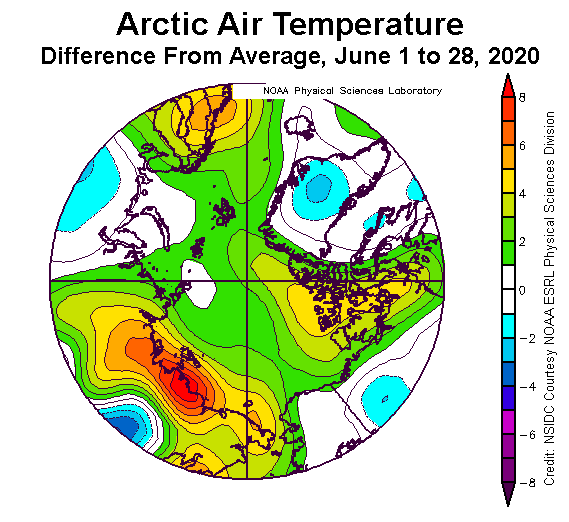
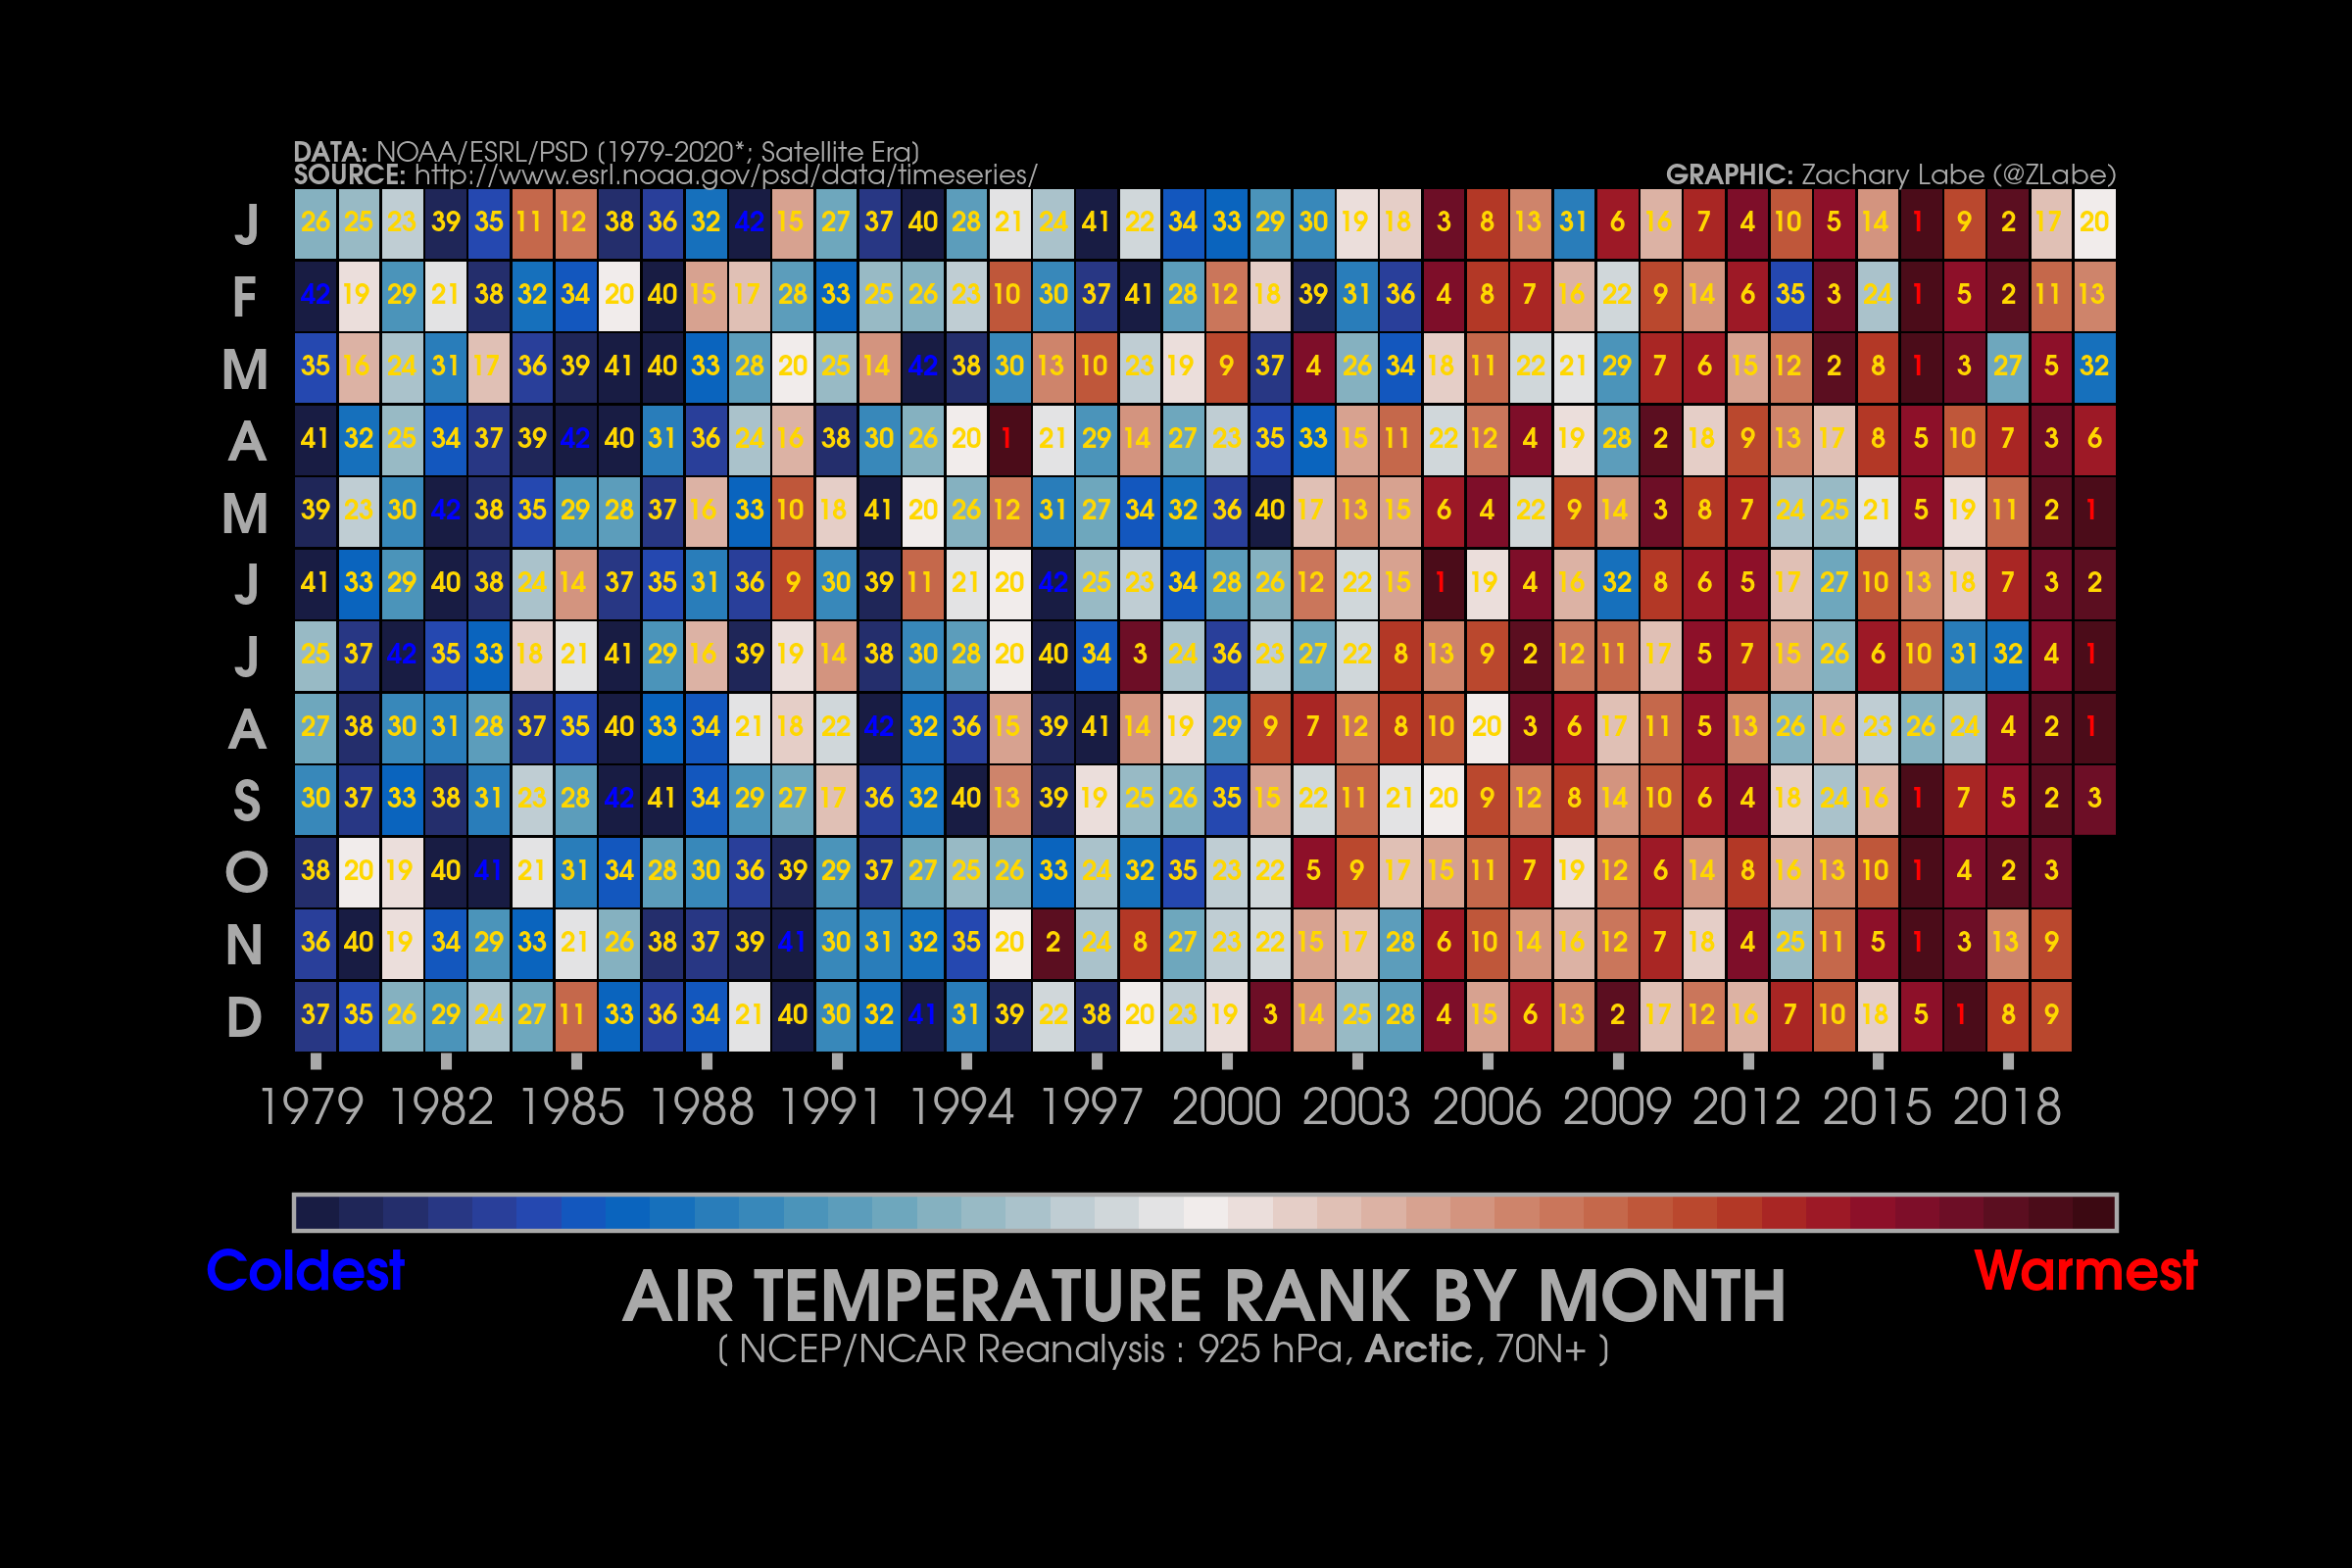
Figure 2b. This plot shows the departure from average air temperature in the Arctic at the 925 hPa level, in degrees Celsius, for November 2020. Yellows and reds indicate higher than average temperatures; blues and purples indicate lower than average temperatures.
Credit: NSIDC courtesy NOAA Earth System Research Laboratory Physical Sciences Division
High-resolution image
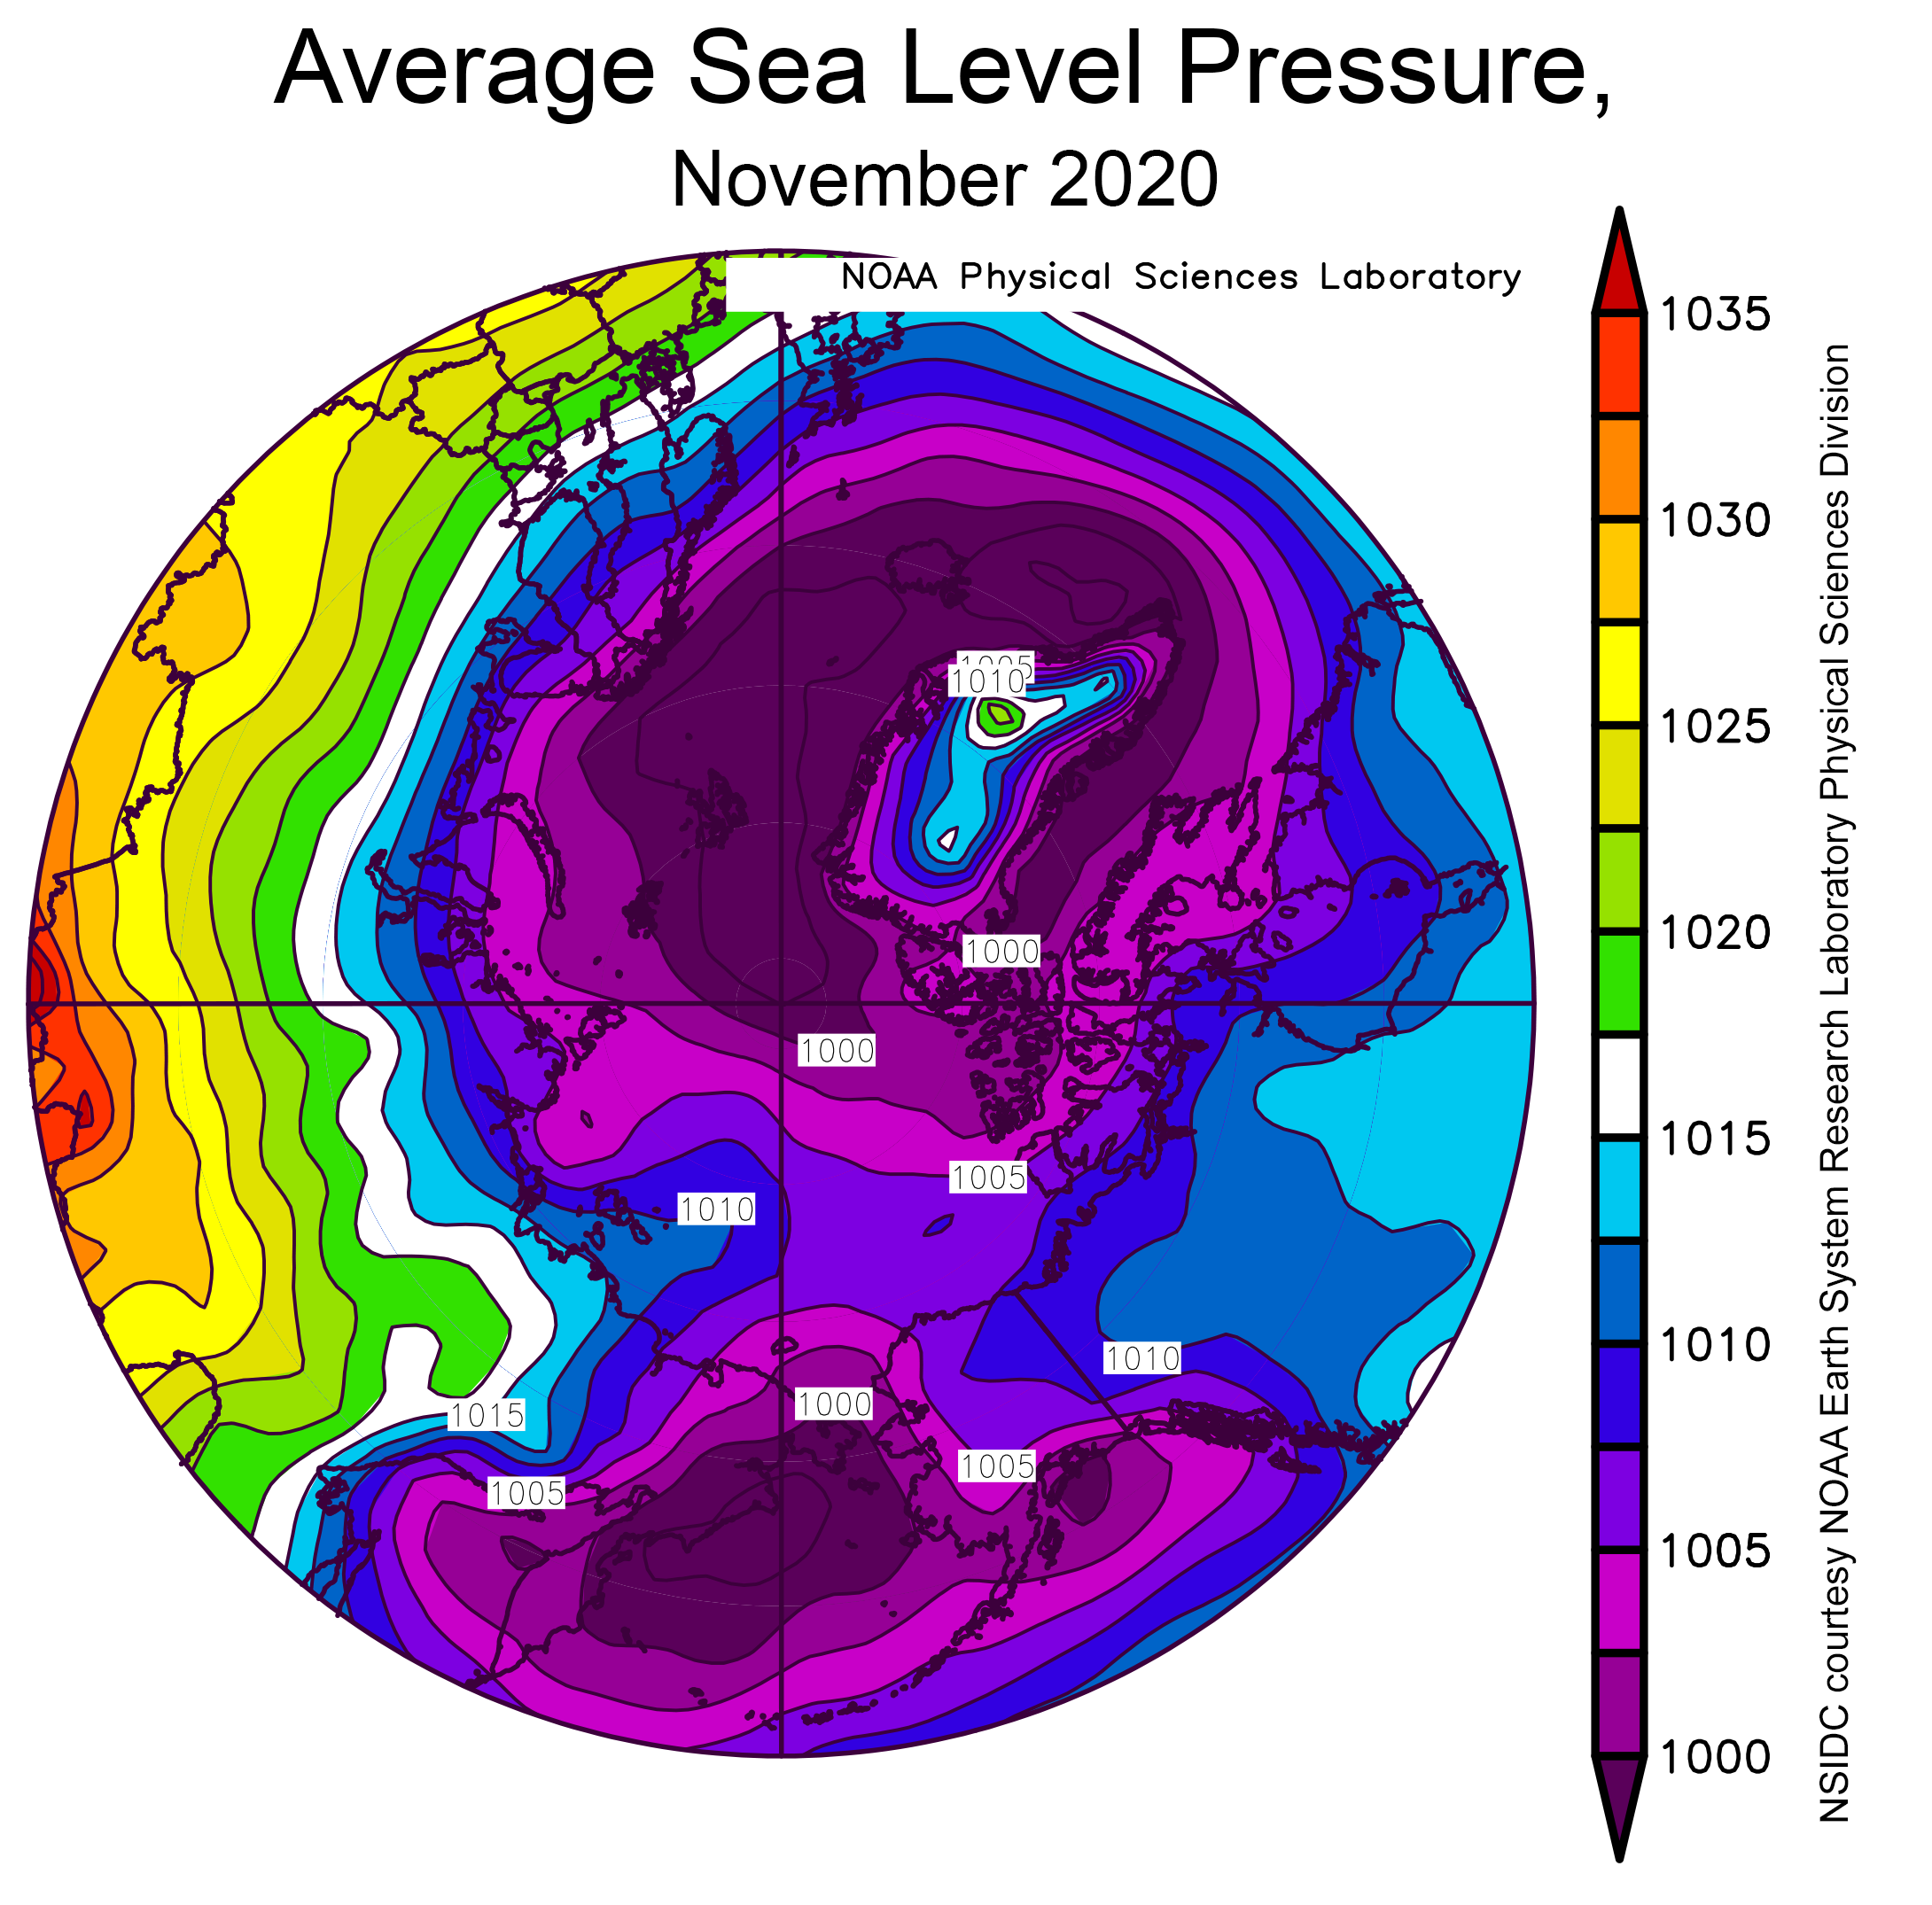
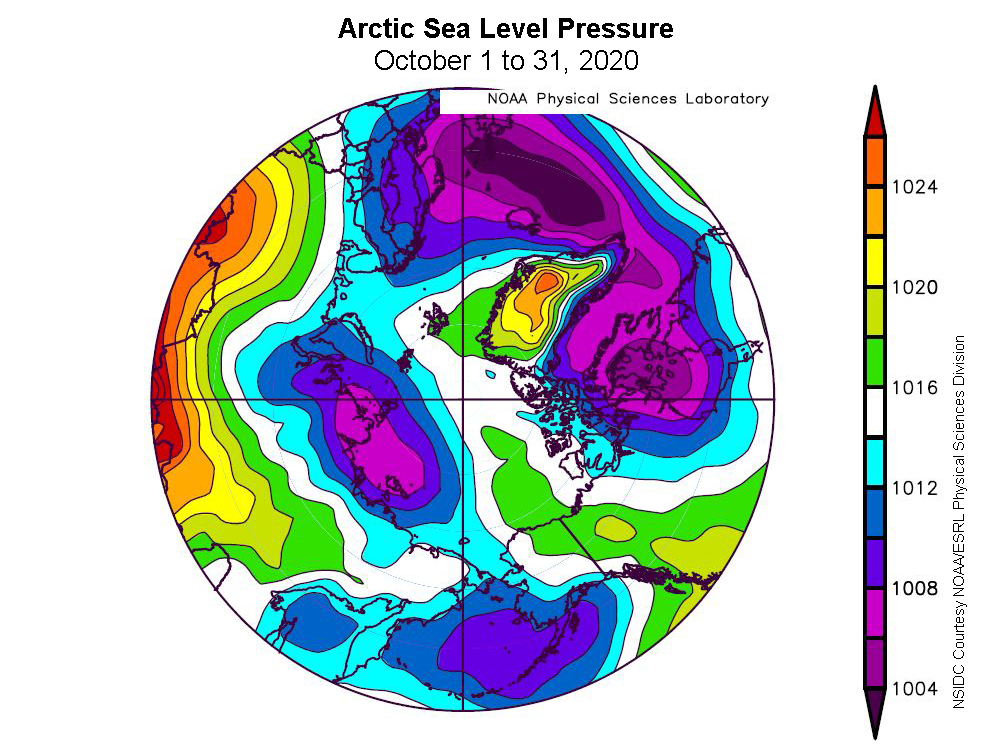
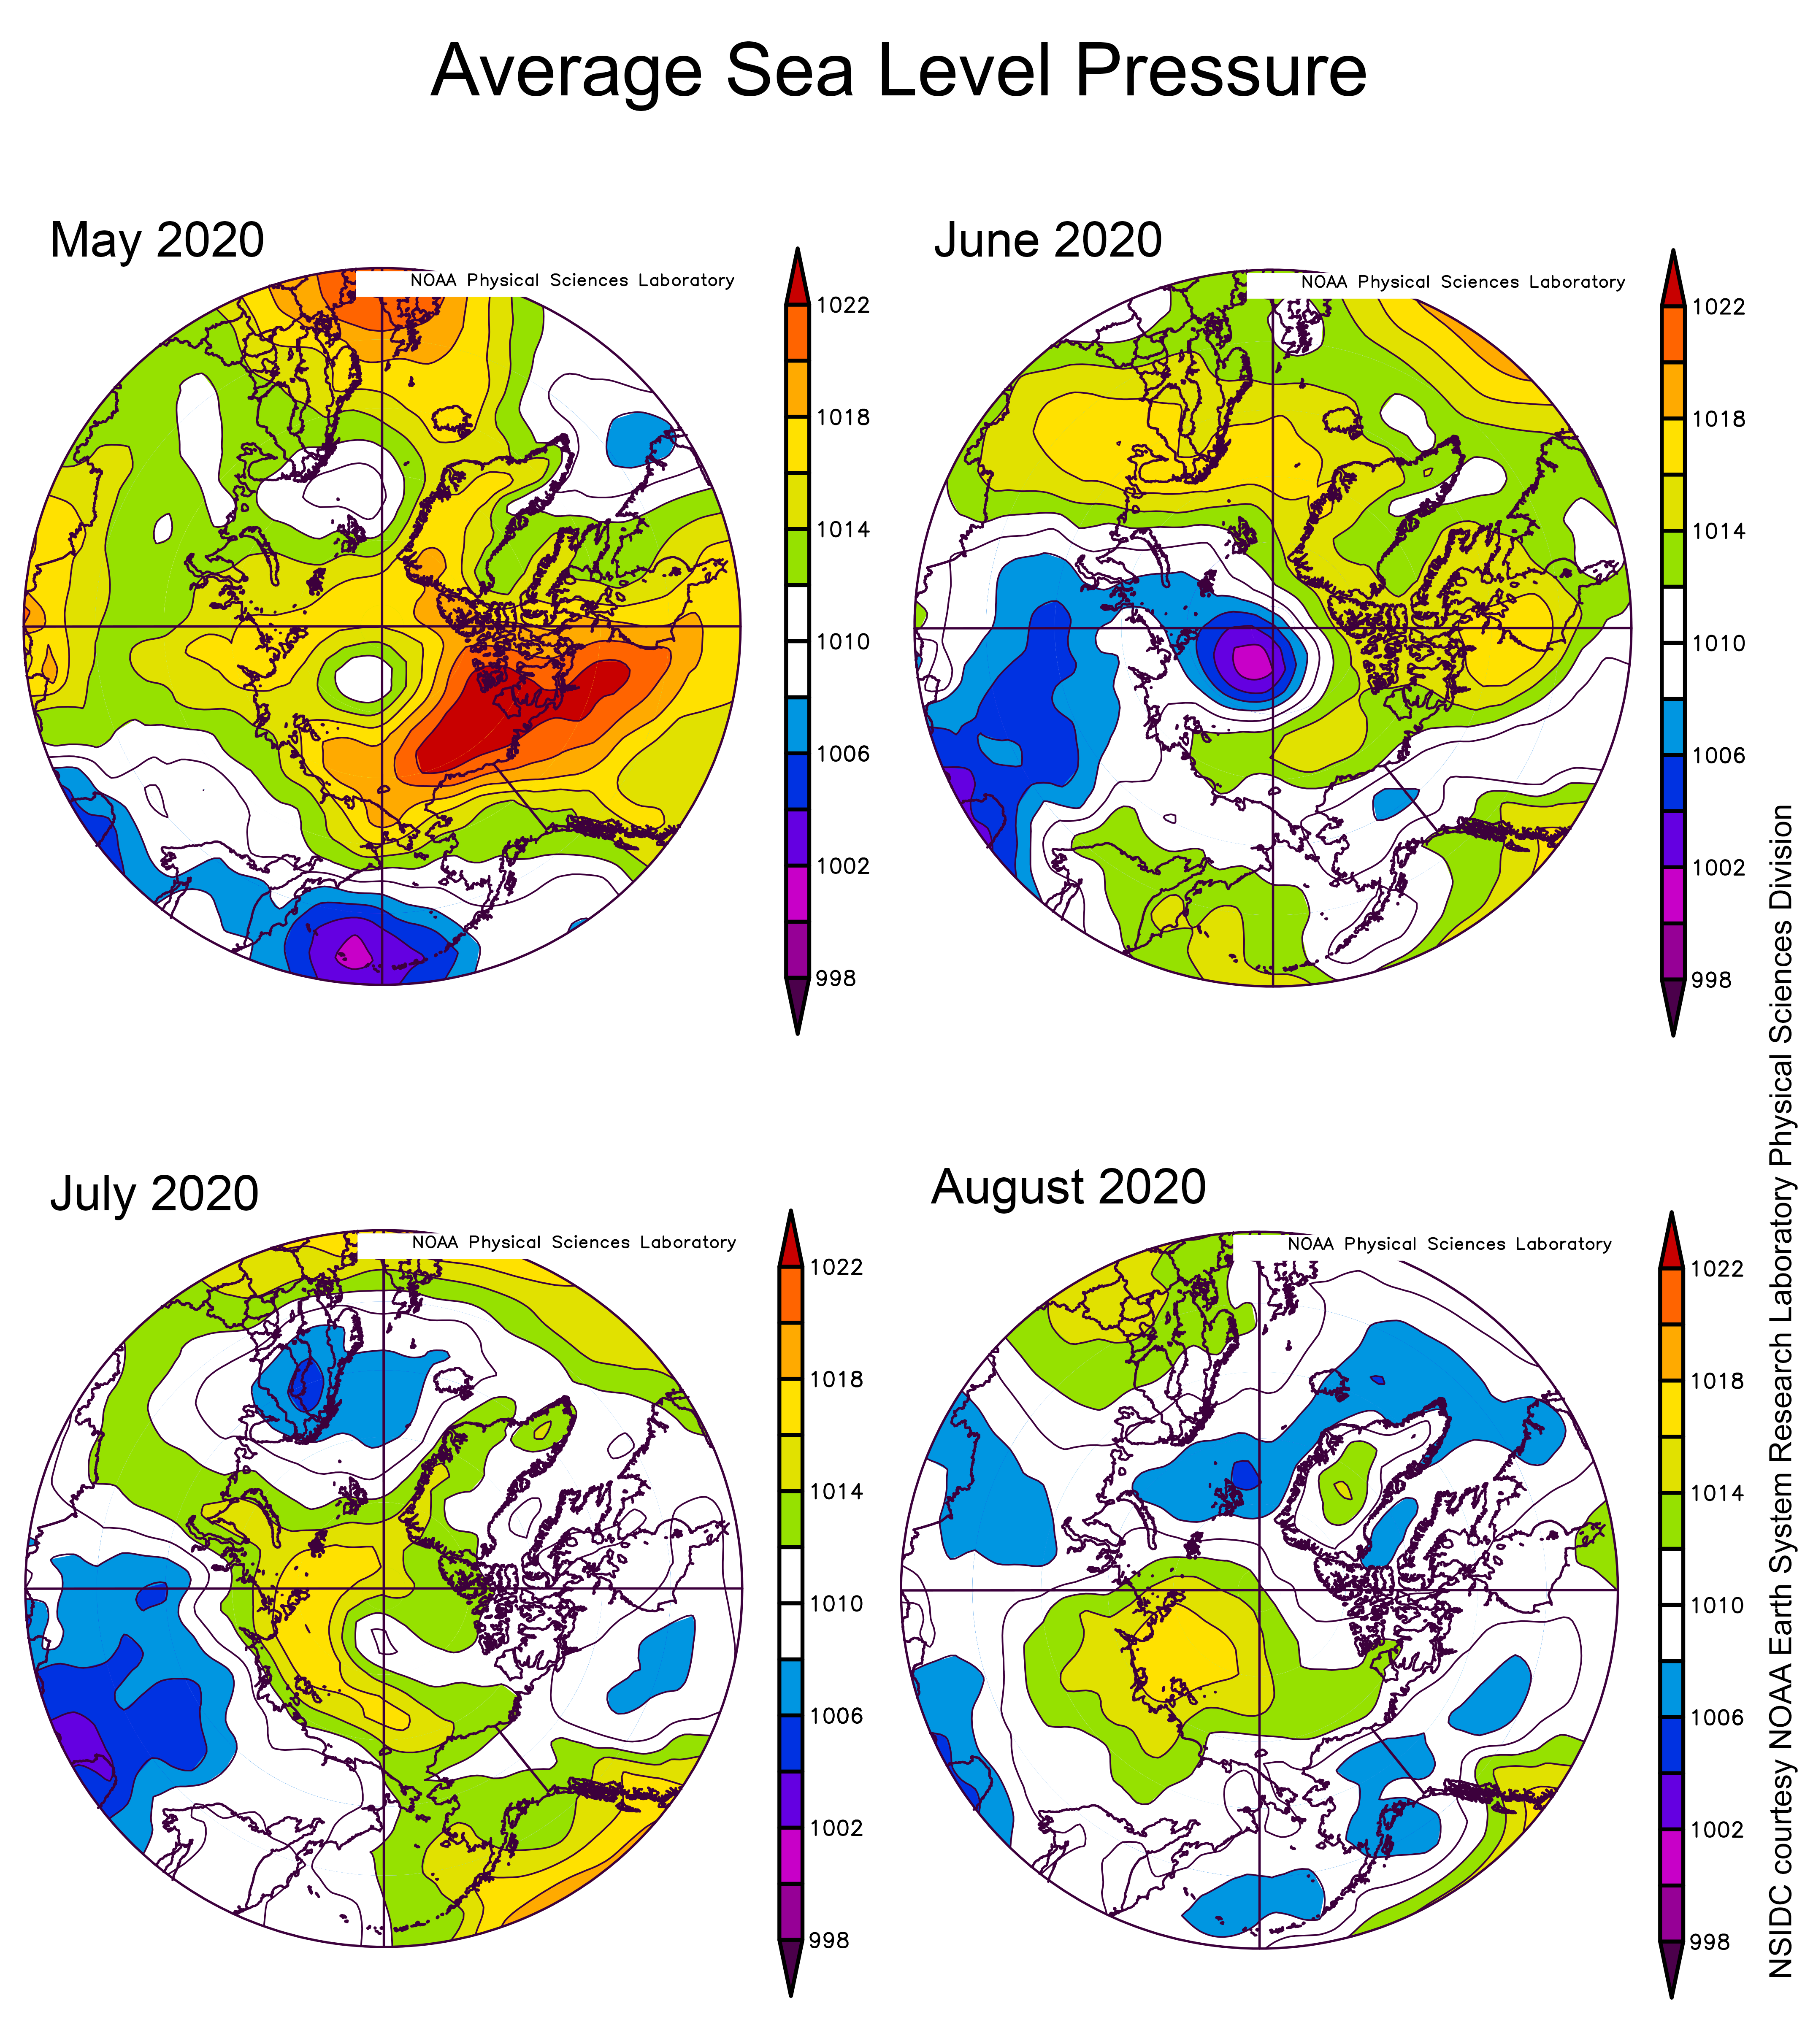
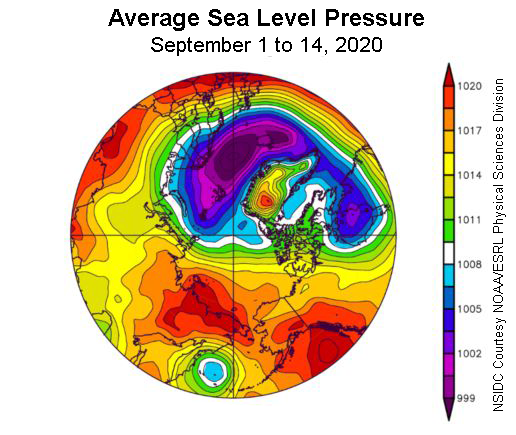
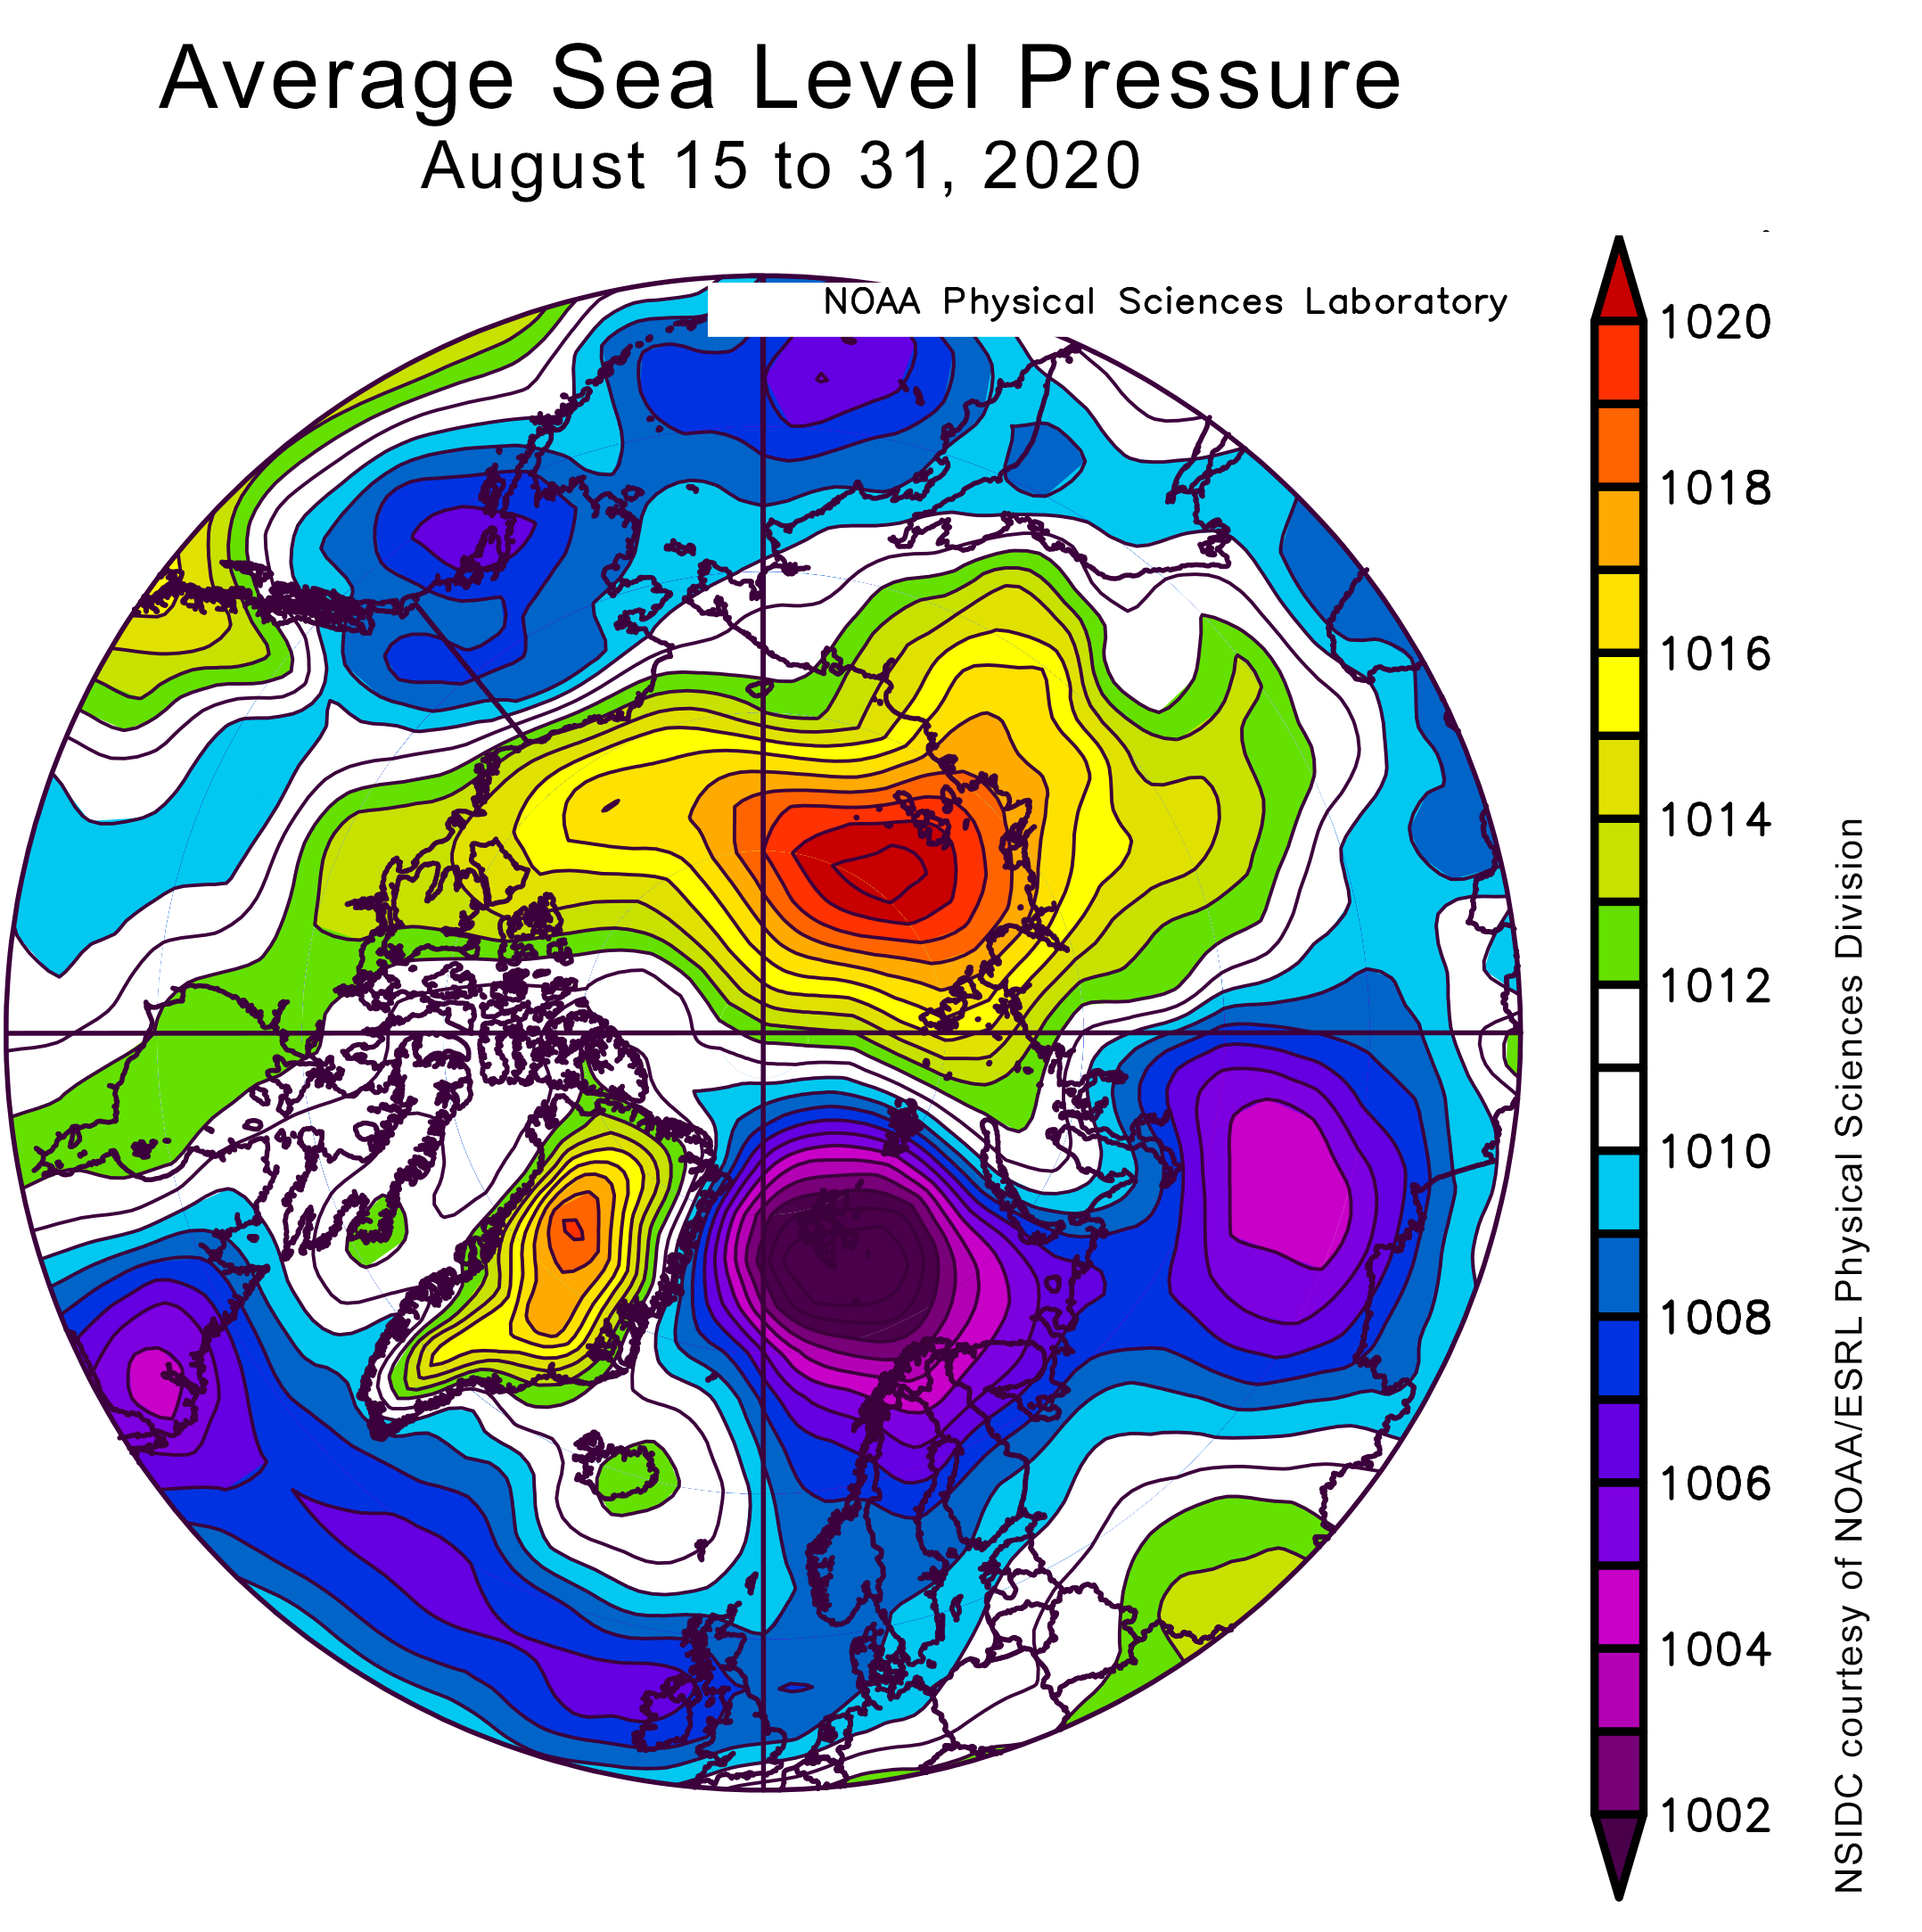
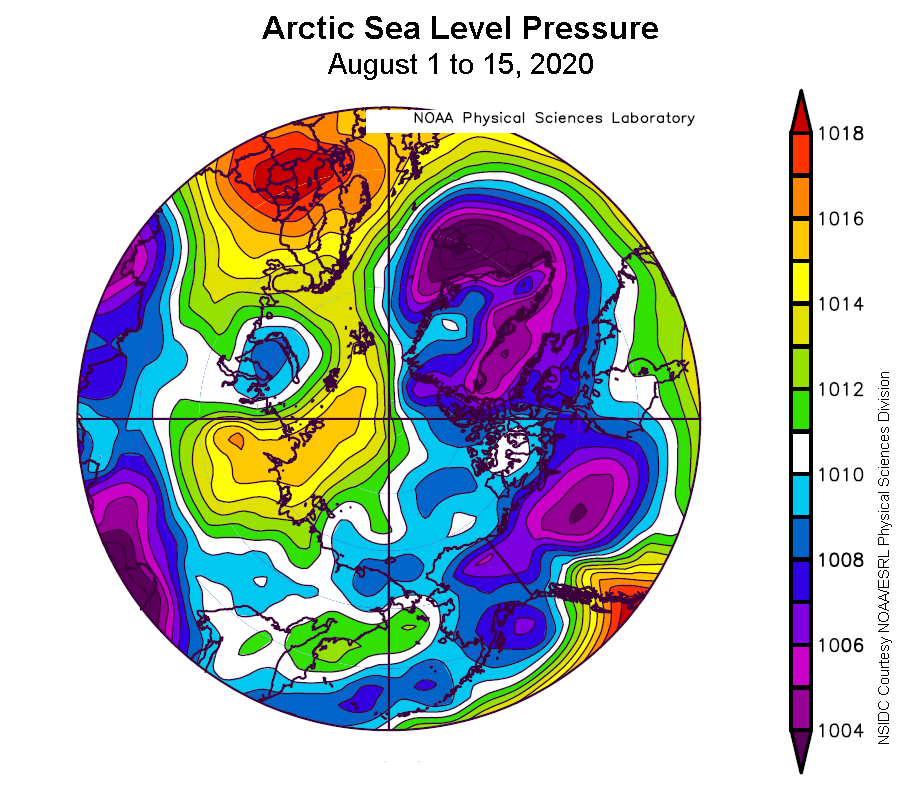
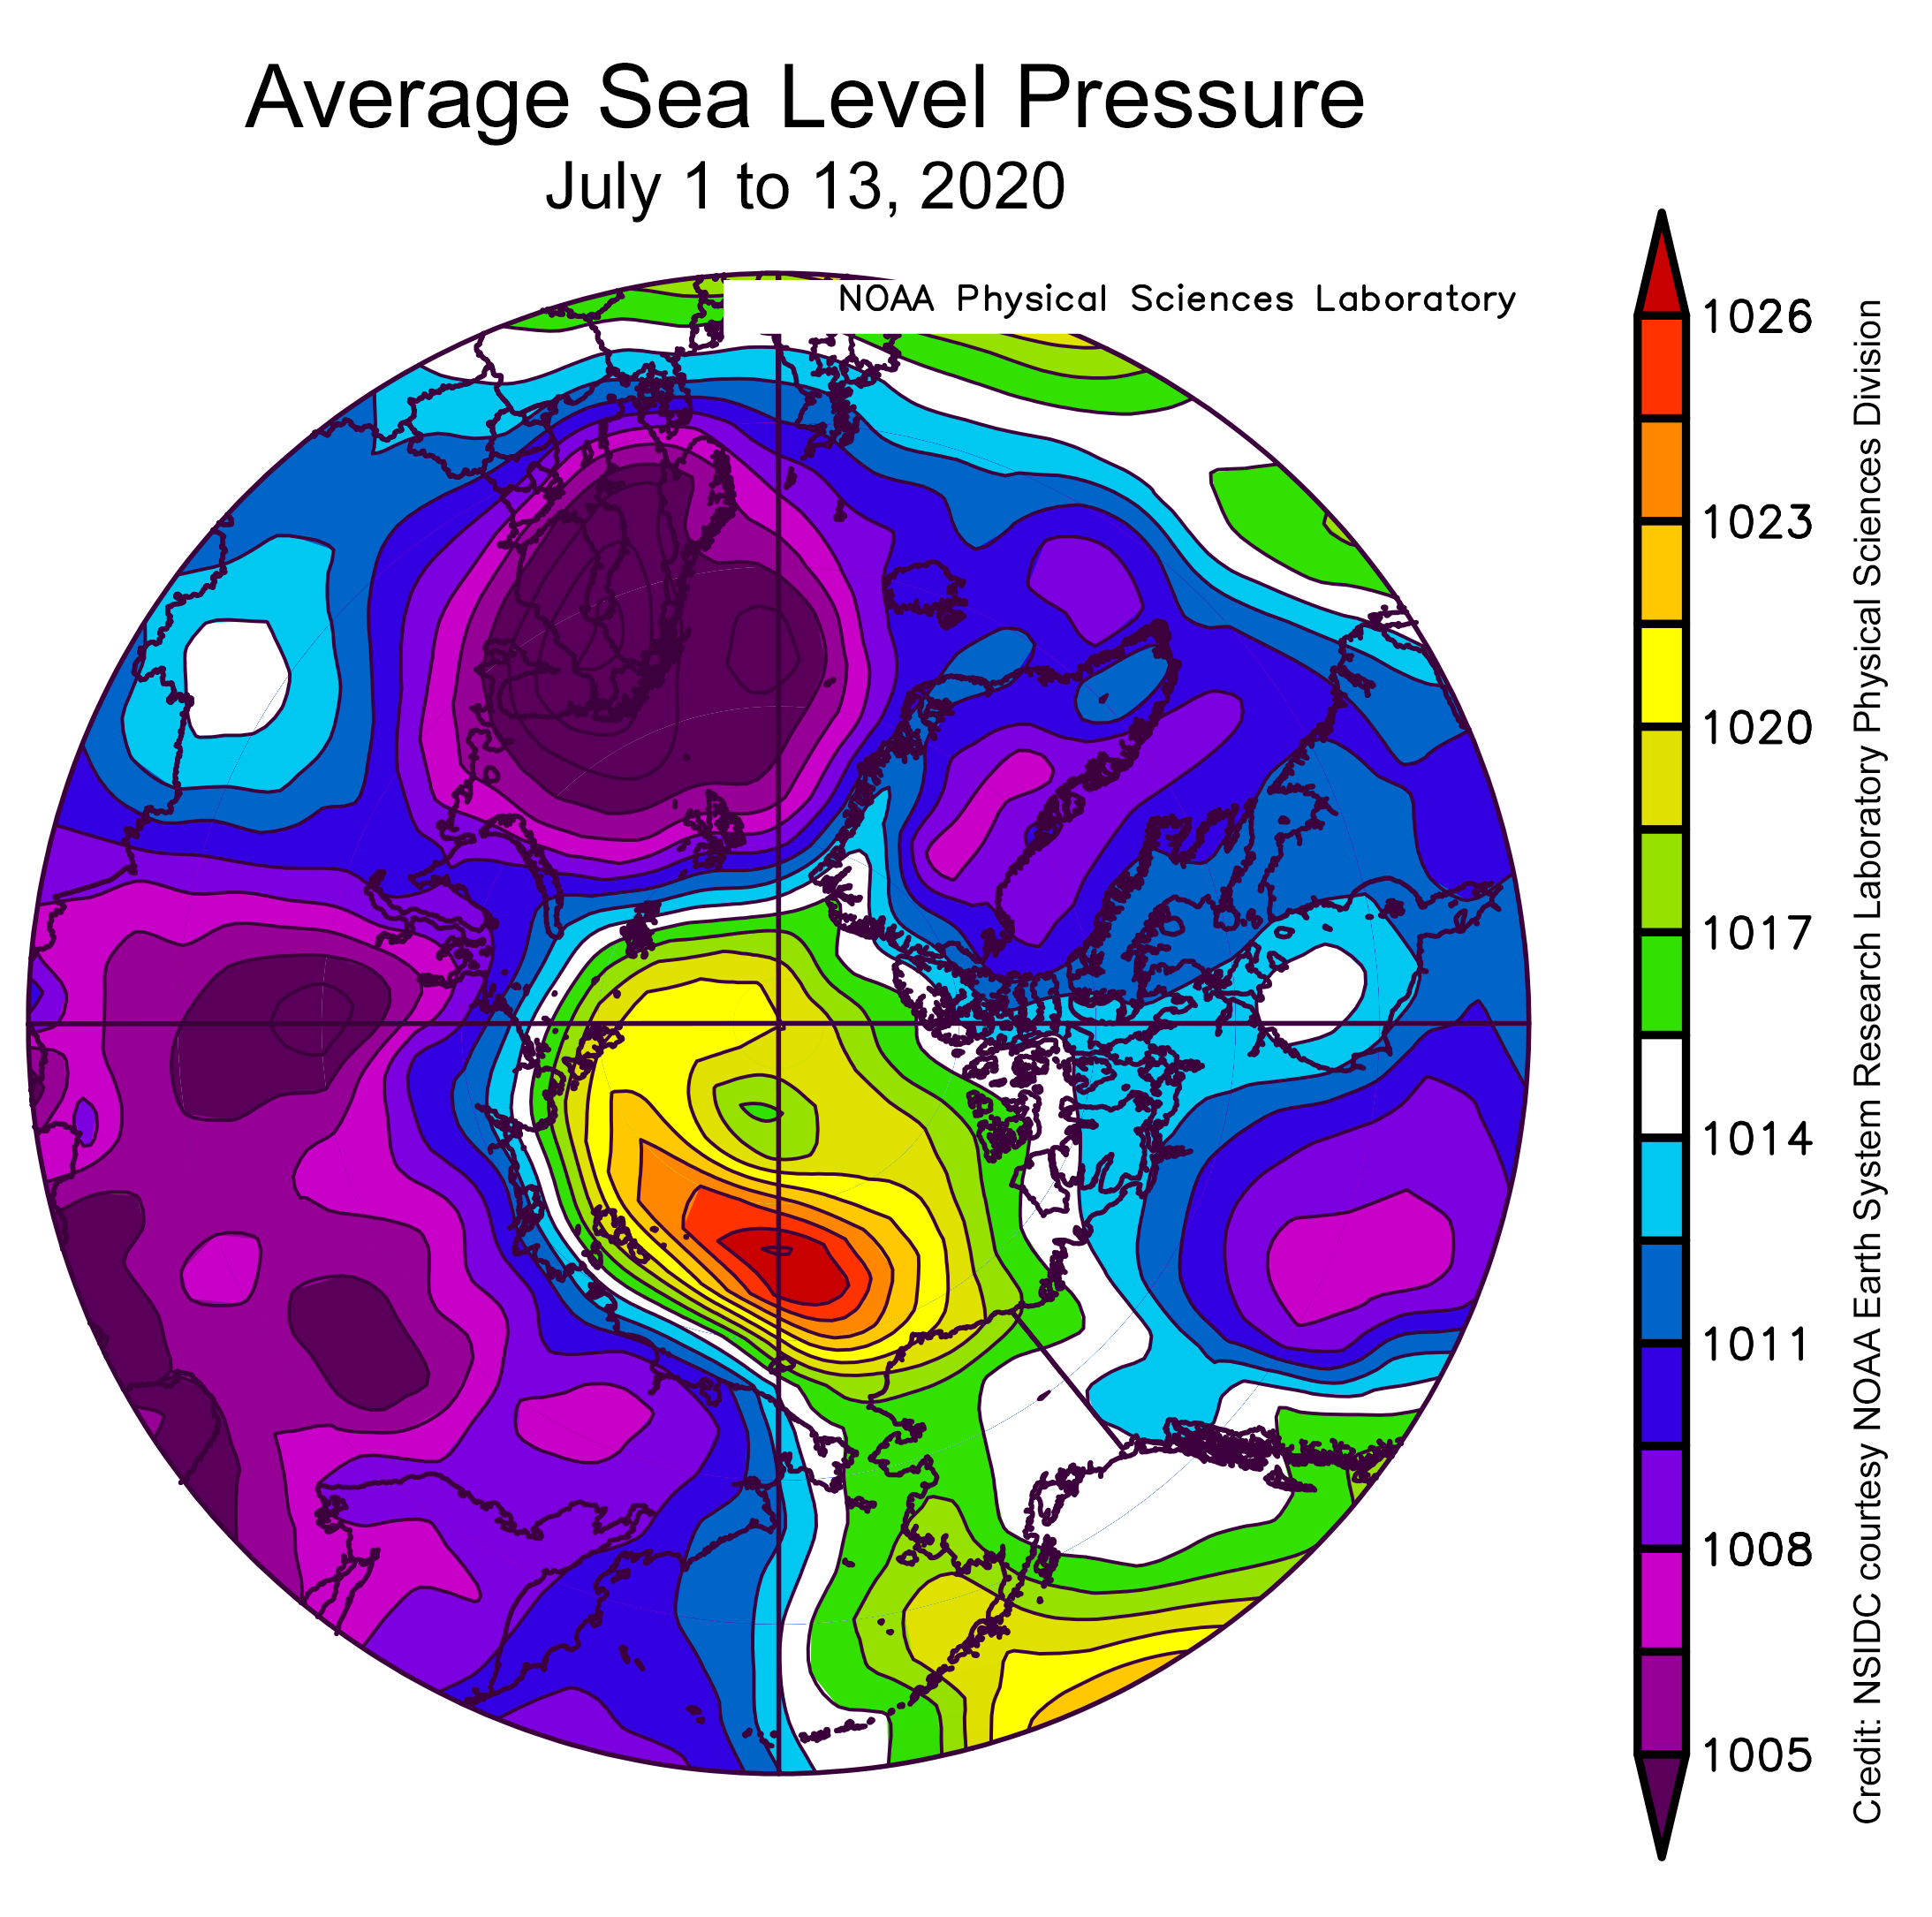
Figure 2c. This plot shows average sea level pressure in the Arctic in millibars for November 2020. Yellows and reds indicate high air pressure; blues and purples indicate low pressure.
Credit: NSIDC courtesy NOAA Earth System Research Laboratory Physical Sciences Division
High-resolution image
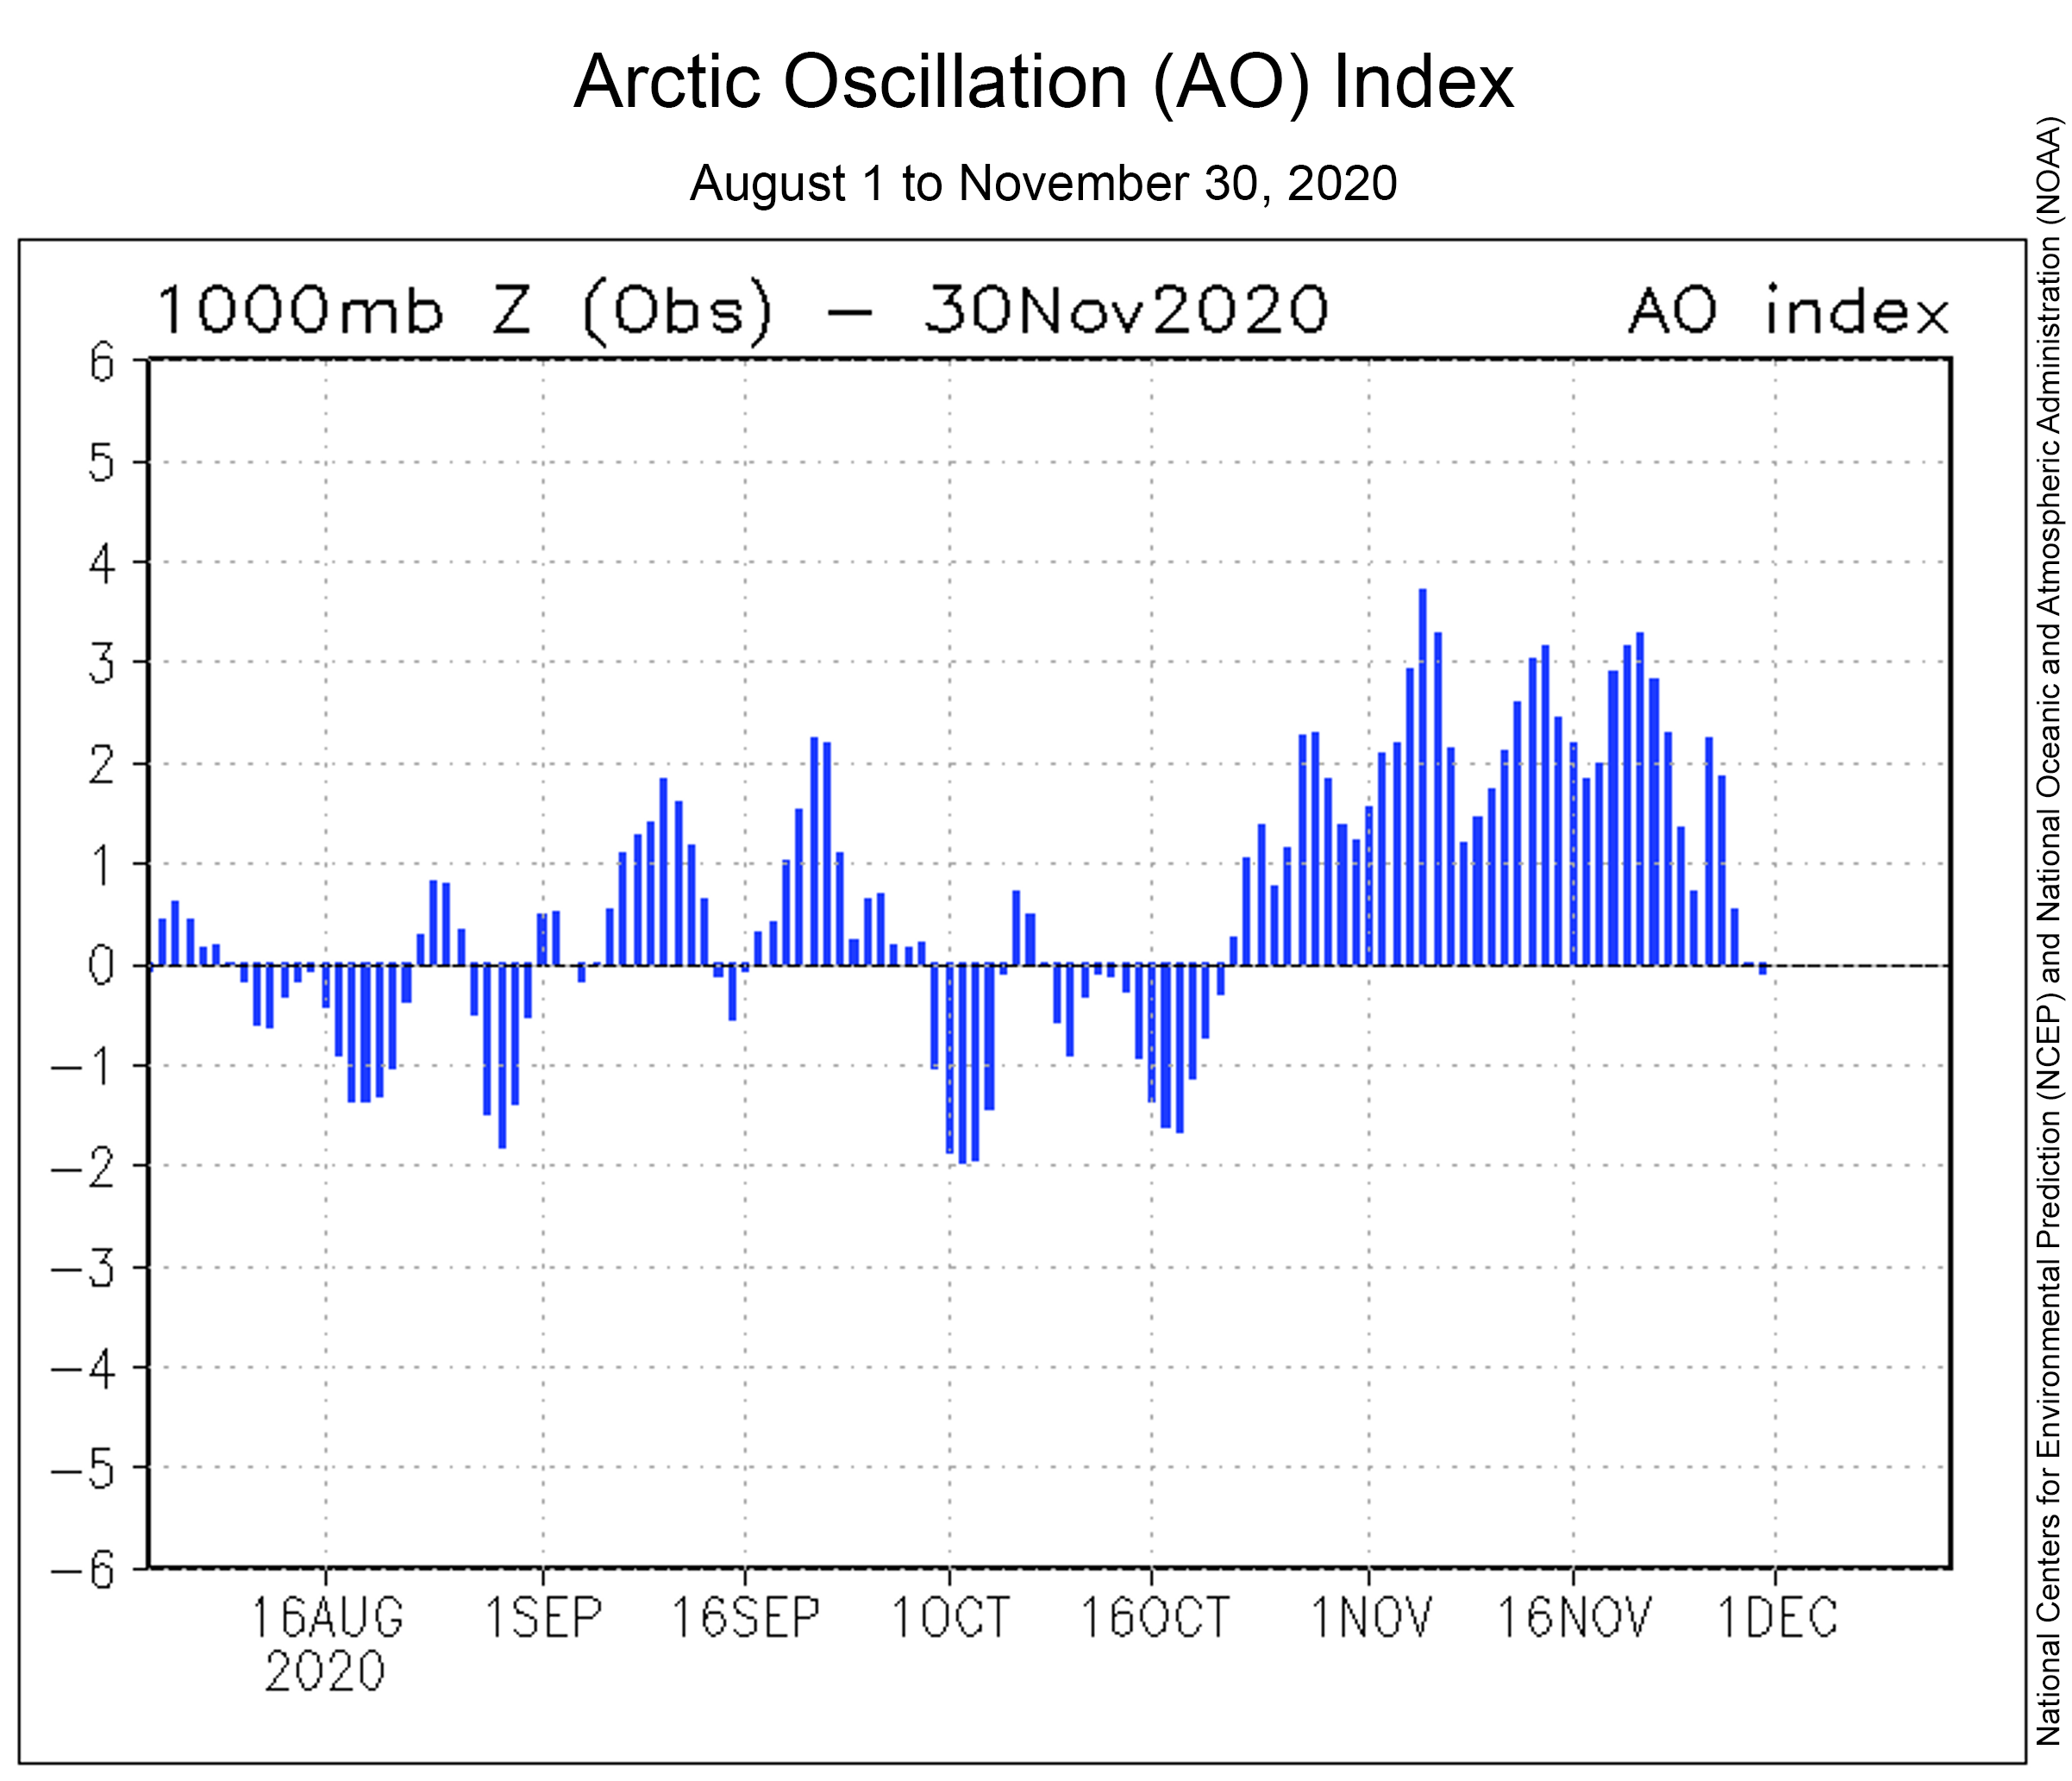
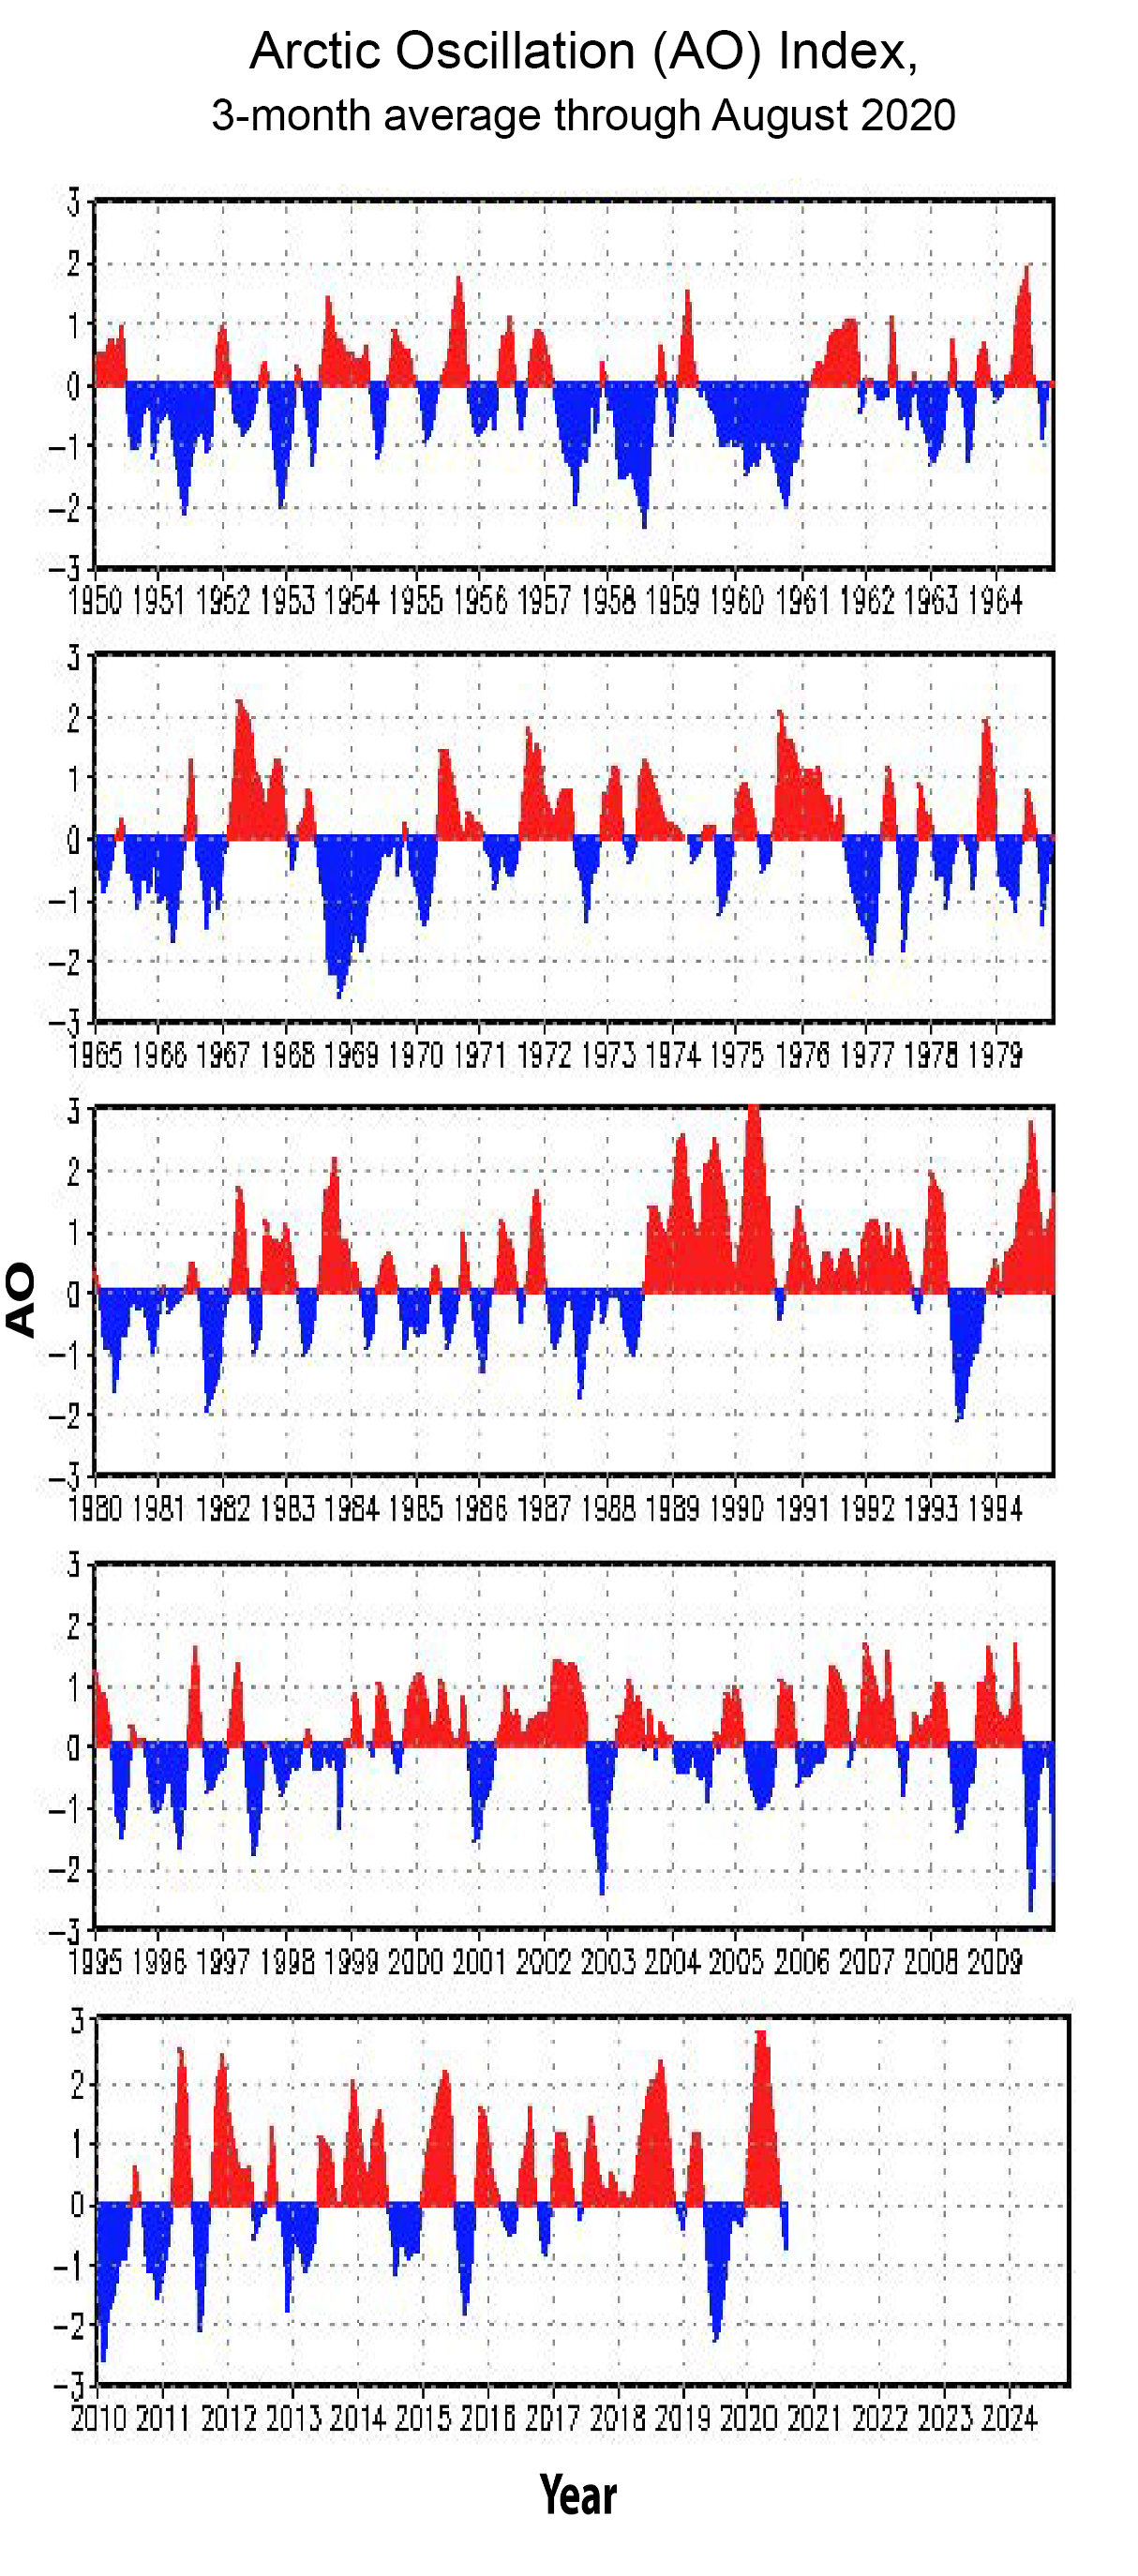
Figure 2d. This graph shows the Arctic Oscillation (AO) index from August 1 to November 30, 2020.
Credit: National Centers for Environmental Prediction (NCEP) and National Oceanic and Atmospheric Administration (NOAA)
High-resolution image
Through the month of November 2020, sea ice grew by an average of 116,000 square kilometers (44,800 square miles) per day, which is the fastest daily average growth on record for the month, and 46,400 square kilometers (17,900 square miles) above the 1981 to 2010 average rate. However, growth rates varied greatly through the month. Continuing the pattern for late October, sea ice grew rapidly in the first week of November when the upper ocean lost its remaining summer heat back to the atmosphere and then to outer space. Thereafter, growth rates slowed, with a marked slowdown at the end of the month. Such temporary near pauses in ice growth, however, are not uncommon. As of early December, daily extents were the second lowest in the satellite record, behind 2016. Despite low extent for the Arctic as a whole, the Northern Sea Route along the Russian coast is now covered with ice.
Again continuing the pattern for October, air temperatures at the 925 hPa level (about 2,500 feet above the surface) averaged for November 2020 were above average over much of the Arctic Ocean (Figure 2b). Temperatures were 4 to 6 degrees Celsius (7 to 11 degrees Fahrenheit) above average over the Beaufort and Chukchi Seas, the northern Barents Sea, and the Laptev Sea. By contrast, temperatures at the 925 hPa level over the Canadian Arctic Archipelago were near average.
These air temperature “hot spots” correspond to areas of open water, where the ocean is still releasing large amounts of heat to the lower atmosphere; temperatures at the surface in these areas are locally more than 12 degrees Celsius (22 degrees Fahrenheit) above long-term November averages. Recall that we addressed this issue in our previous post with the aid of vertical profiles of temperature. However, the prevailing atmospheric circulation pattern for November also played a role—sea level pressure was quite low over the Atlantic side of the Arctic, which coupled with high pressure over northern Eurasia, favored the transport of warm air into the Barents, Kara, and Laptev Seas (Figure 2c).
Particularly notable about this sea level pressure pattern is that it manifests a return to a strongly positive phase of the Arctic Oscillation (AO) (Figure 2d). Recall from a previous post that much of the 2019 to 2020 winter was characterized by a positive AO phase. As of late November 2020, the AO index had regressed back to a neutral phase; whether this is temporary remains to be seen.
November 2020 compared to previous years
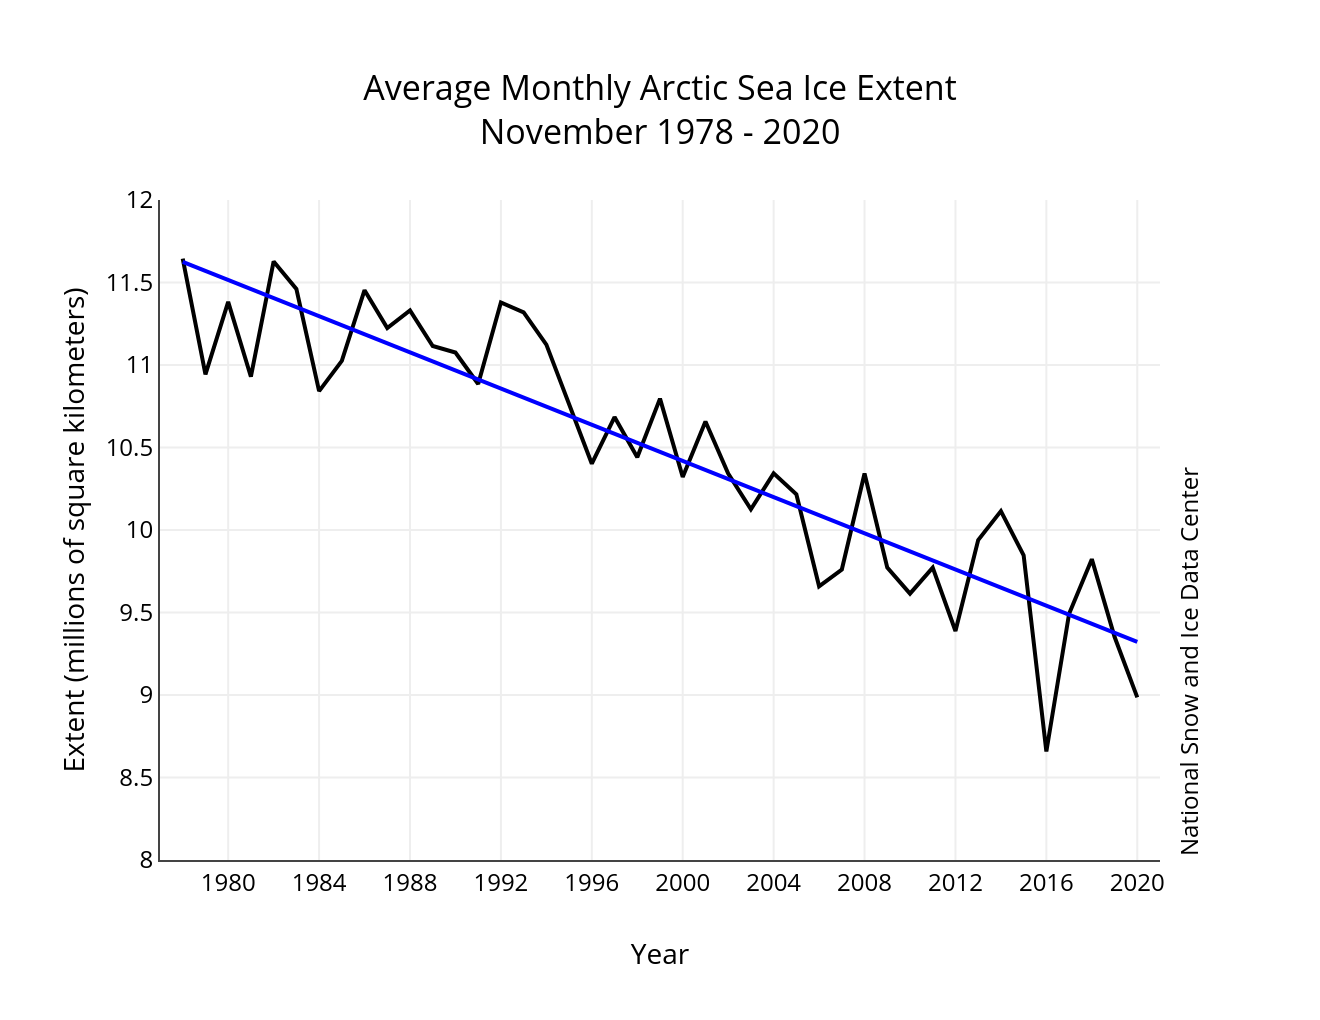
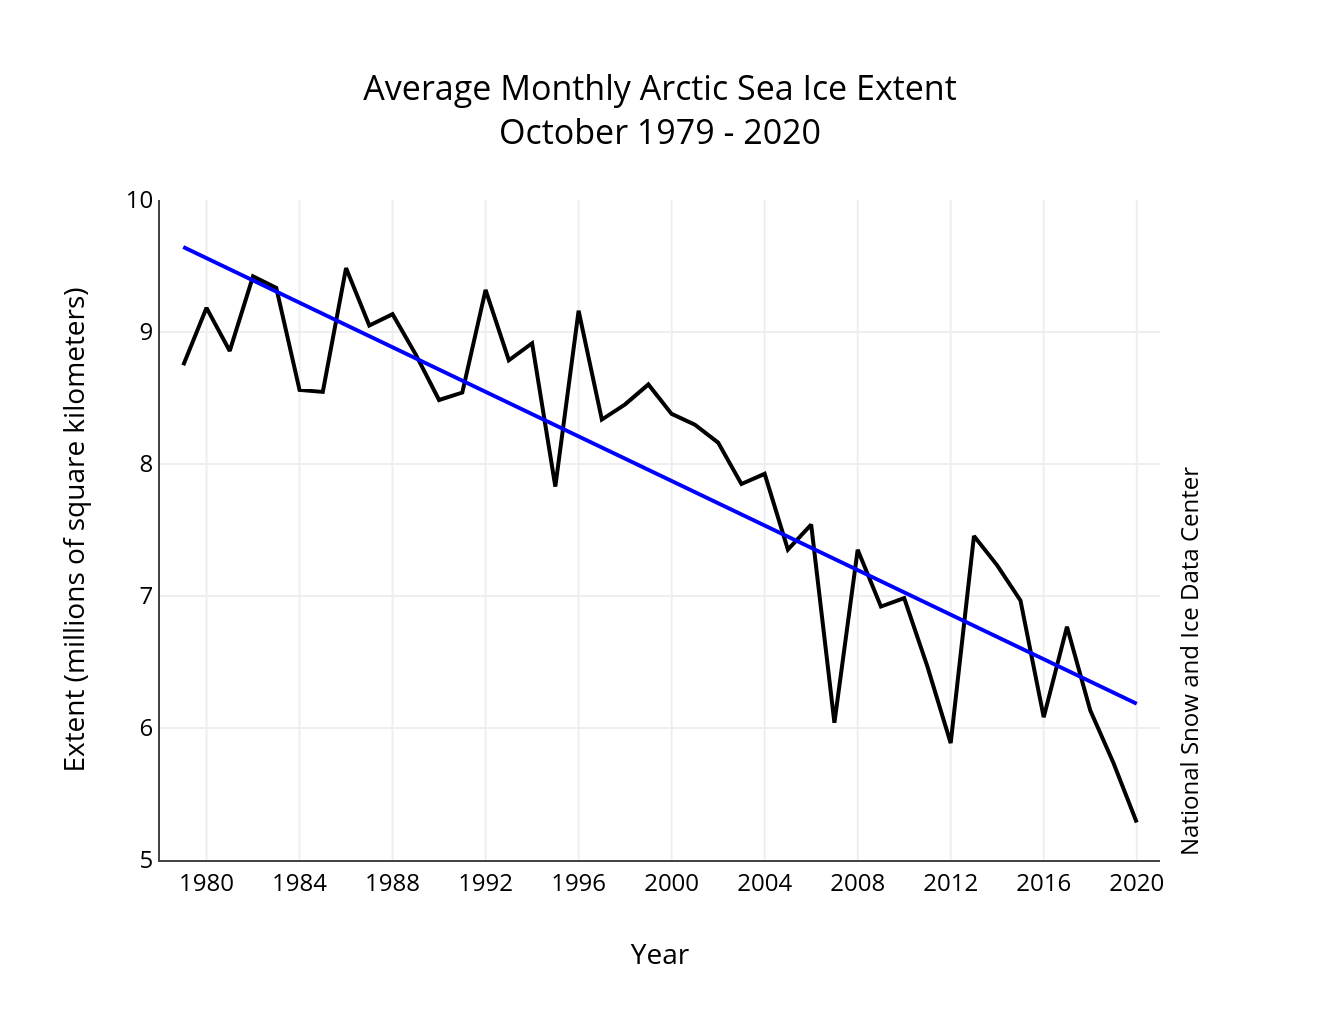
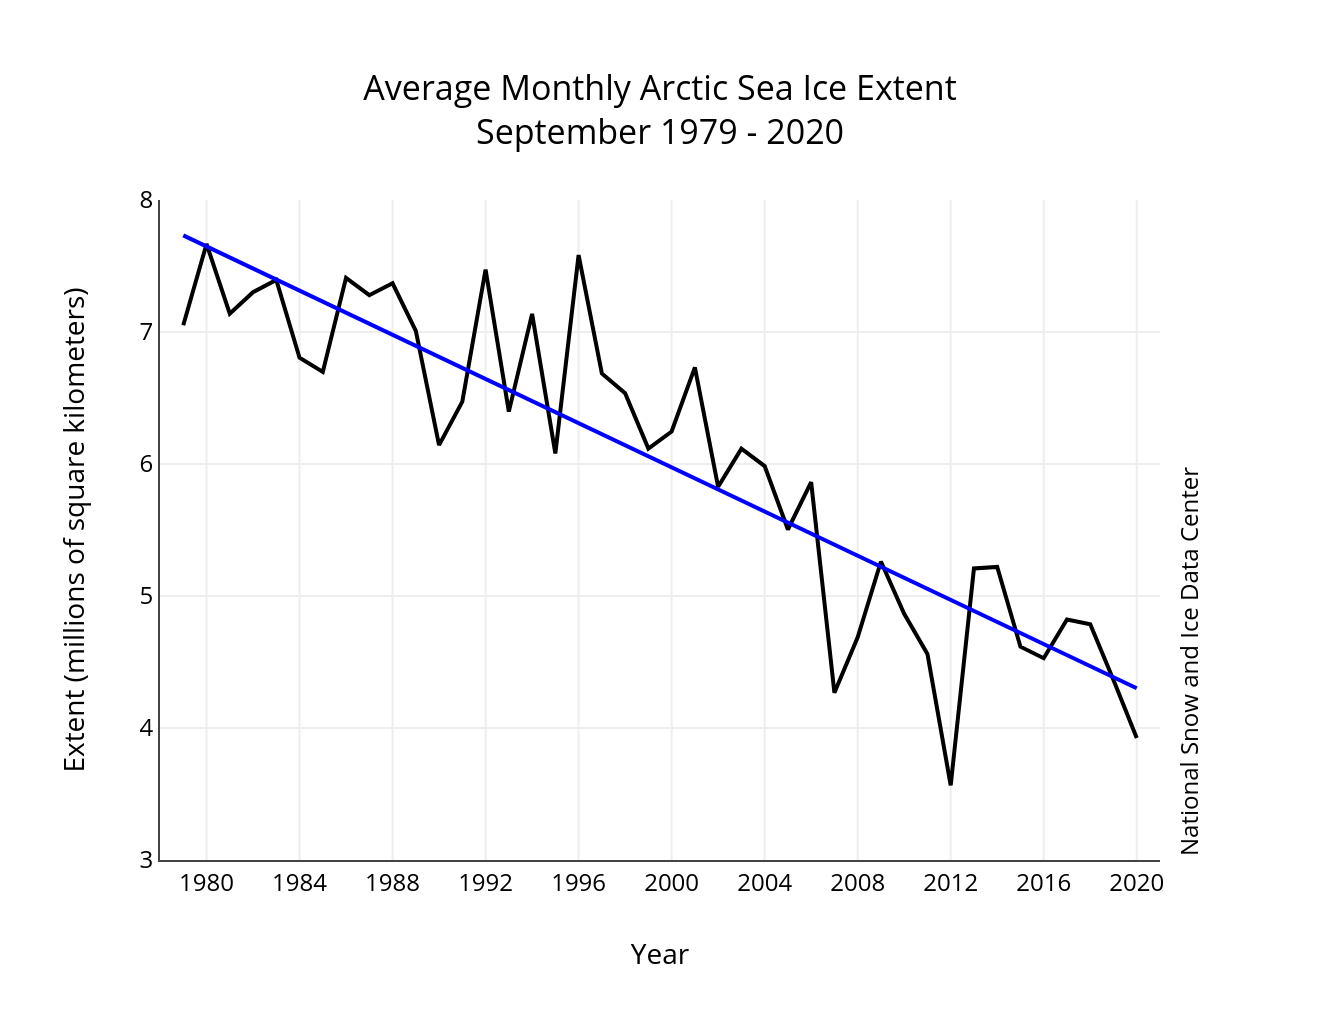
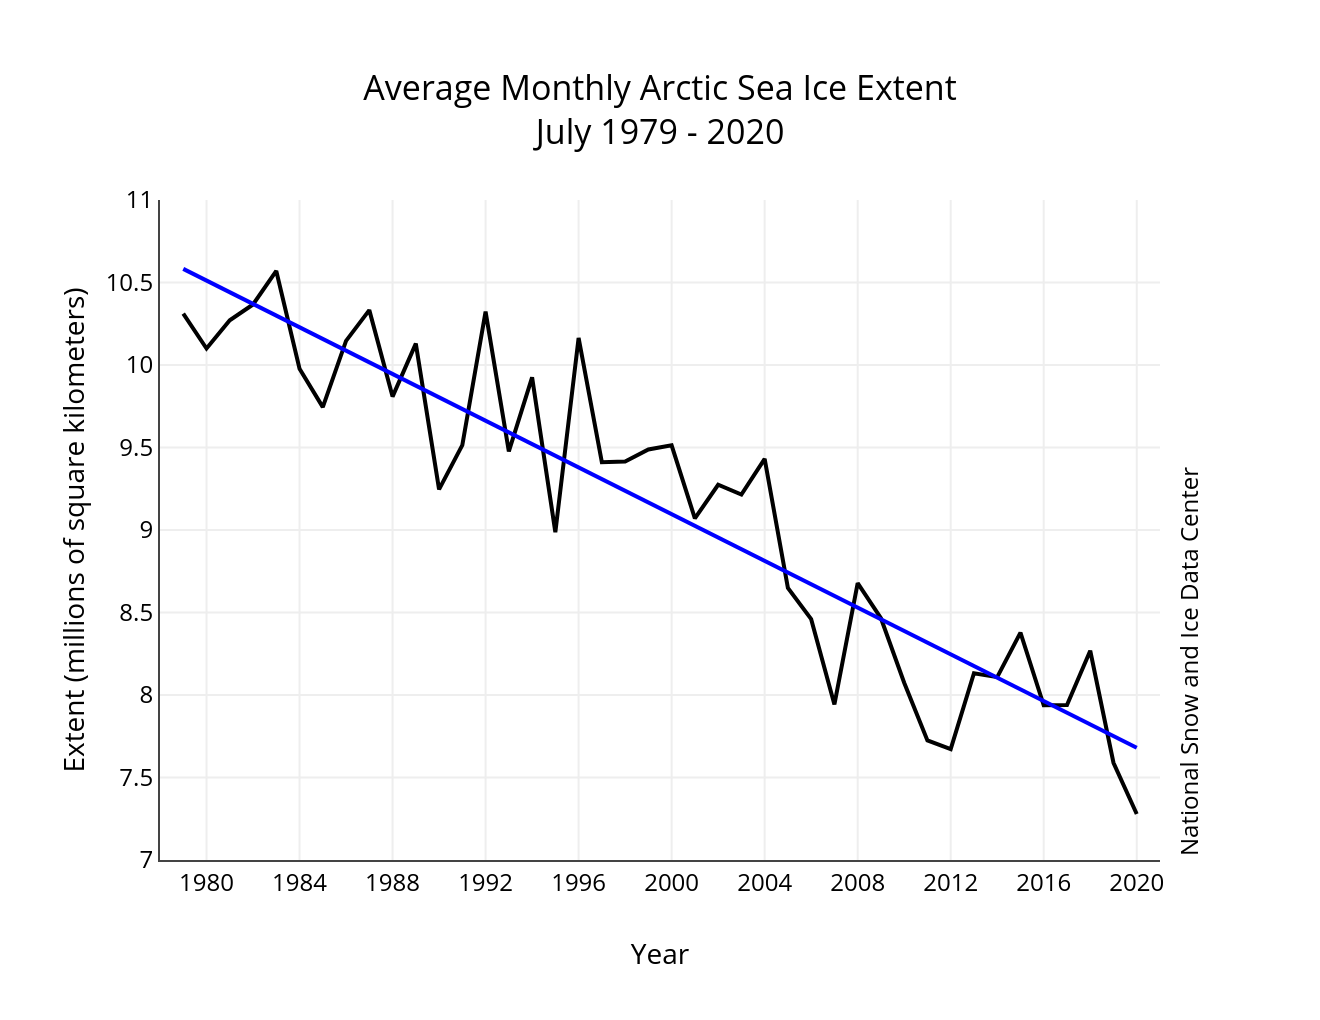
Figure 3. Monthly November ice extent for 1978 to 2020 shows a decline of 5.1 percent per decade.
Credit: National Snow and Ice Data Center
High-resolution image
Including 2020, the linear rate of decline for November sea ice extent is 5.1 percent per decade. This corresponds to a downward trend of 54,800 square kilometers (21,200 square miles) per year, or losing an area about the size of the state of West Virginia each year. Over the 42-year satellite record, the Arctic has lost about 2.30 million square kilometers (888,000 square miles) of ice in November, based on the difference in linear trend values in 2020 and 1978. This is comparable to about three times the size of Texas.
42 years of satellite data
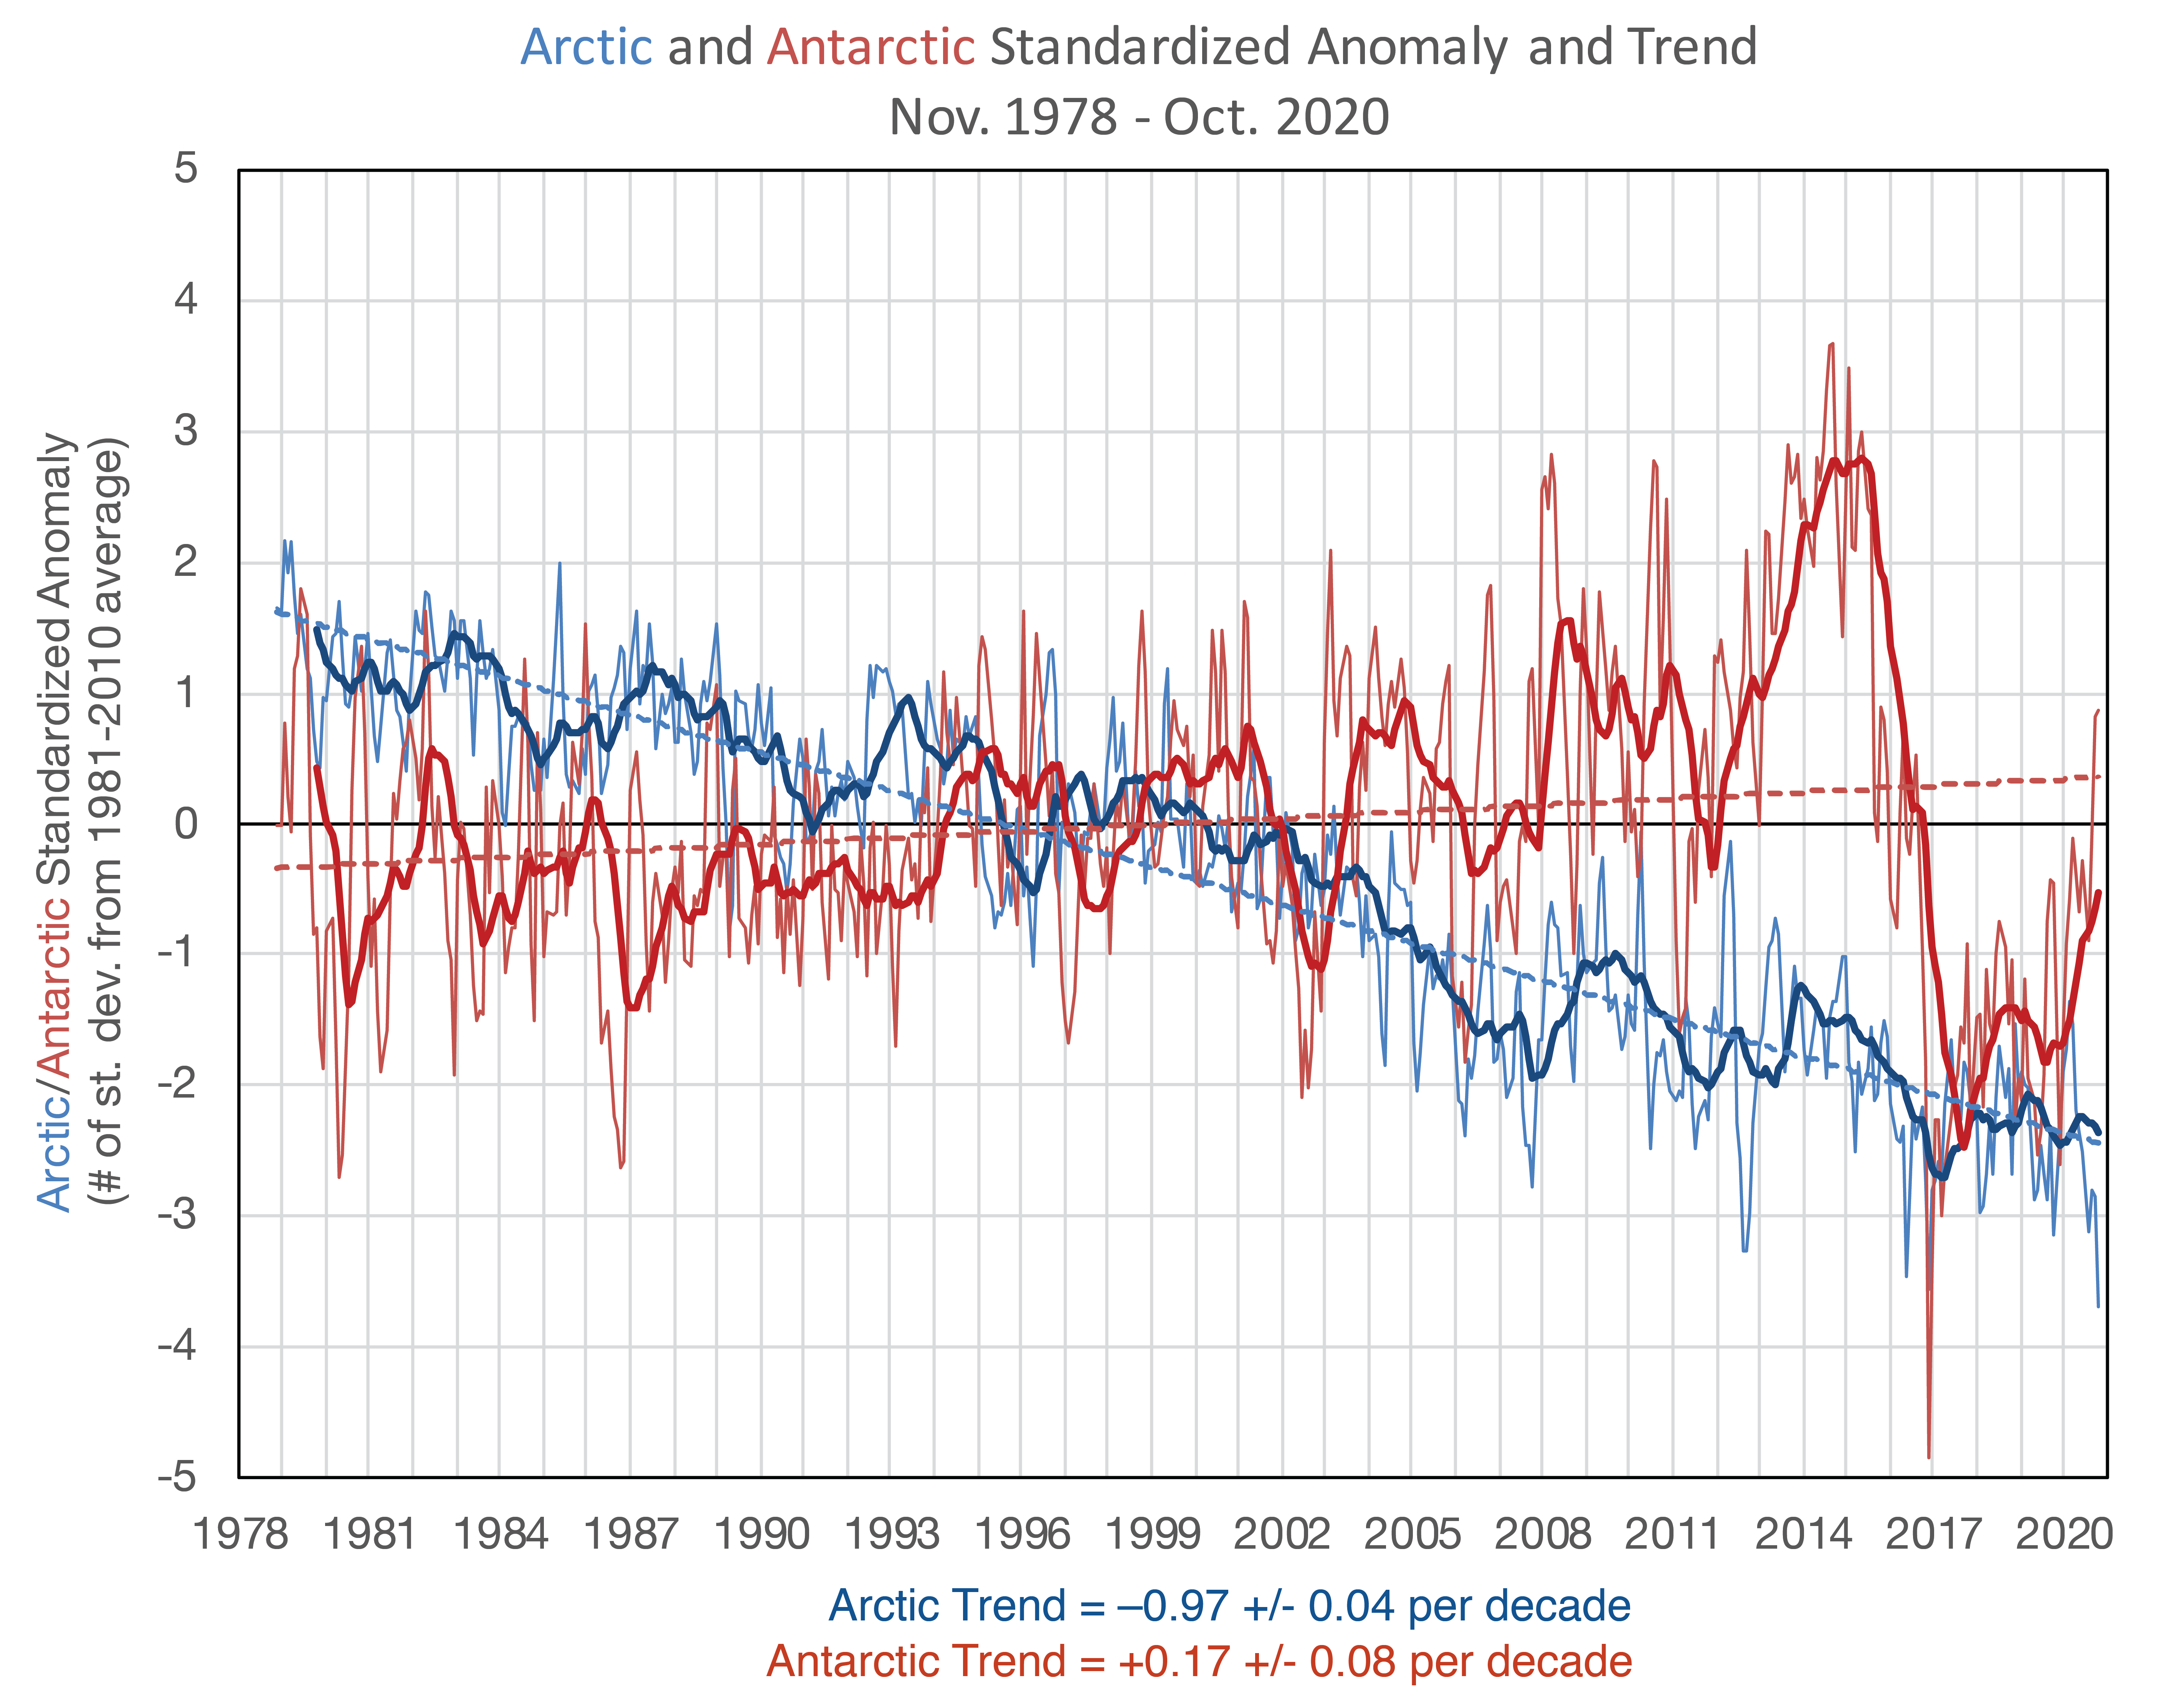
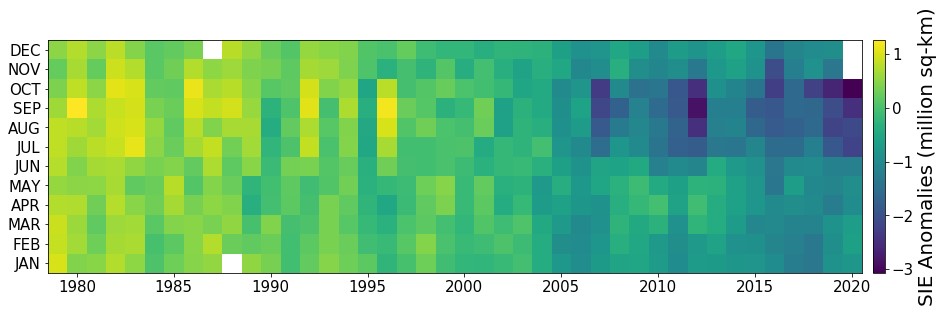
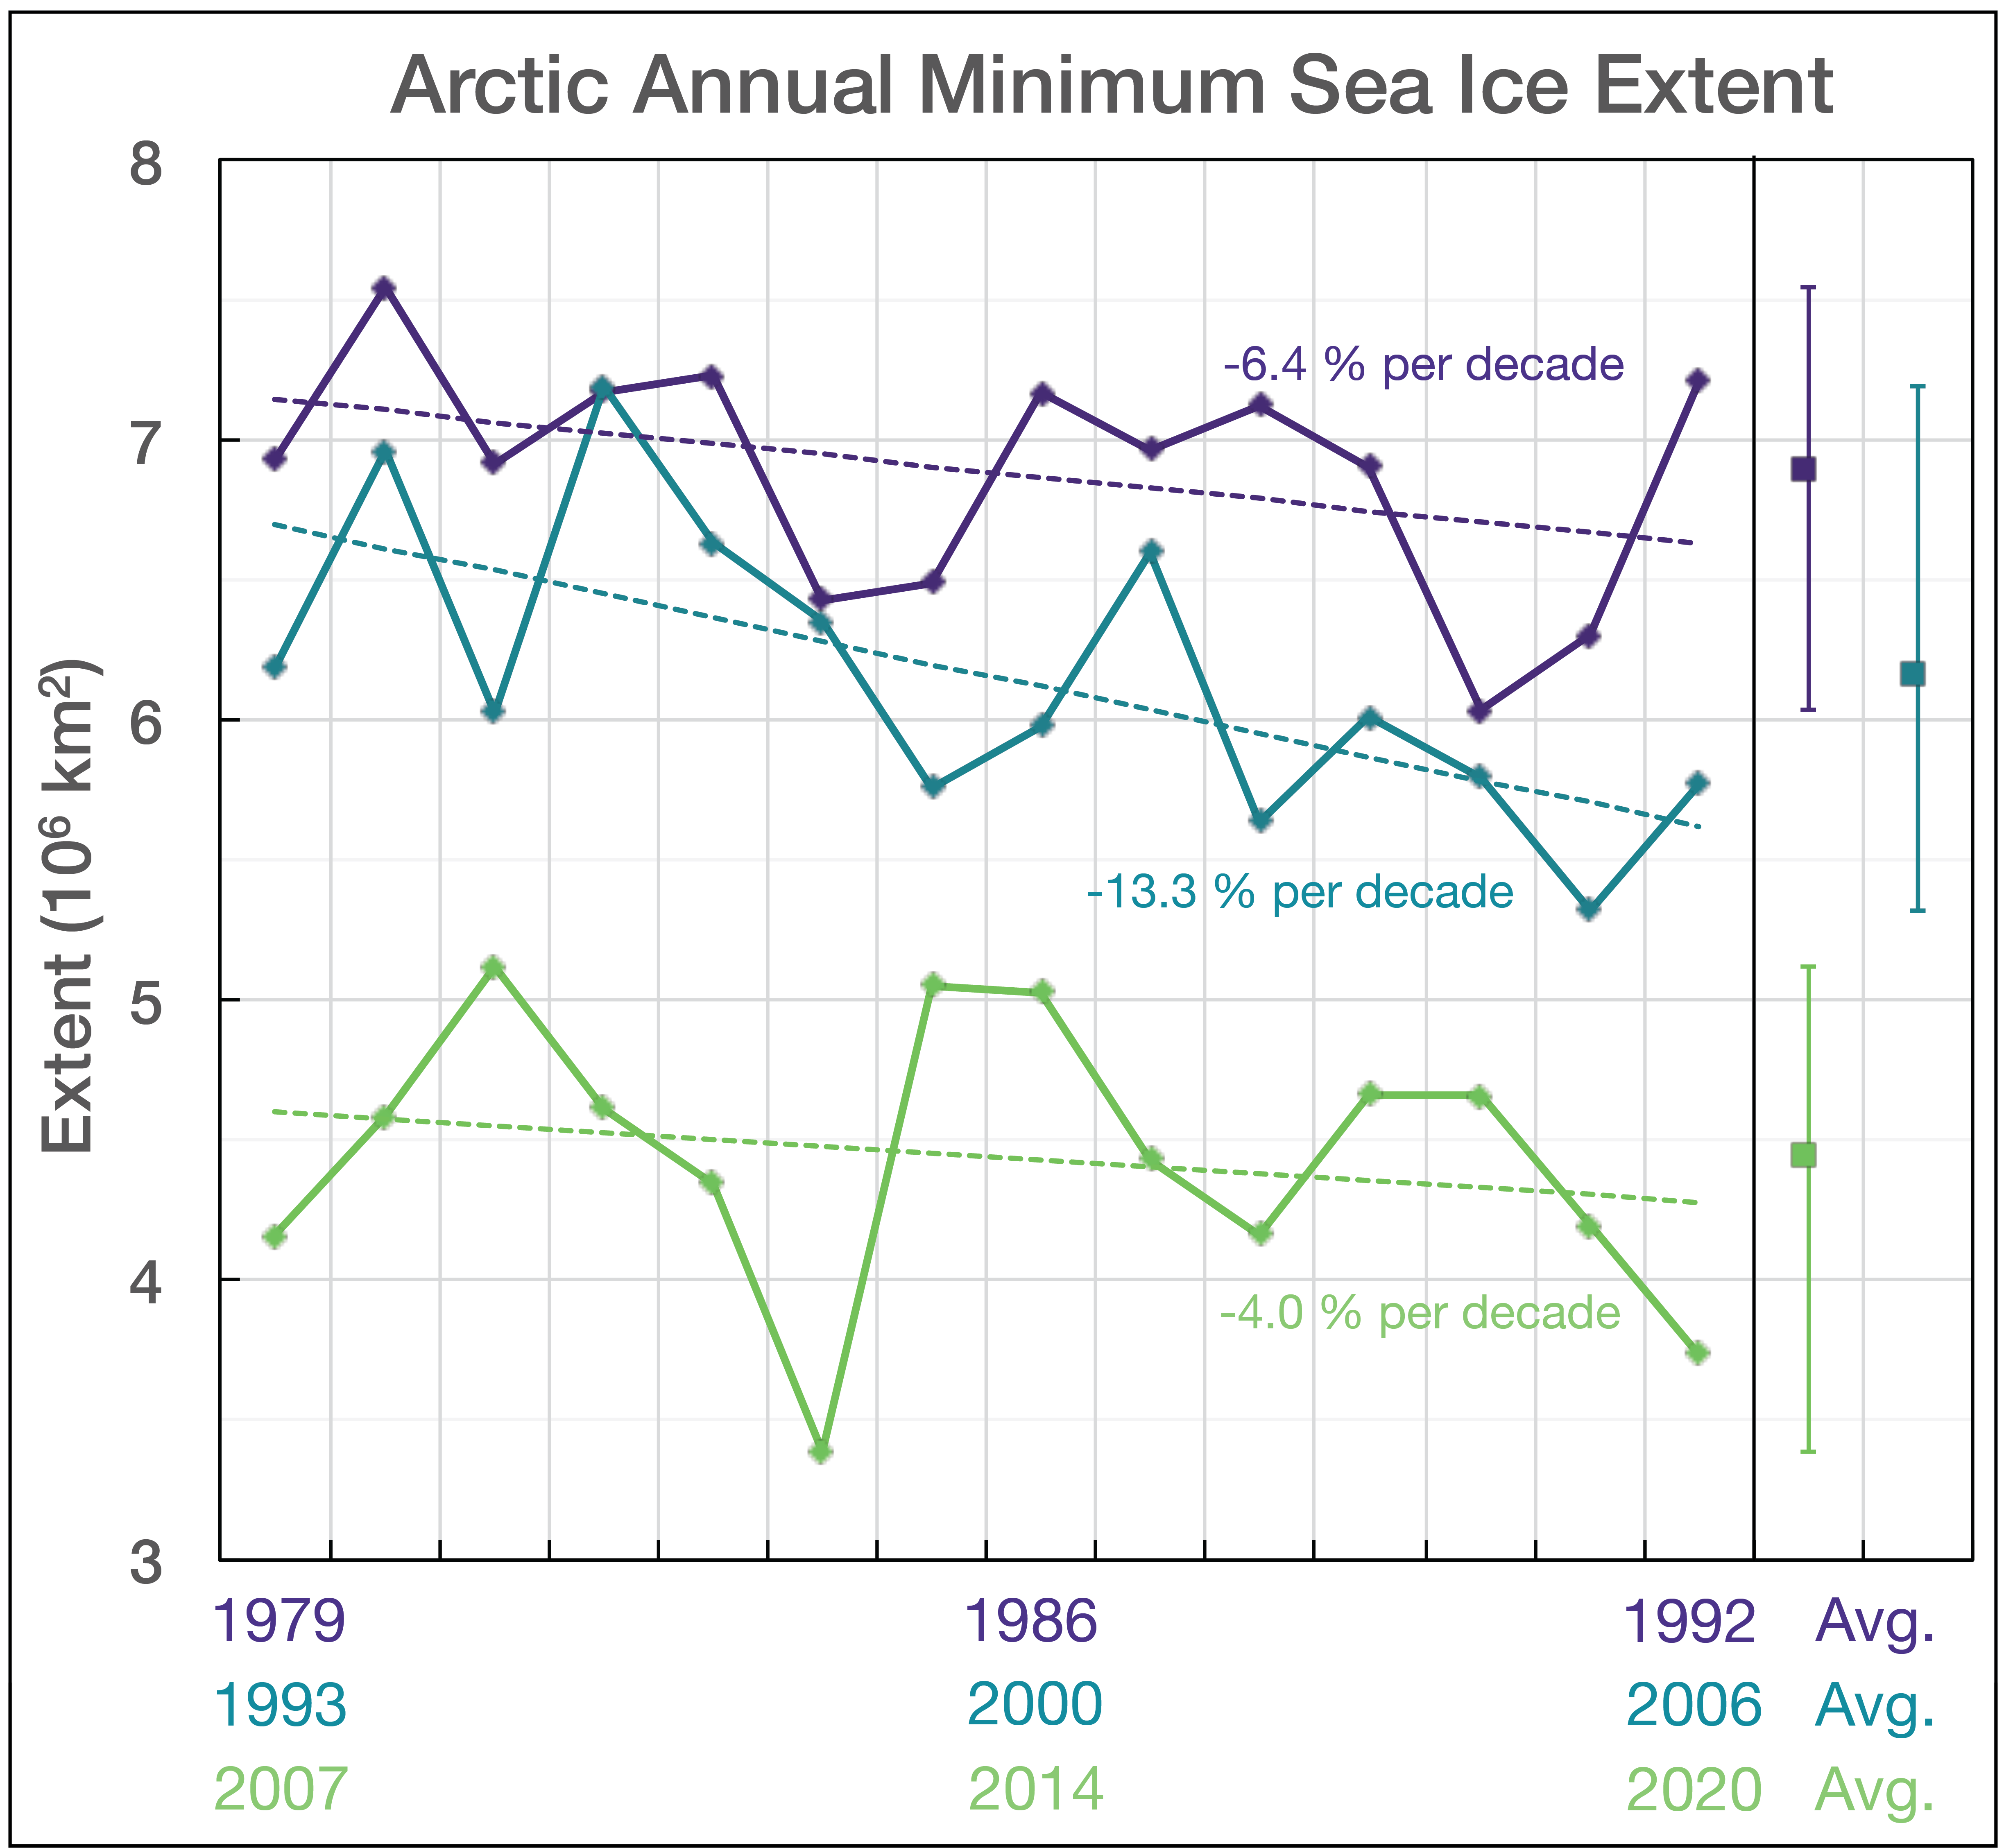
Figure 4. This graph shows monthly extent (thin lines) for Arctic (blue) and Antarctic (red) and 12-month trailing average (thick lines) for standardized anomalies (departure from the 1981 to 2010 average in each month divided by the 1981 to 2010 standard deviation for the month). The linear trend is overlaid in dashed lines. The trend values are provided below the plot, in number of standard deviations per decade with the +/- 95 percent confidence level; both trends are statistically significant.
Credit: W. Meier, NSIDC
High-resolution image
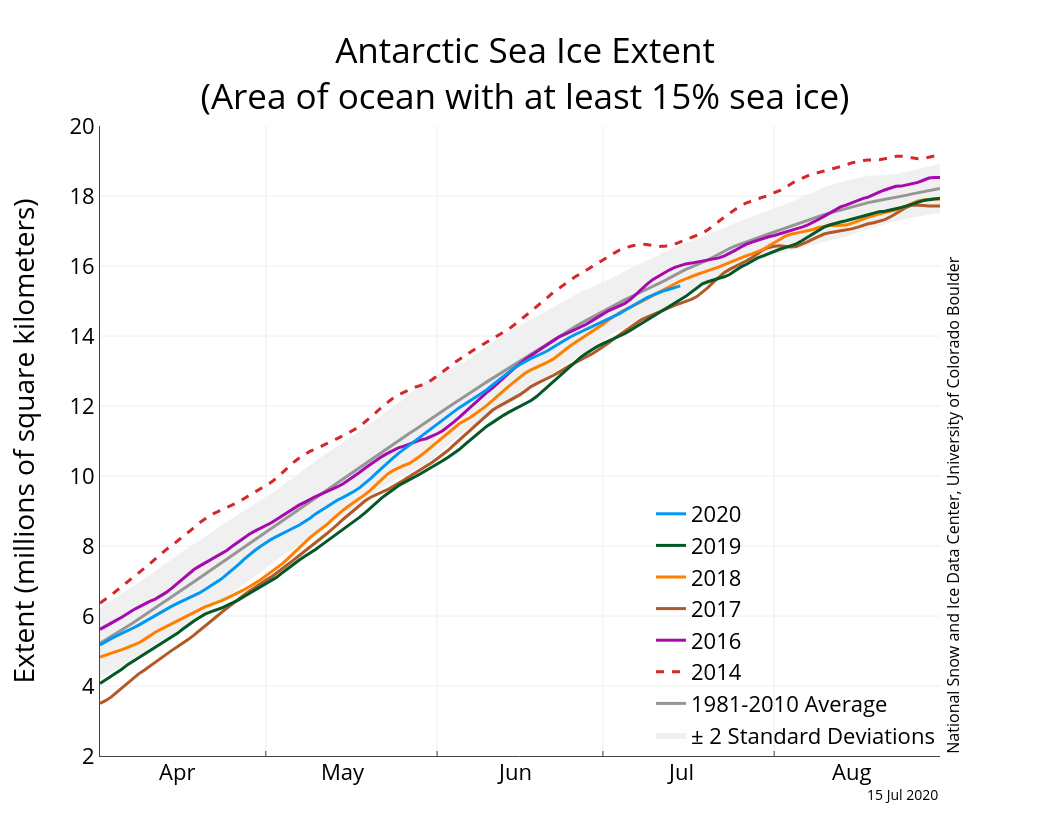
The modern passive microwave satellite data started in late October 1978. November 2020 marks the start of 43 years of continuous and consistent observation of sea ice concentration and extent. The first 42 years of monthly extents from November 1978 through October 2020 provide a comparison of the trends and variability in the Arctic and Antarctic sea ice extent. By comparing each month’s departure from the 1981 to 2010 average for that month, the variability of sea ice extent becomes strongly evident (Figure 4). Here we remove the seasonal cycle of sea ice extent by dividing the departure from average of each month in the satellite record by the standard deviation of each month, both based on the climatological period of 1981 to 2010. The result is a time series of the number of standard deviations each month’s extent in the record is above or below the average. The plot for the Arctic reveals a clear downward trend with some monthly and annual variations. Overall, the Arctic ice extent has decreased by 0.97 standard deviations per decade. By contrast, the Antarctic ice extent is dominated by a lot of variation with a positive trend of 0.17 standard deviations per decade. The magnitude of the Arctic trend is hence roughly five times of the Antarctic trend. The large Antarctic variation is marked particularly by the dramatic reversal from record high extents in 2014 and 2015 to record low extents in 2016 and 2017. Since then, the extent has moderated to near-average conditions.
Antarctica: More ice, sparse ice, and Maud’s back
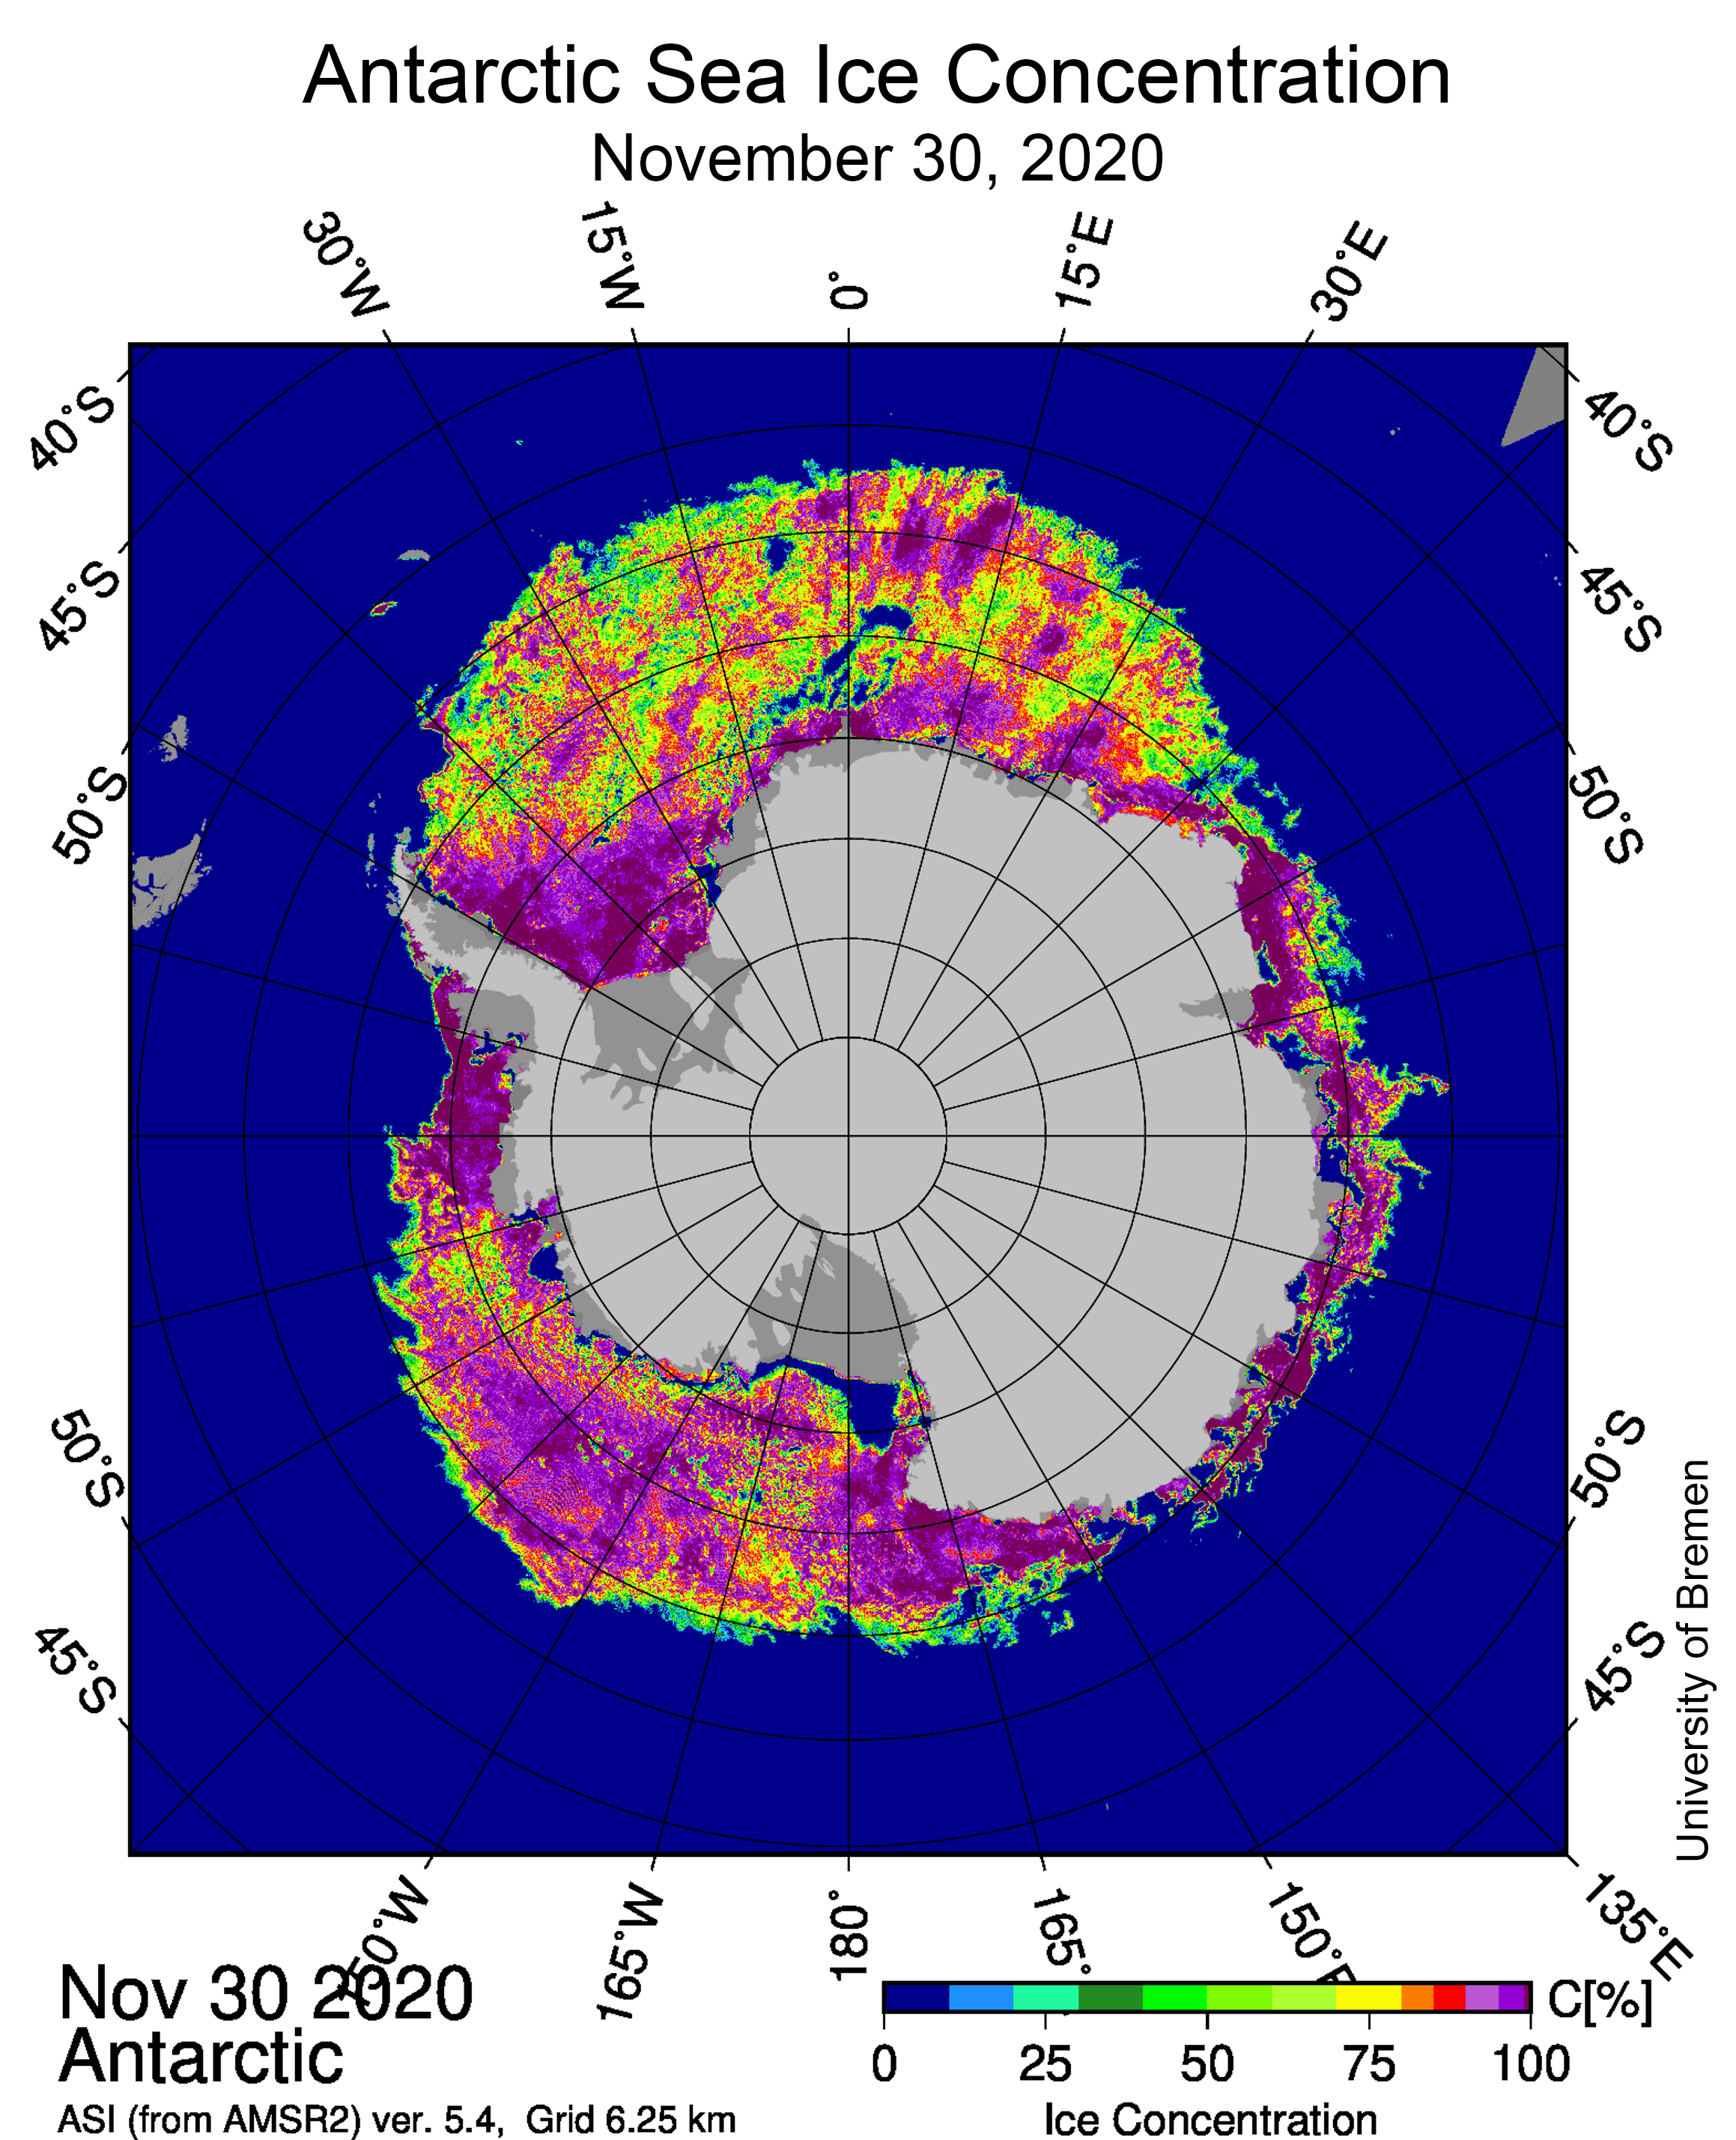
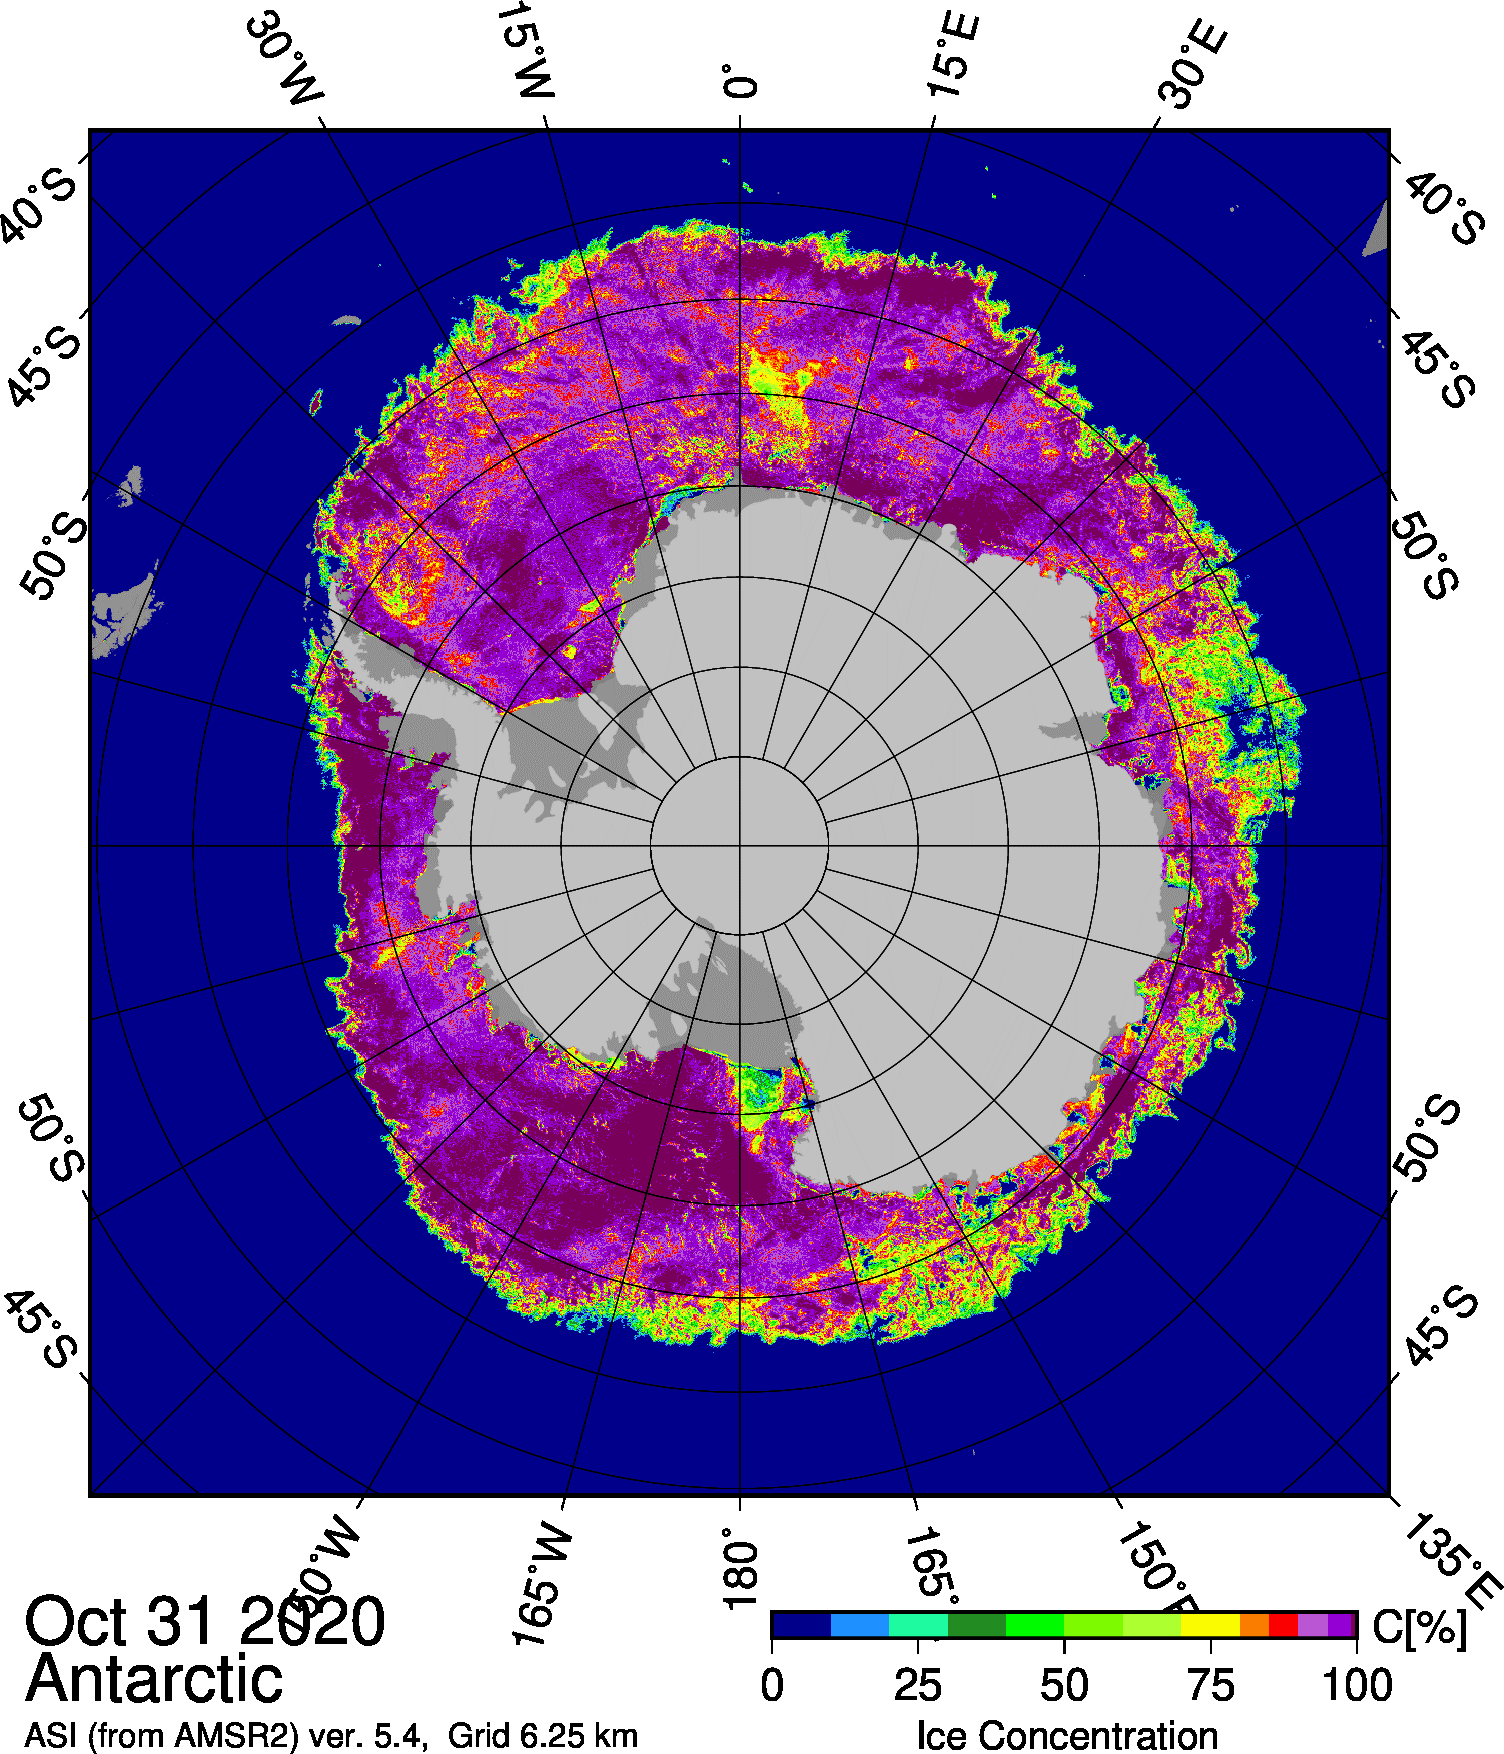
Figure 5. This map of Antarctica show sea ice concentration on November 30, 2020. The Japanese Aerospace Exploration Agency (JAXA) Advanced Microwave Scanning Radiometer-2 (AMSR2) shows a range from 0 percent (dark blue) to 100 percent (dark purple) in sea ice concentration. Several small shore polynyas, or openings in sea ice, are visible along the East Antarctic coast.
Credit: University of Bremen
High-resolution image
Antarctic sea ice extent for November 2020 continues to be well above the 1981 to 2010 average, a shift that began in August, with particularly above average extent in the Weddell Sea. However, low sea ice concentration dominates a large area of the Weddell Sea (Figure 5). Also notable is the retreat of ice along the eastern shore of the Antarctic Peninsula, a result of several warm chinook wind events off the Peninsula earlier in November. These strong winds blast warm and dry air downhill, pushing sea ice a tens of kilometers off the coast. On the western side of the Antarctic Peninsula, the reduced sea ice extent in the Bellingshausen Sea and its sharp ice edge add further evidence of strong winds from the northwest. The adjacent Amundsen Sea and Ross Sea have above average ice extent, while below average extent is the rule along the Wilkes, Adelie, and Enderby Land coasts. Numerous small shore polynyas, or openings in sea ice, typical for this time of year, are present along the East Antarctic coast.
There are also open water areas in the Maud Rise region, initiating a few degrees east of the prime meridian and around 64 degrees S latitude. This recurring polynya reopened, where sea ice concentration dropped below 15 percent, on November 26, as well as a second less common polynya several hundred kilometers to the north and west.


