The longest day of summer has come and gone, and summer melt is in full swing, with the pace of ice loss overall about average for this time of year. Arctic sea ice extent for June was not exceptionally low compared to other recent years. Antarctic sea ice extent continues to track at record low values.
Overview of conditions
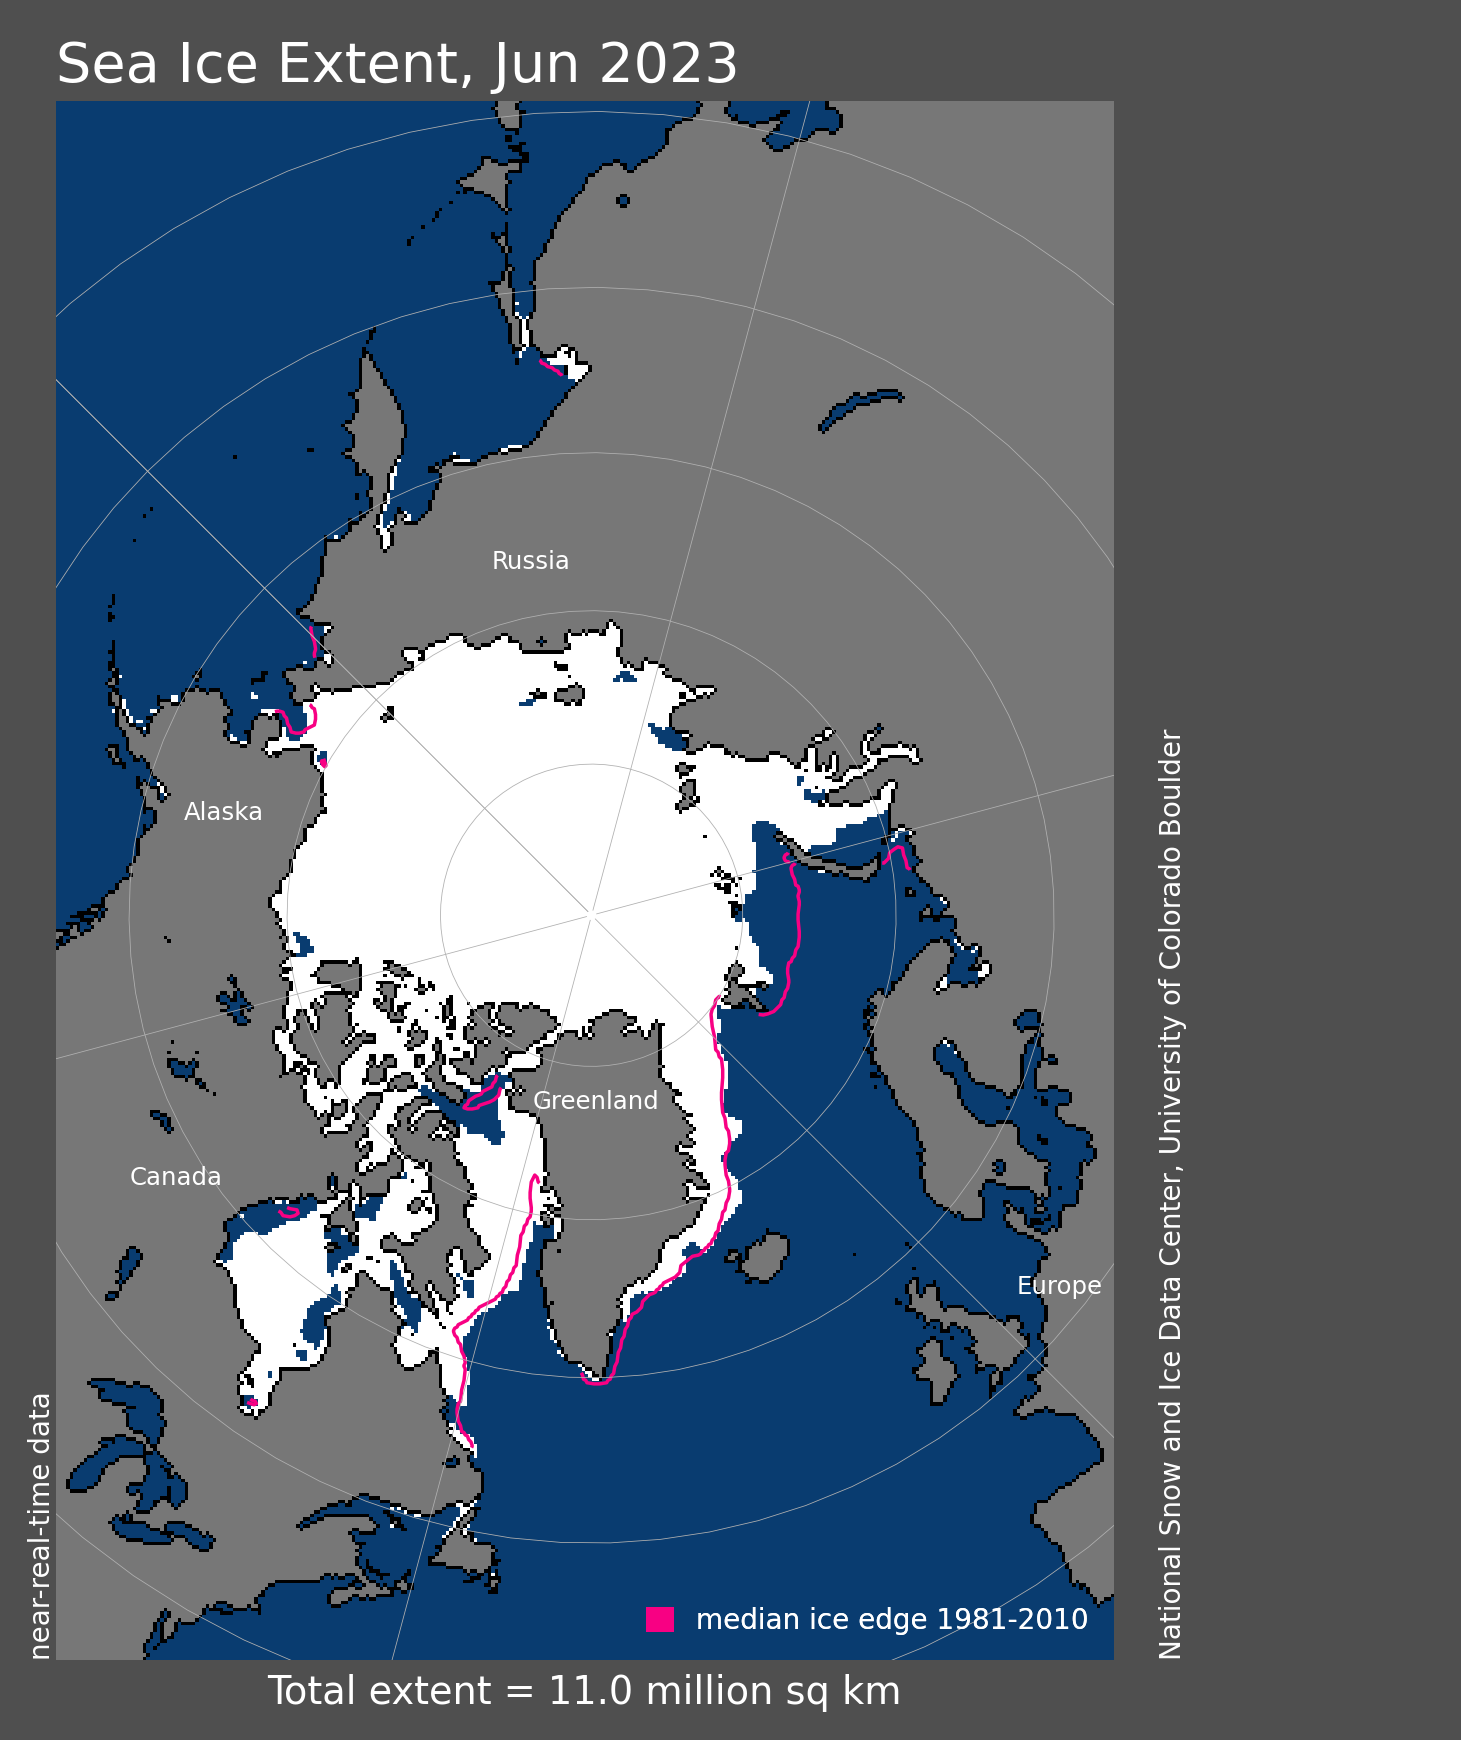
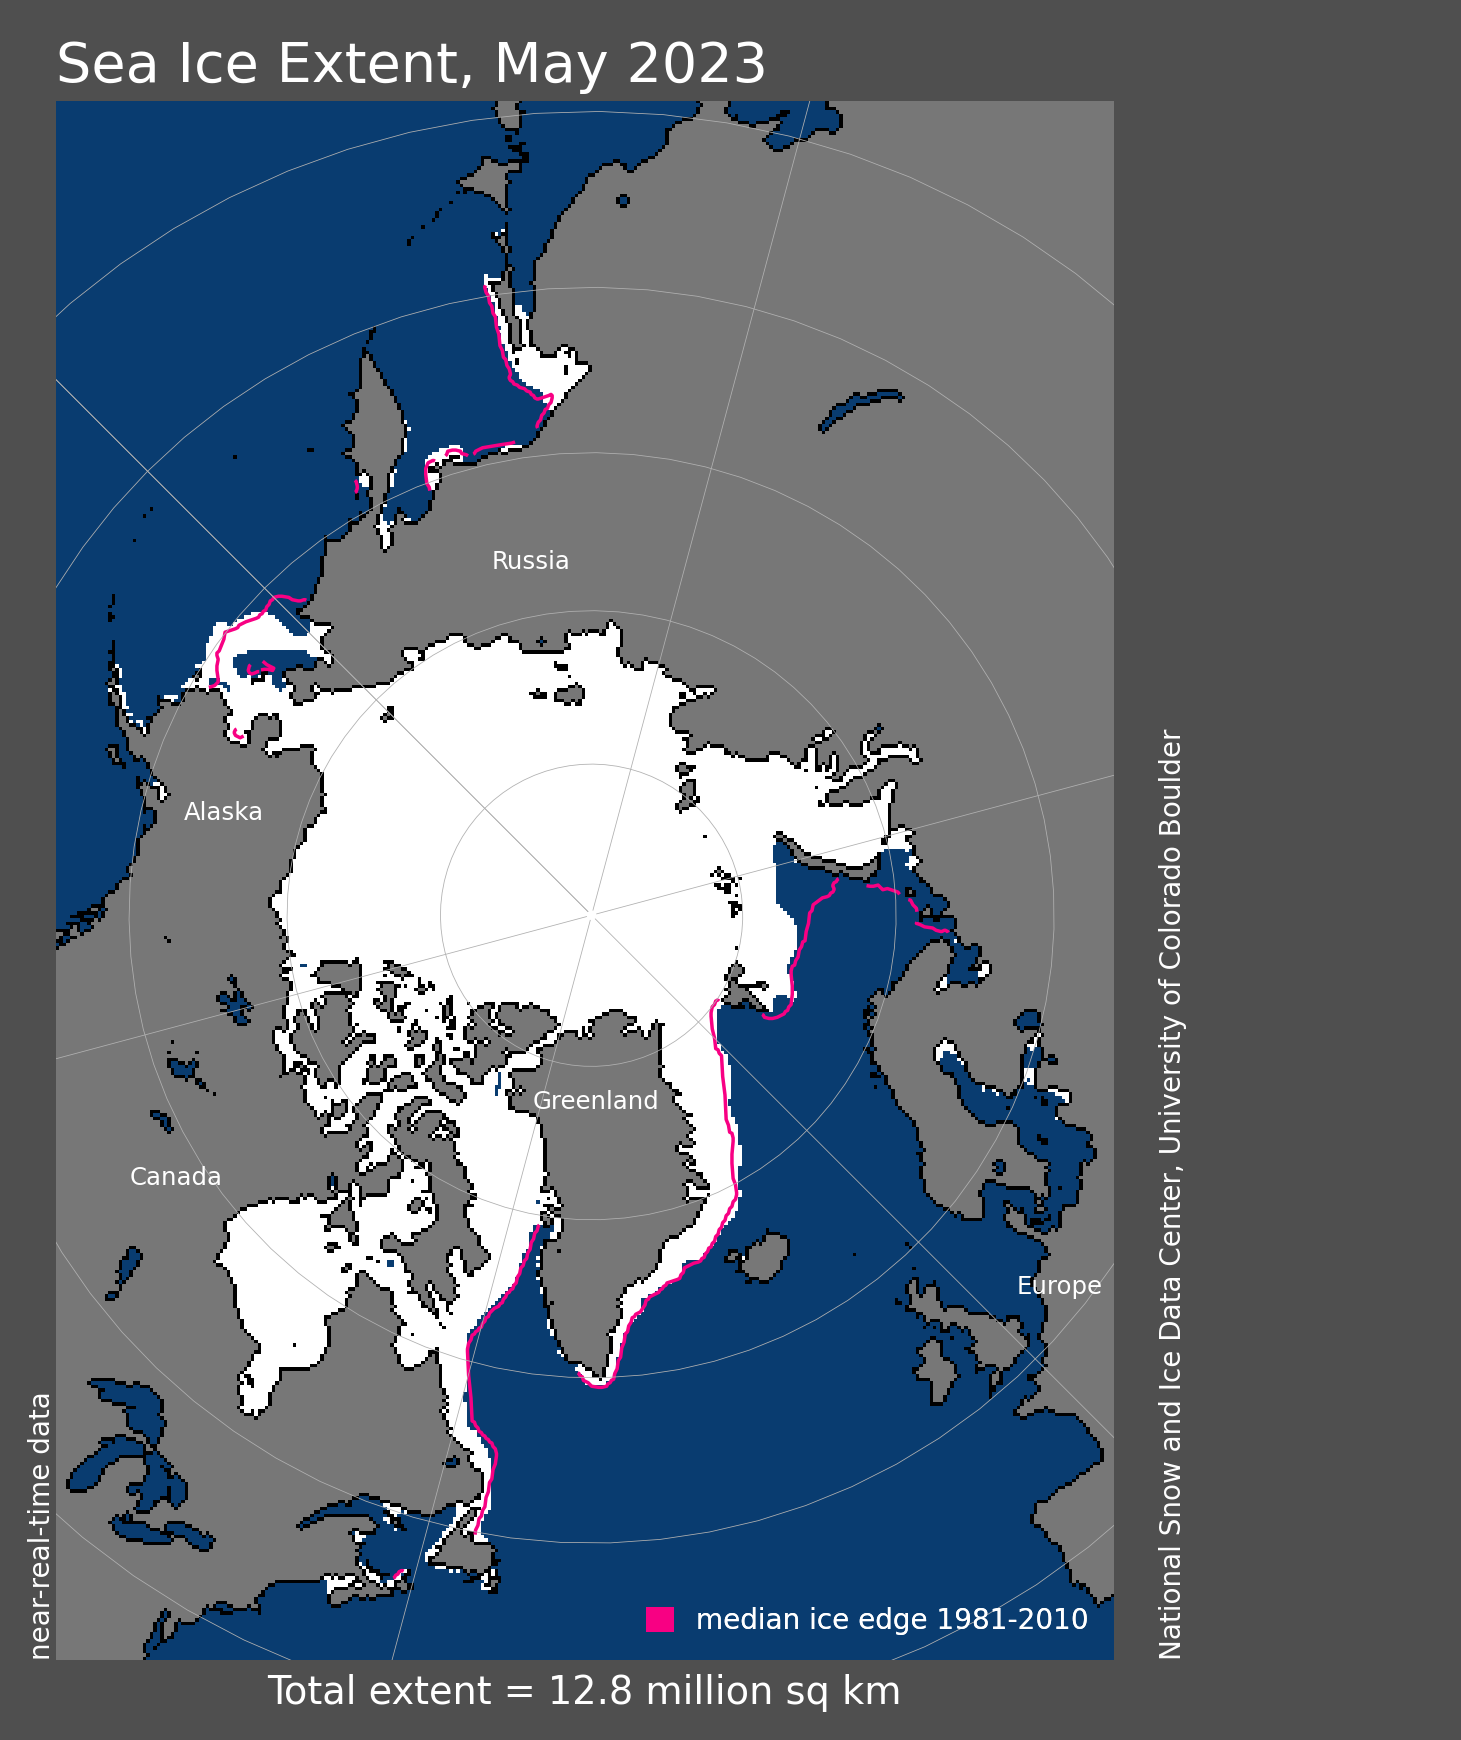
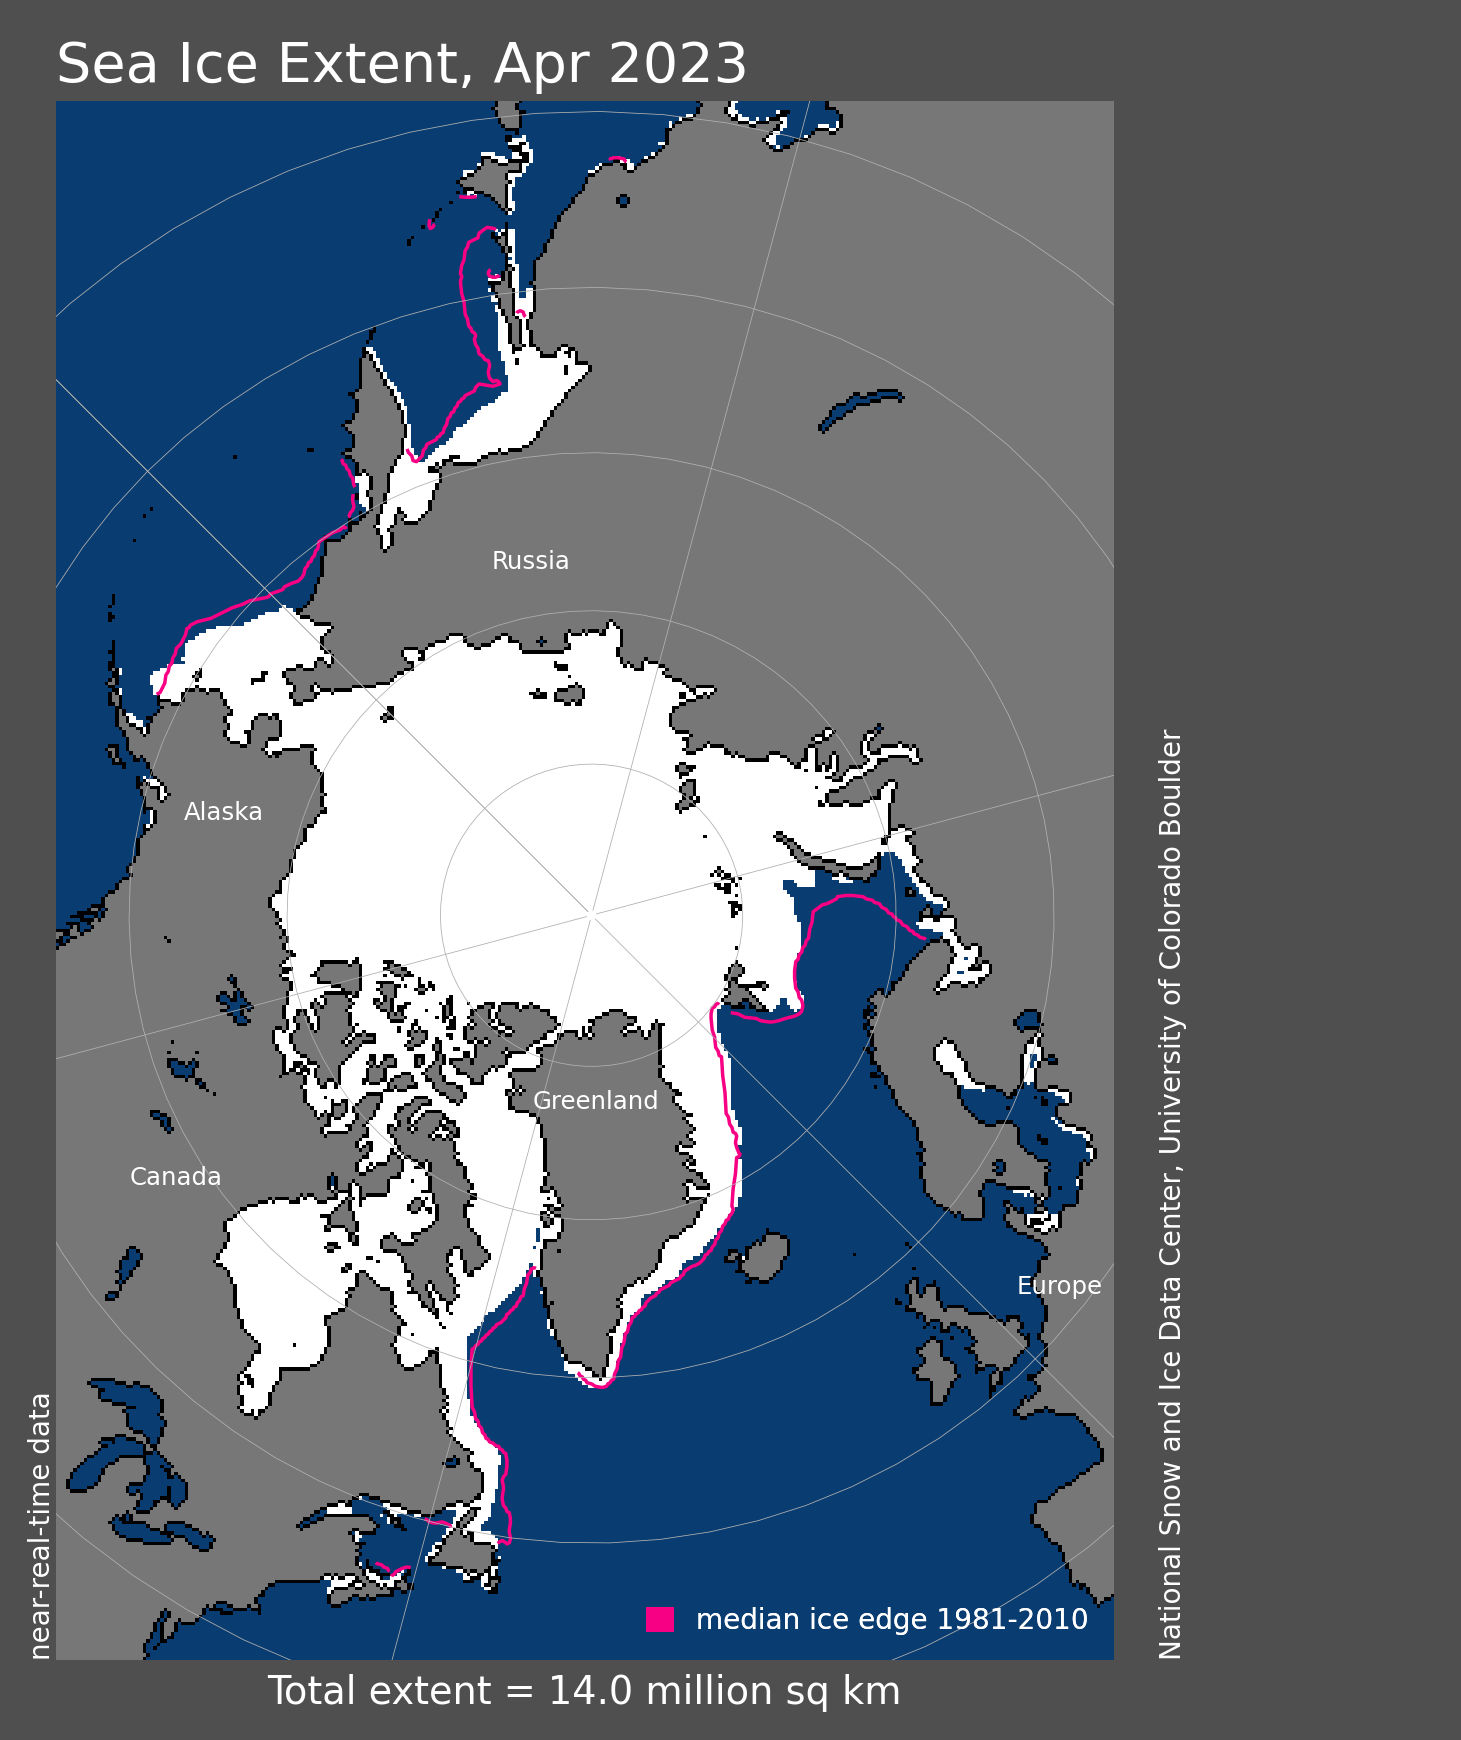
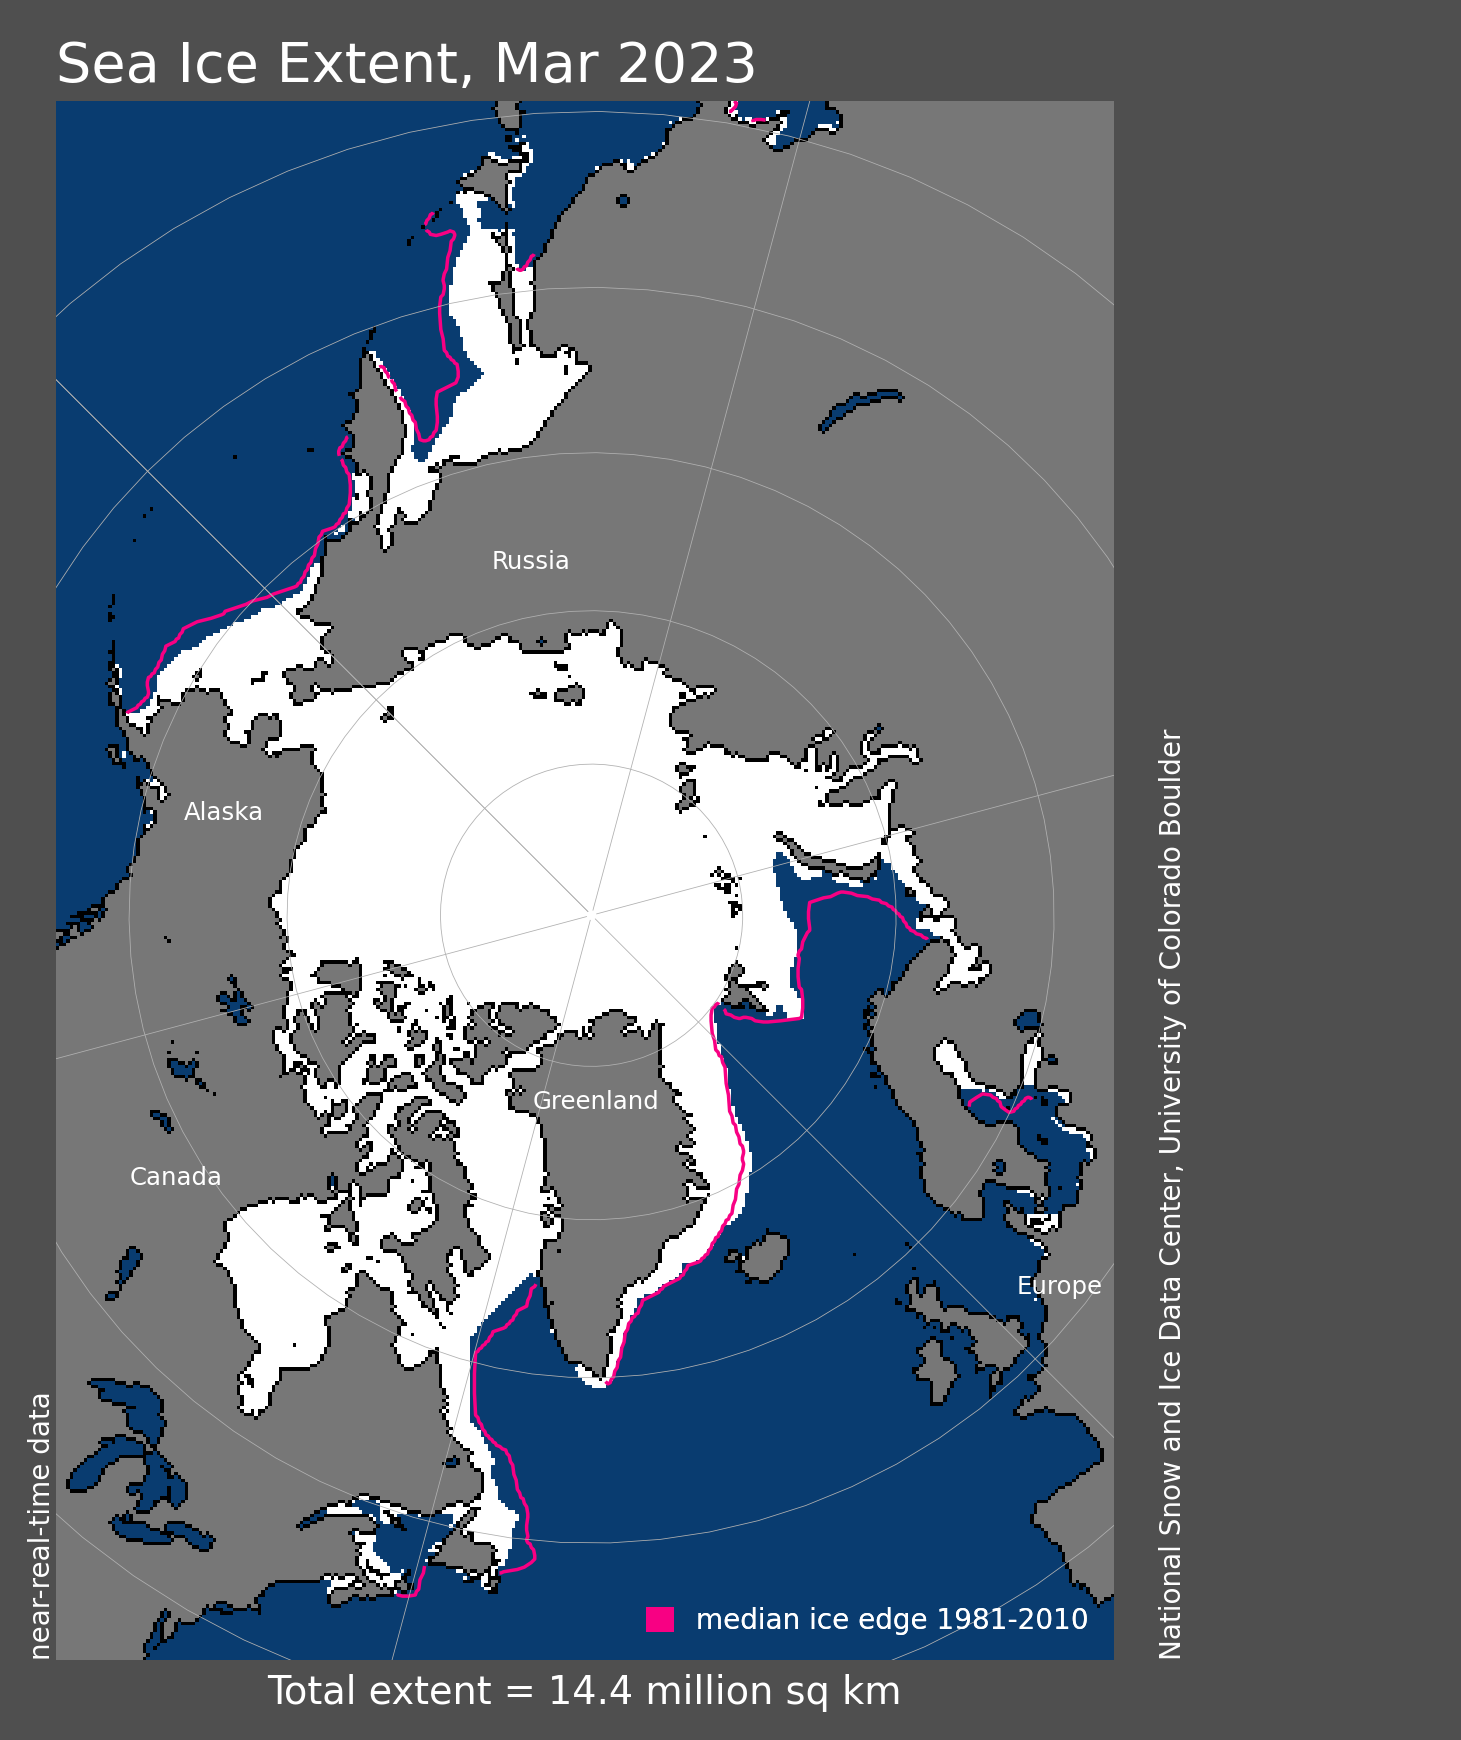
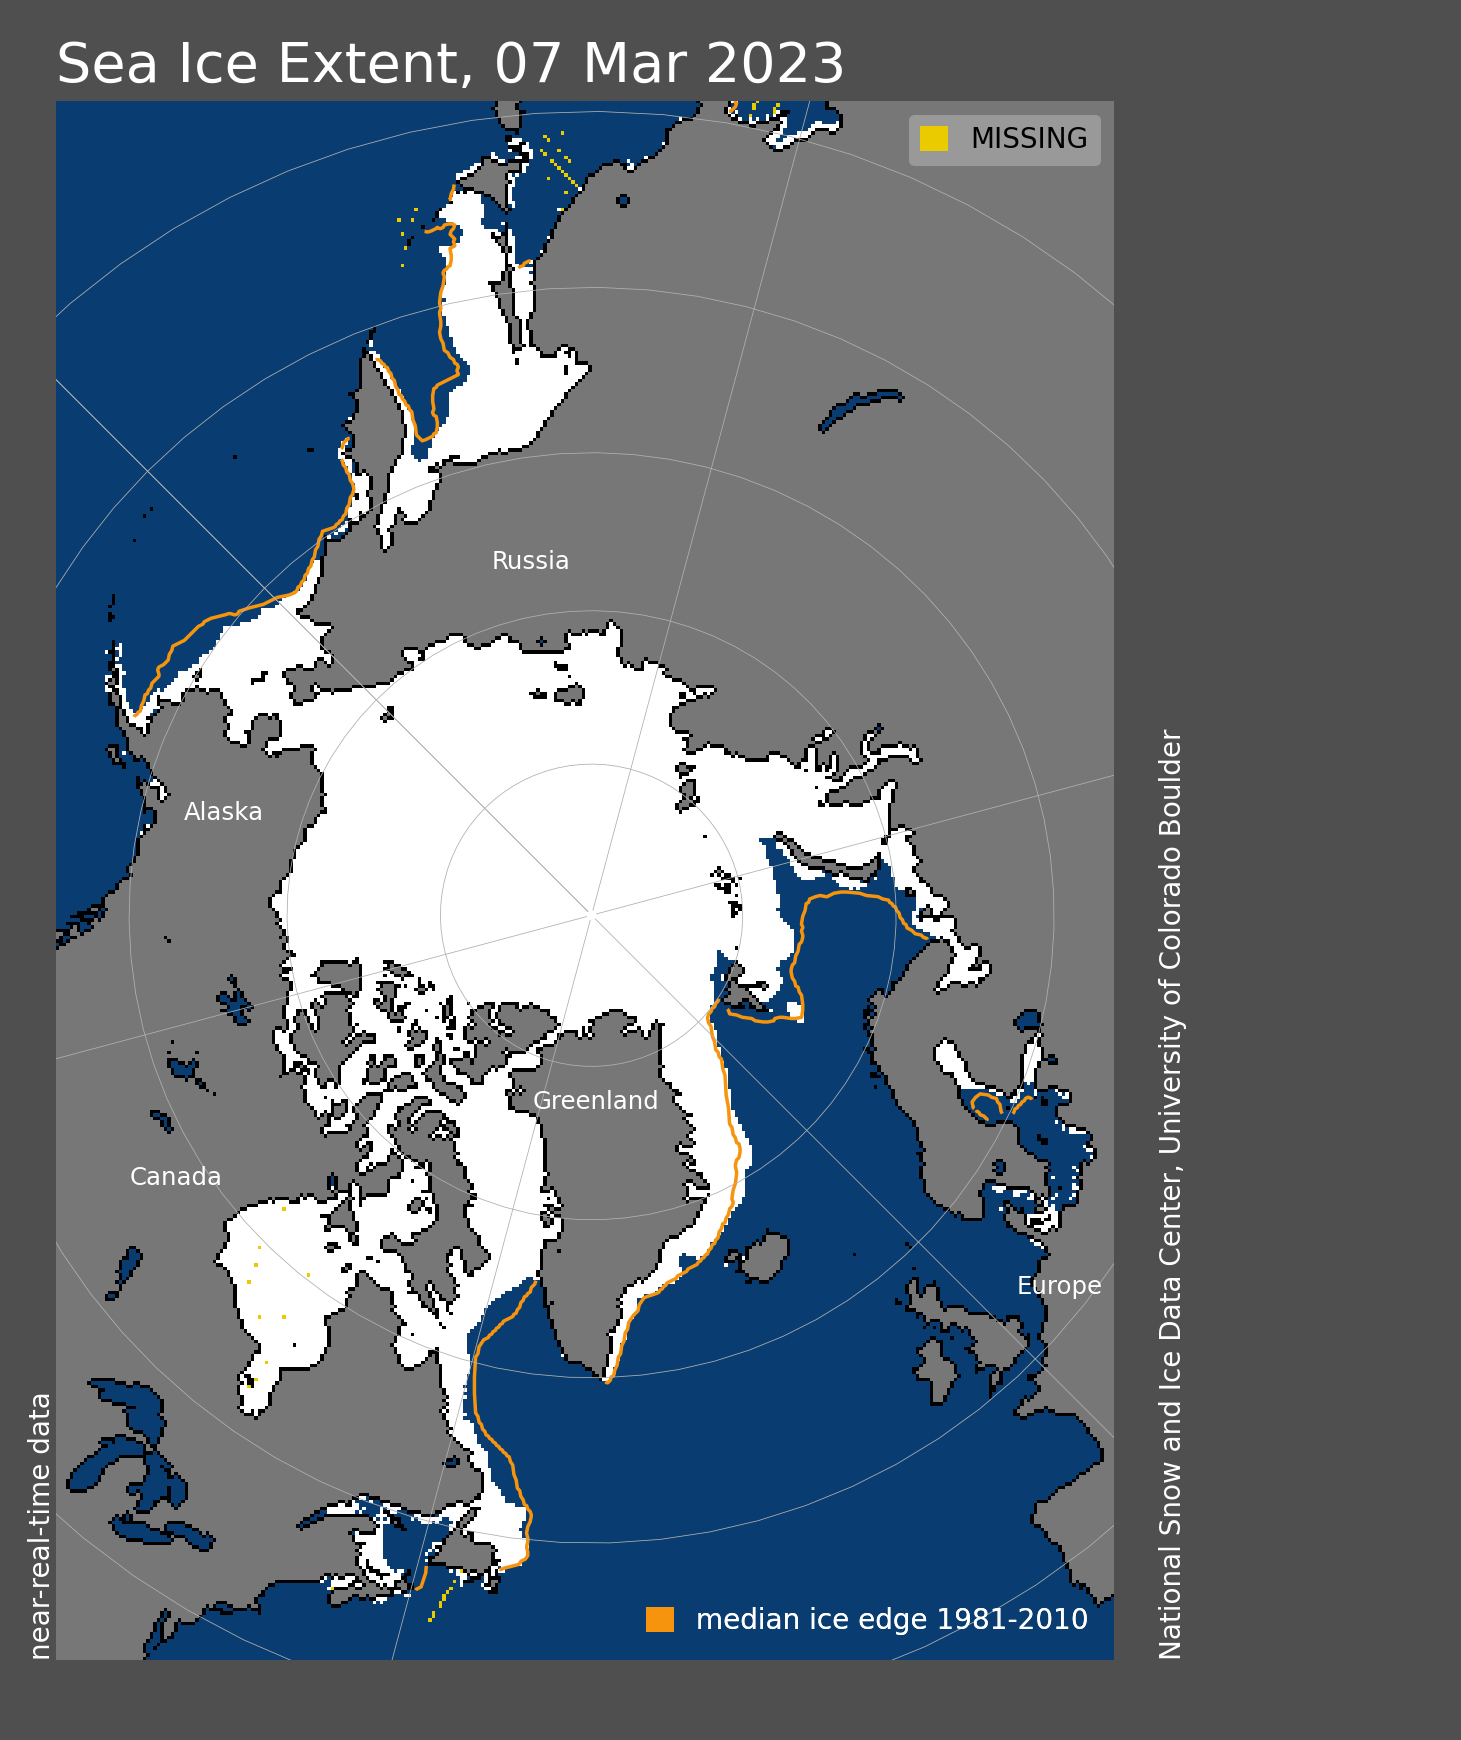
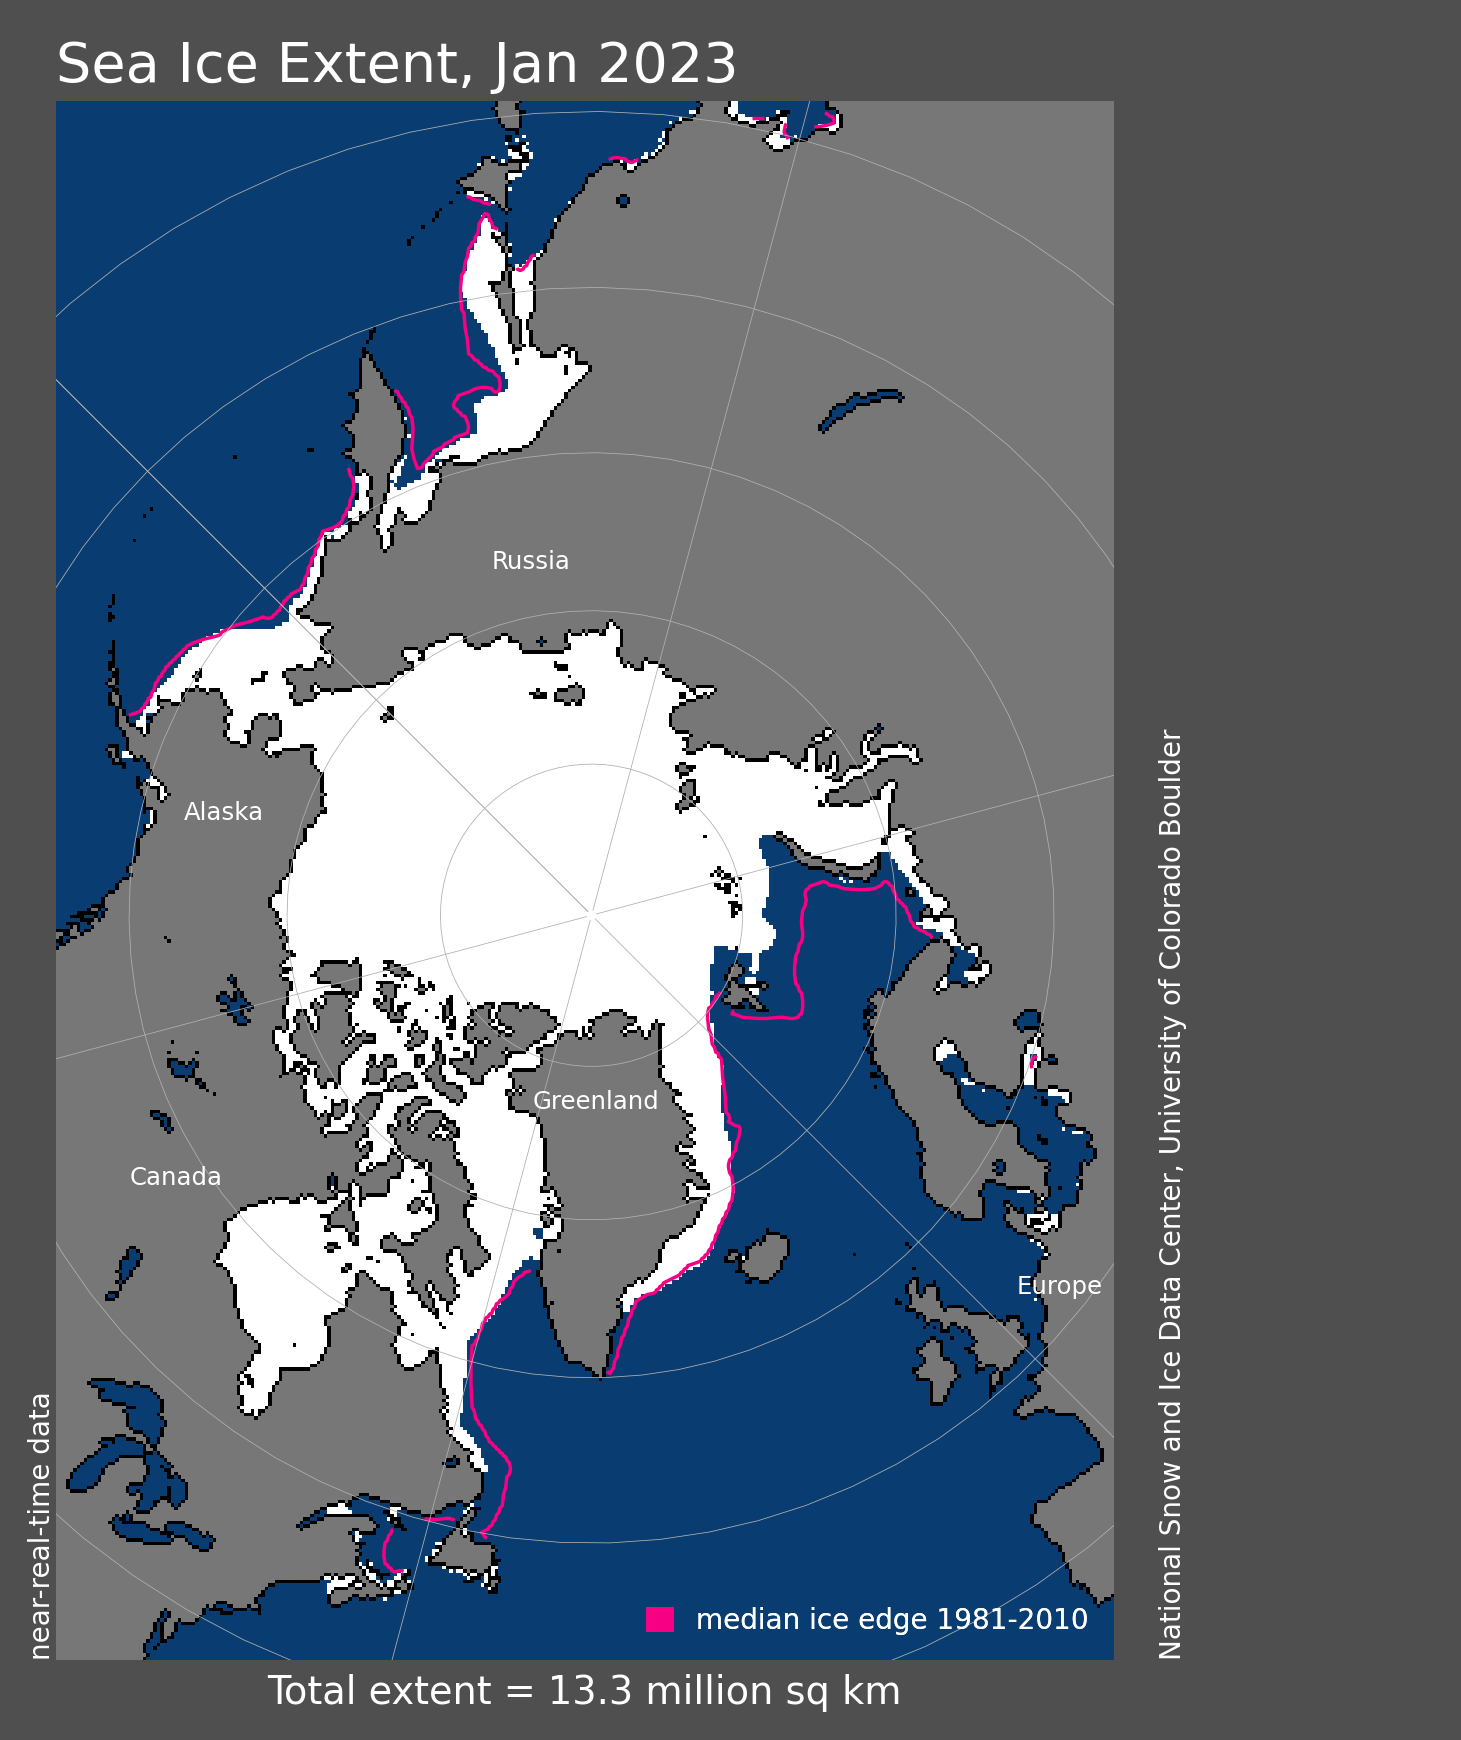
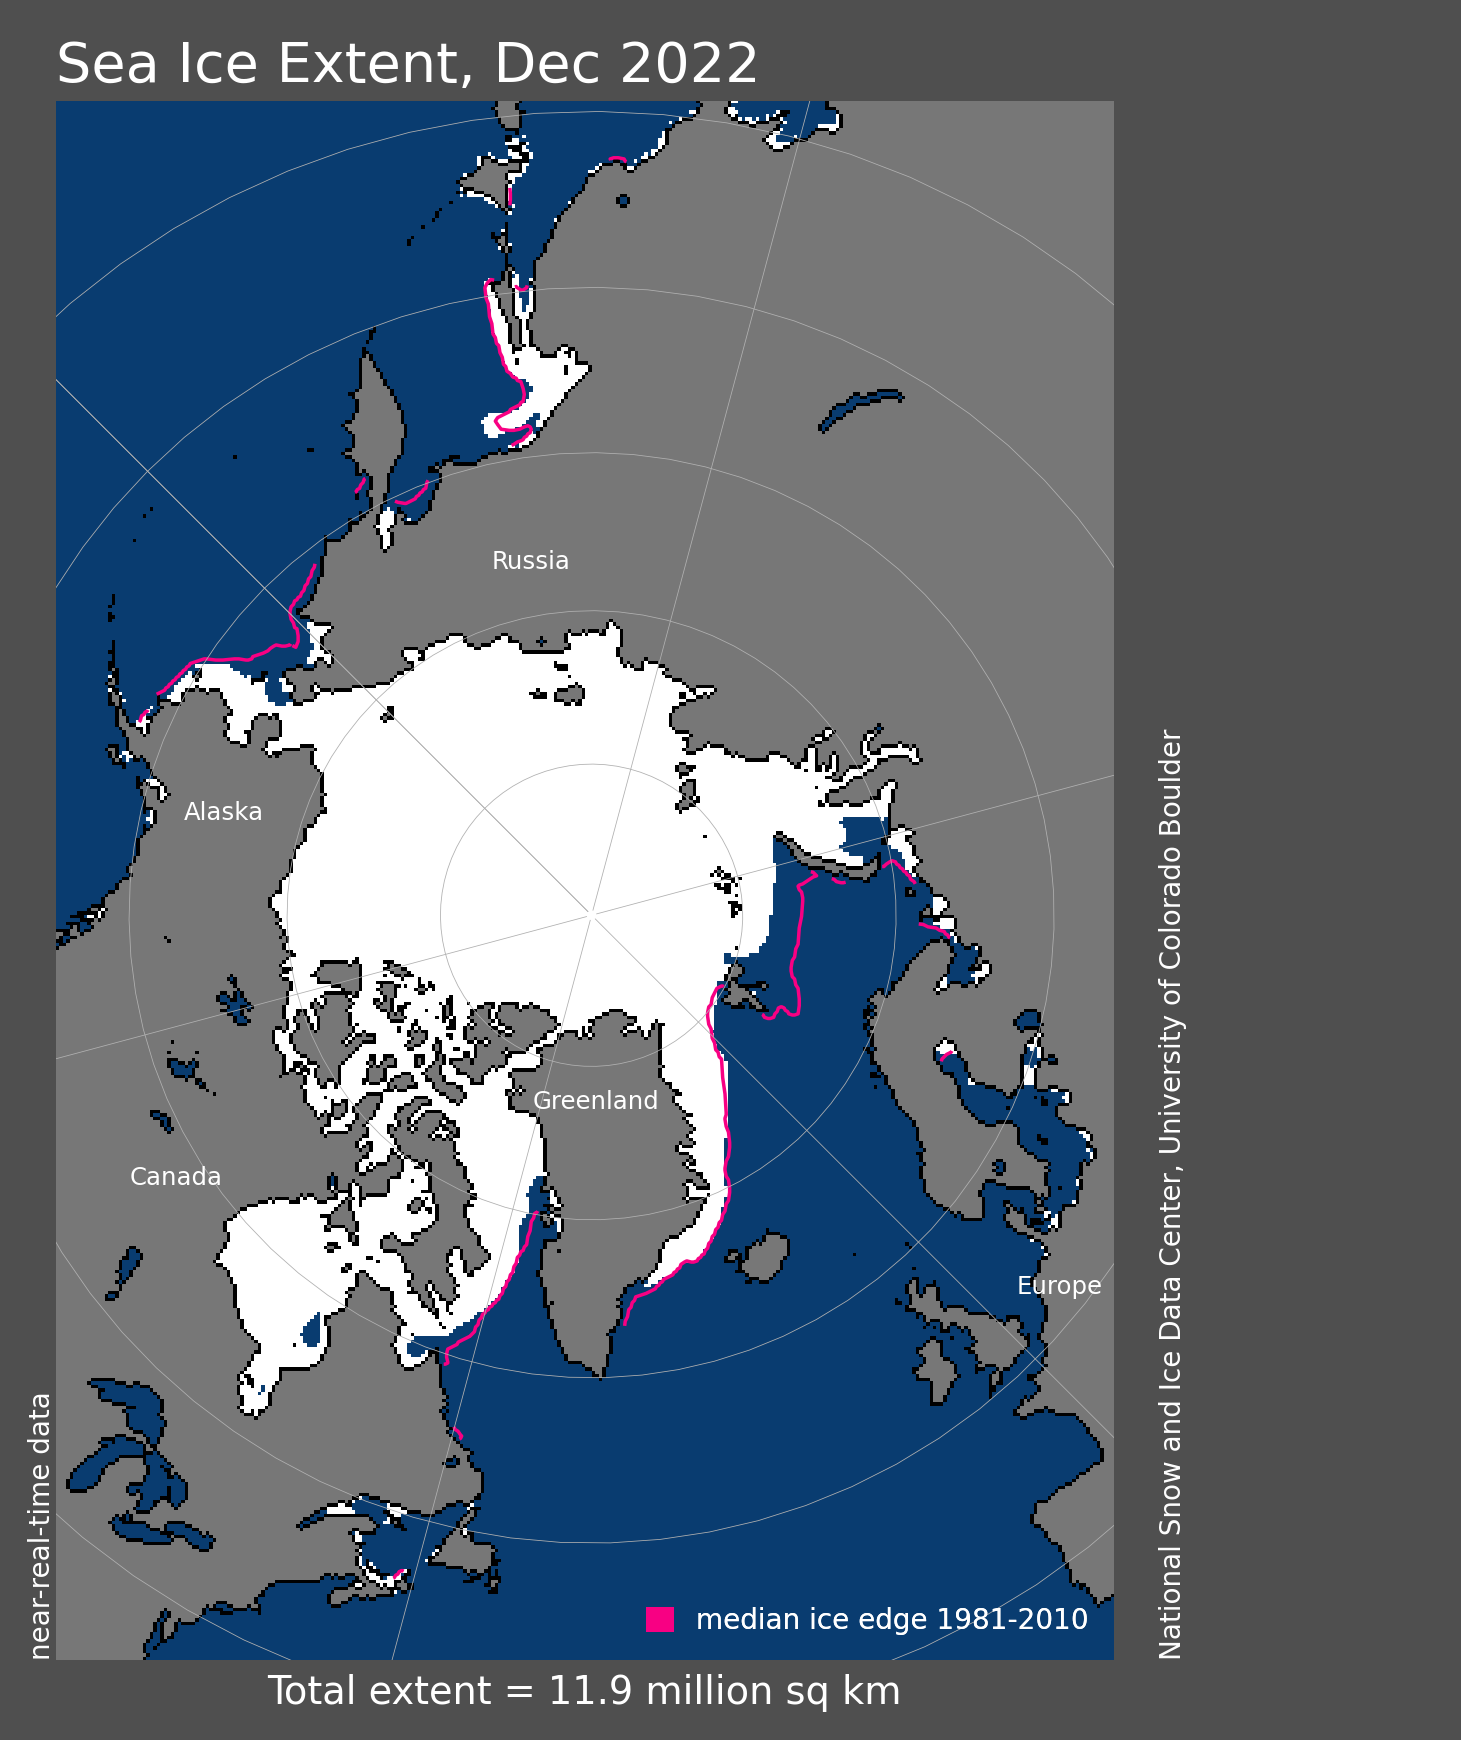
Figure 1a. Arctic sea ice extent for June 2023 was 10.96 million square kilometers (4.23 million square miles). The magenta line shows the 1981 to 2010 average extent for that month. Sea Ice Index data. About the data
Credit: National Snow and Ice Data Center
High-resolution image
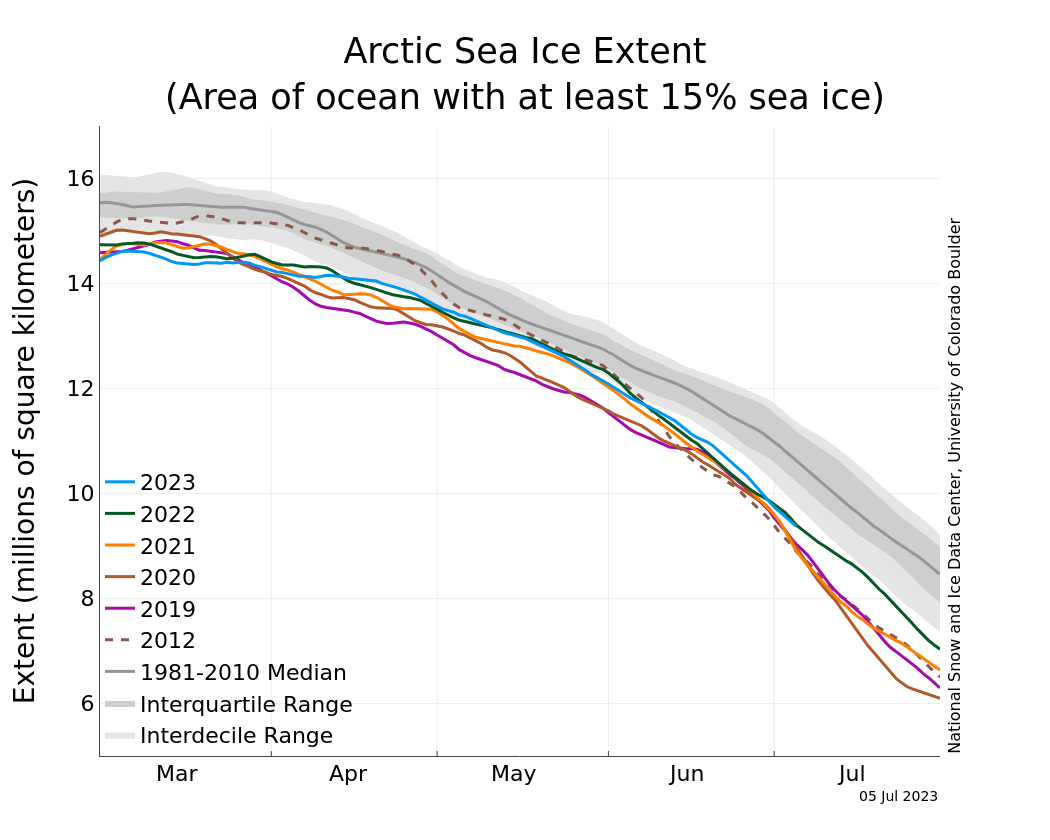
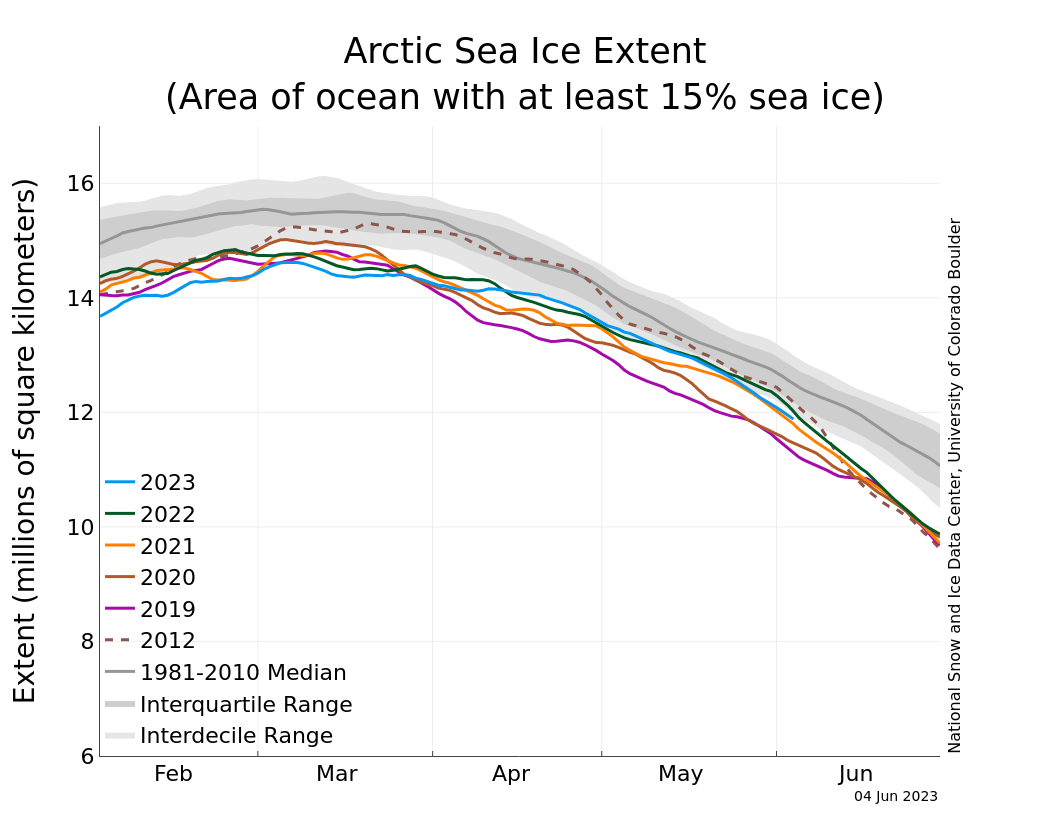
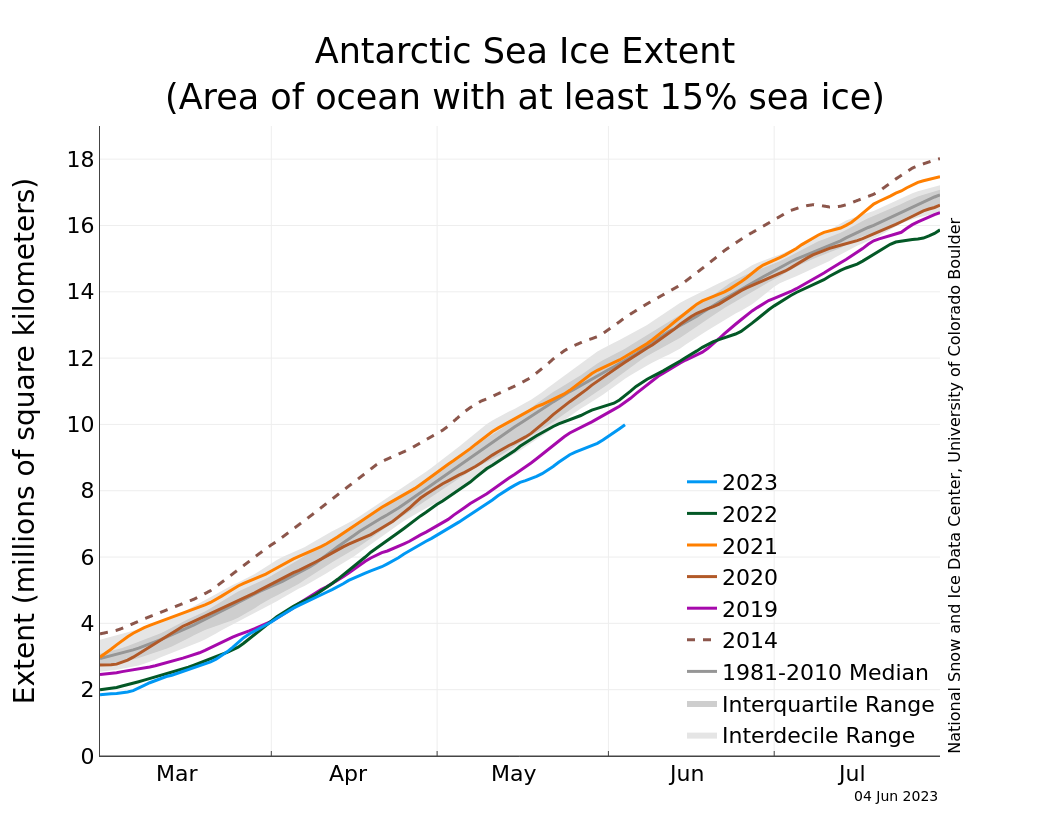
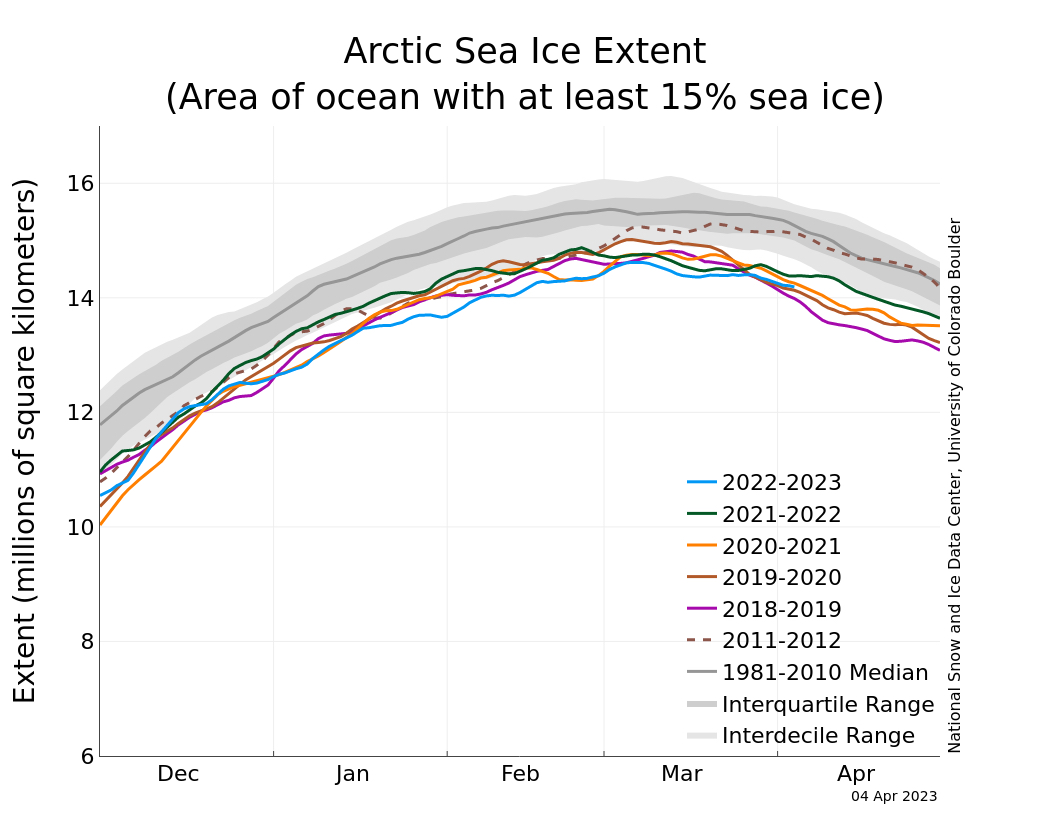
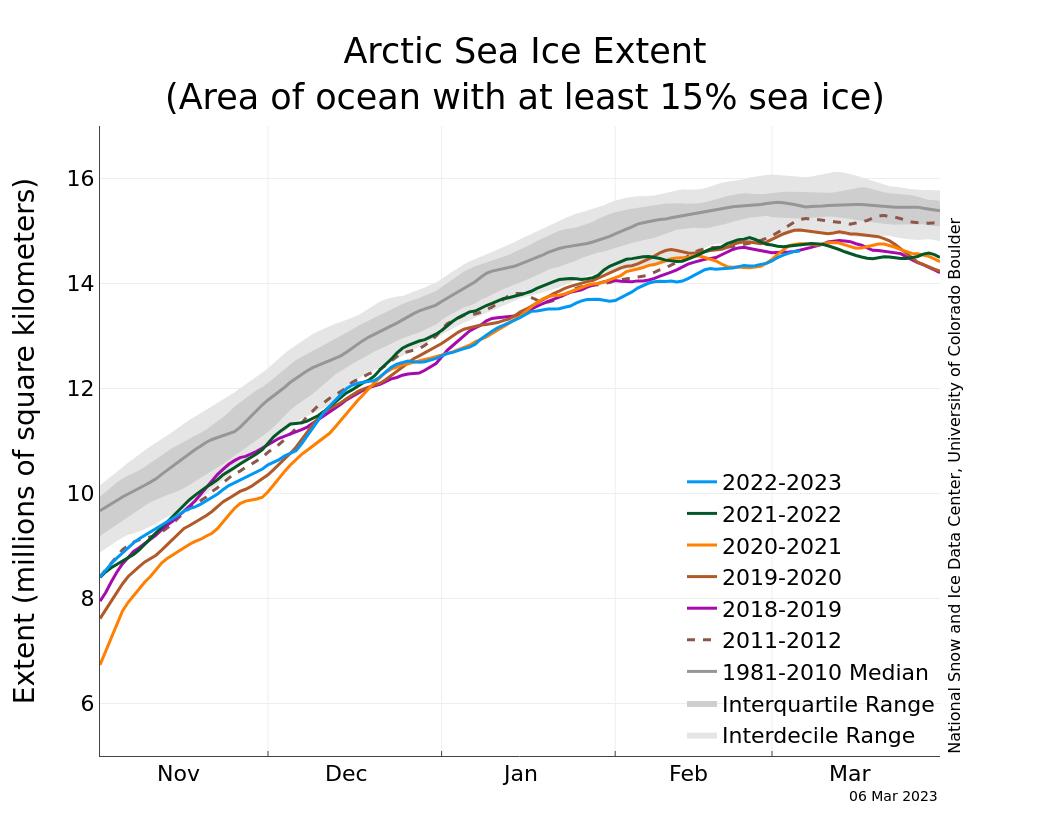
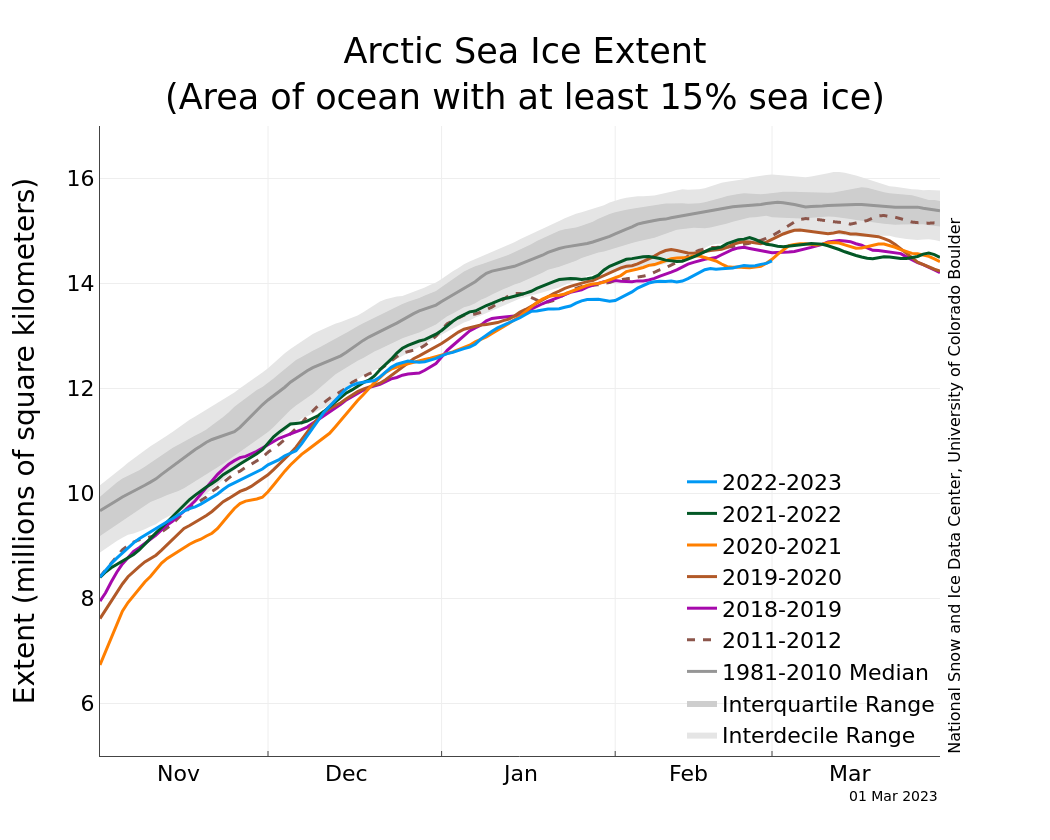
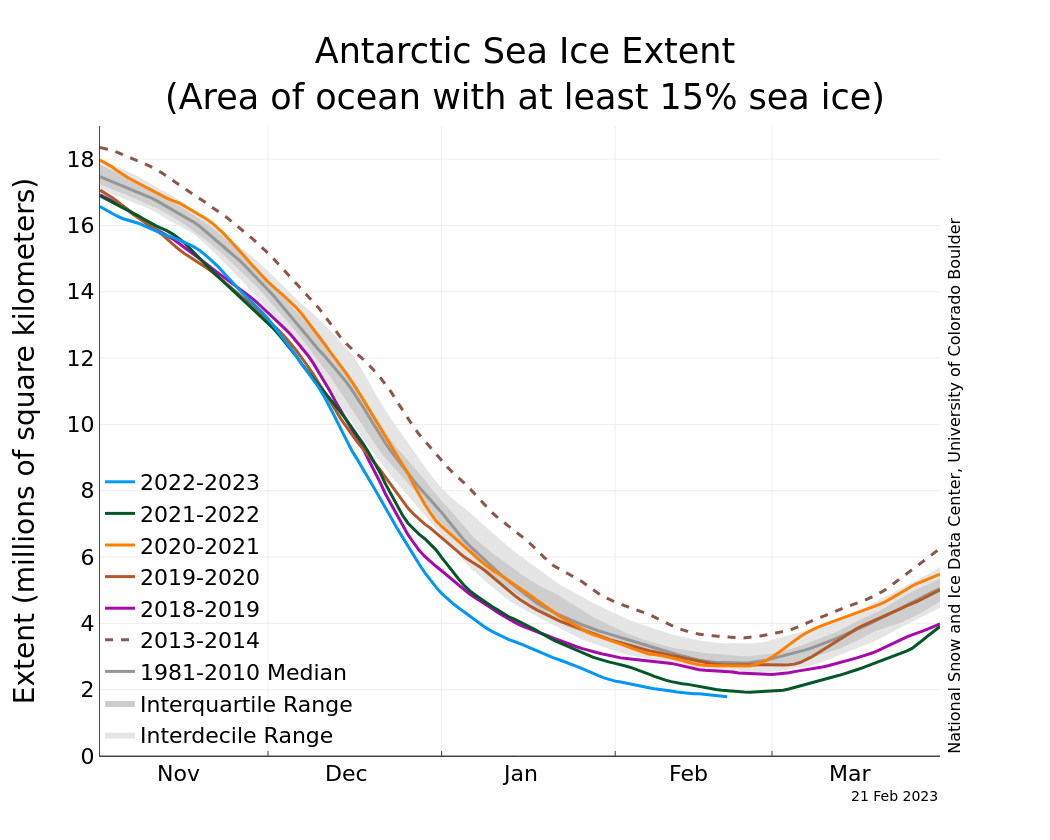
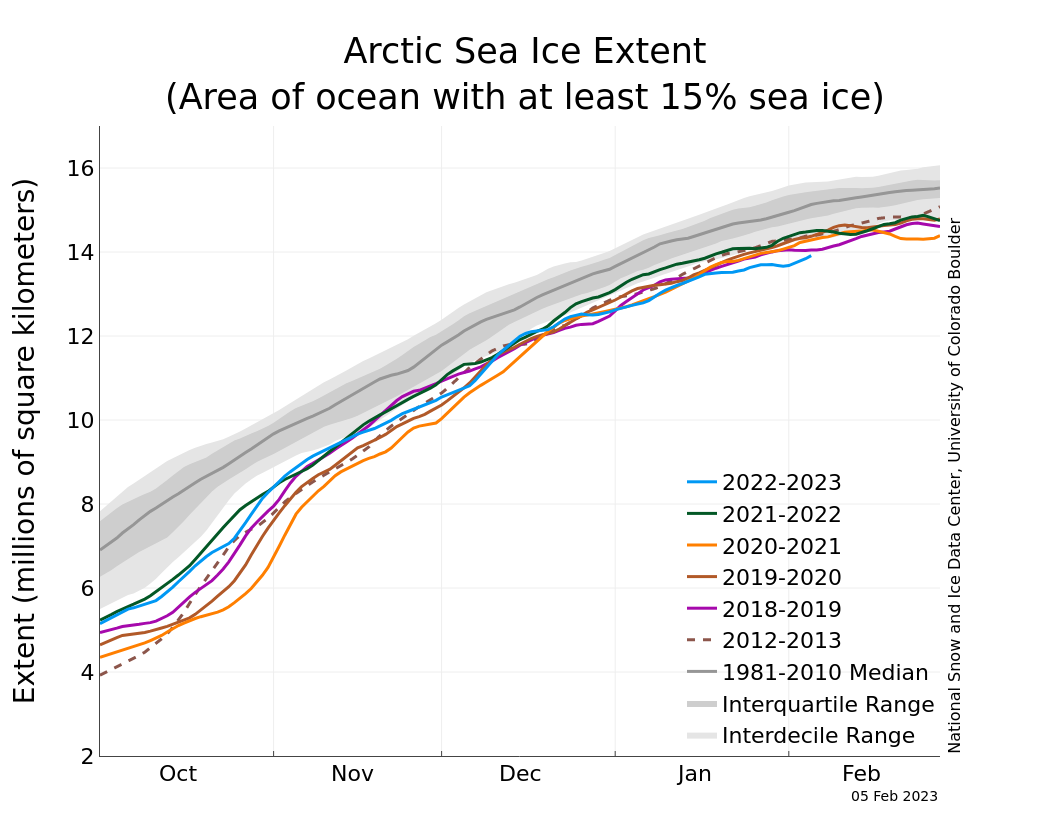
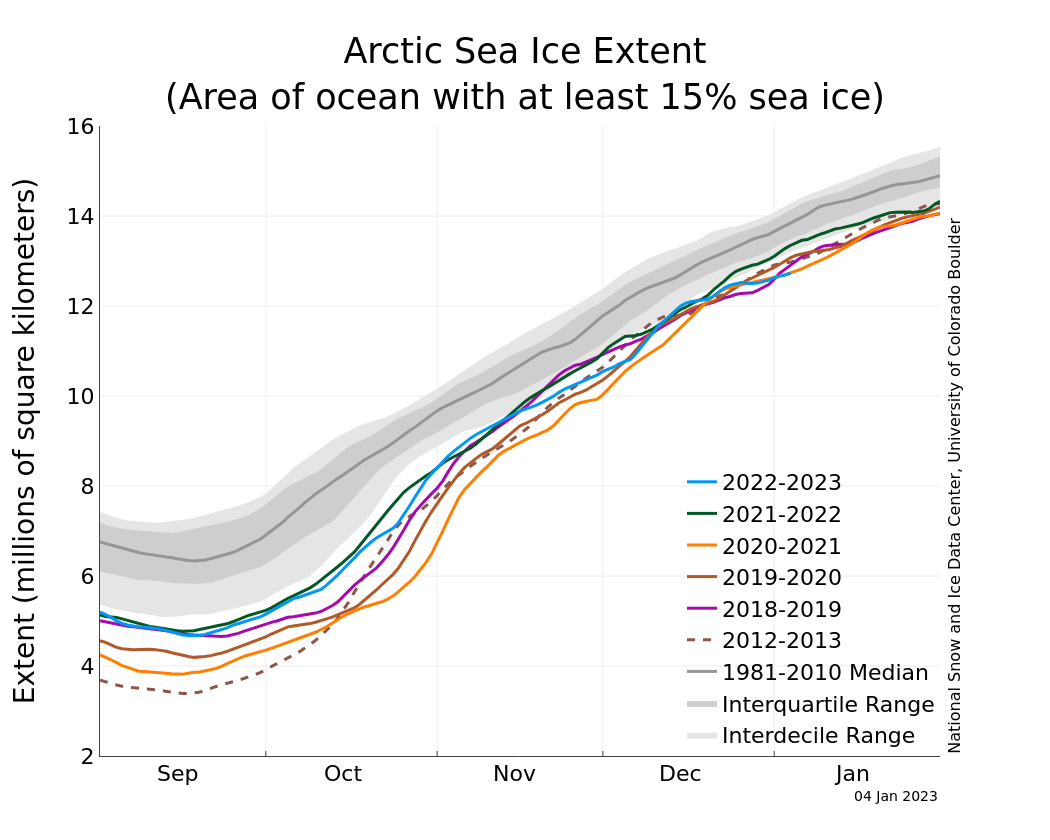
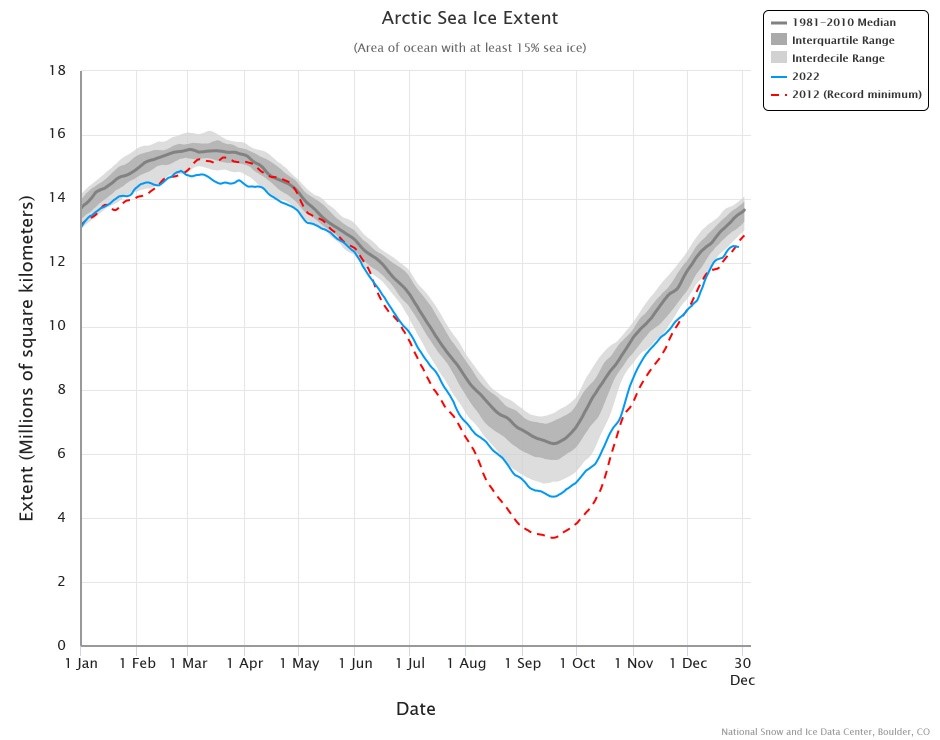
Figure 1b. The graph above shows Arctic sea ice extent as of July 5, 2023, along with daily ice extent data for four previous years and the record low year. 2023 is shown in blue, 2022 in green, 2021 in orange, 2020 in brown, 2019 in magenta, and 2012 in dashed brown. The 1981 to 2010 median is in dark gray. The gray areas around the median line show the interquartile and interdecile ranges of the data. Sea Ice Index data.
Credit: National Snow and Ice Data Center
High-resolution image
Average Arctic sea ice extent during June 2023 was 10.96 million square kilometers (4.23 million square miles) (Figure 1a), the thirteenth lowest June in the satellite record. The average extent was 800,000 square kilometers (309,000 square miles) below the 1981 to 2010 average and 550,000 square kilometers (212,000 square miles) above the record low June extent, which occurred in 2016.
Through much of June 2023, extent declined faster than the 1981 to 2010 average (Figure 1b). On average, based on the 1981 to 2010 mean, about 1.69 million square kilometers (653,000 square miles) of ice is lost in June, roughly the size of Alaska. This summer, 2.30 million square kilometers of ice melted (880,000 square miles). In regions which normally lose sea ice this time of year, the rate of ice loss was faster than average. This includes the Beaufort, Chukchi, Laptev, Kara and East Greenland Seas. In the Sea of Okhotsk and the Bering and Barents Seas, where ice retreat generally starts before June, the ice loss has been slower than average. At the end of June, total sea ice extent was below that in 2022, but higher than in 2019 and 2021.
Conditions in context
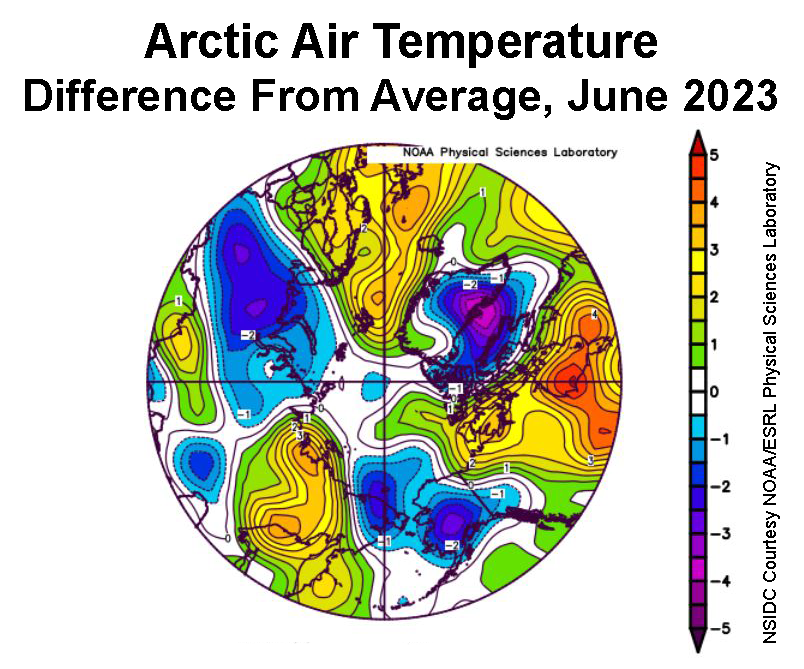
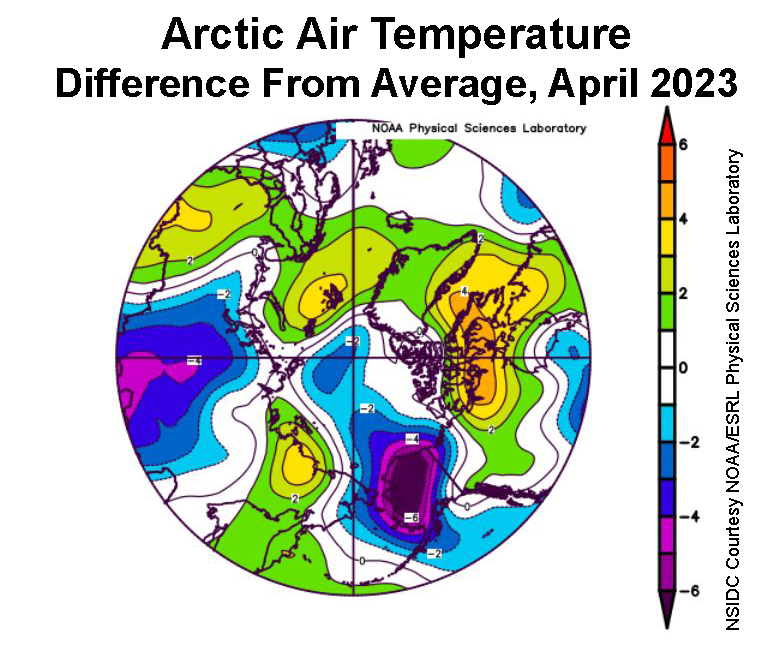
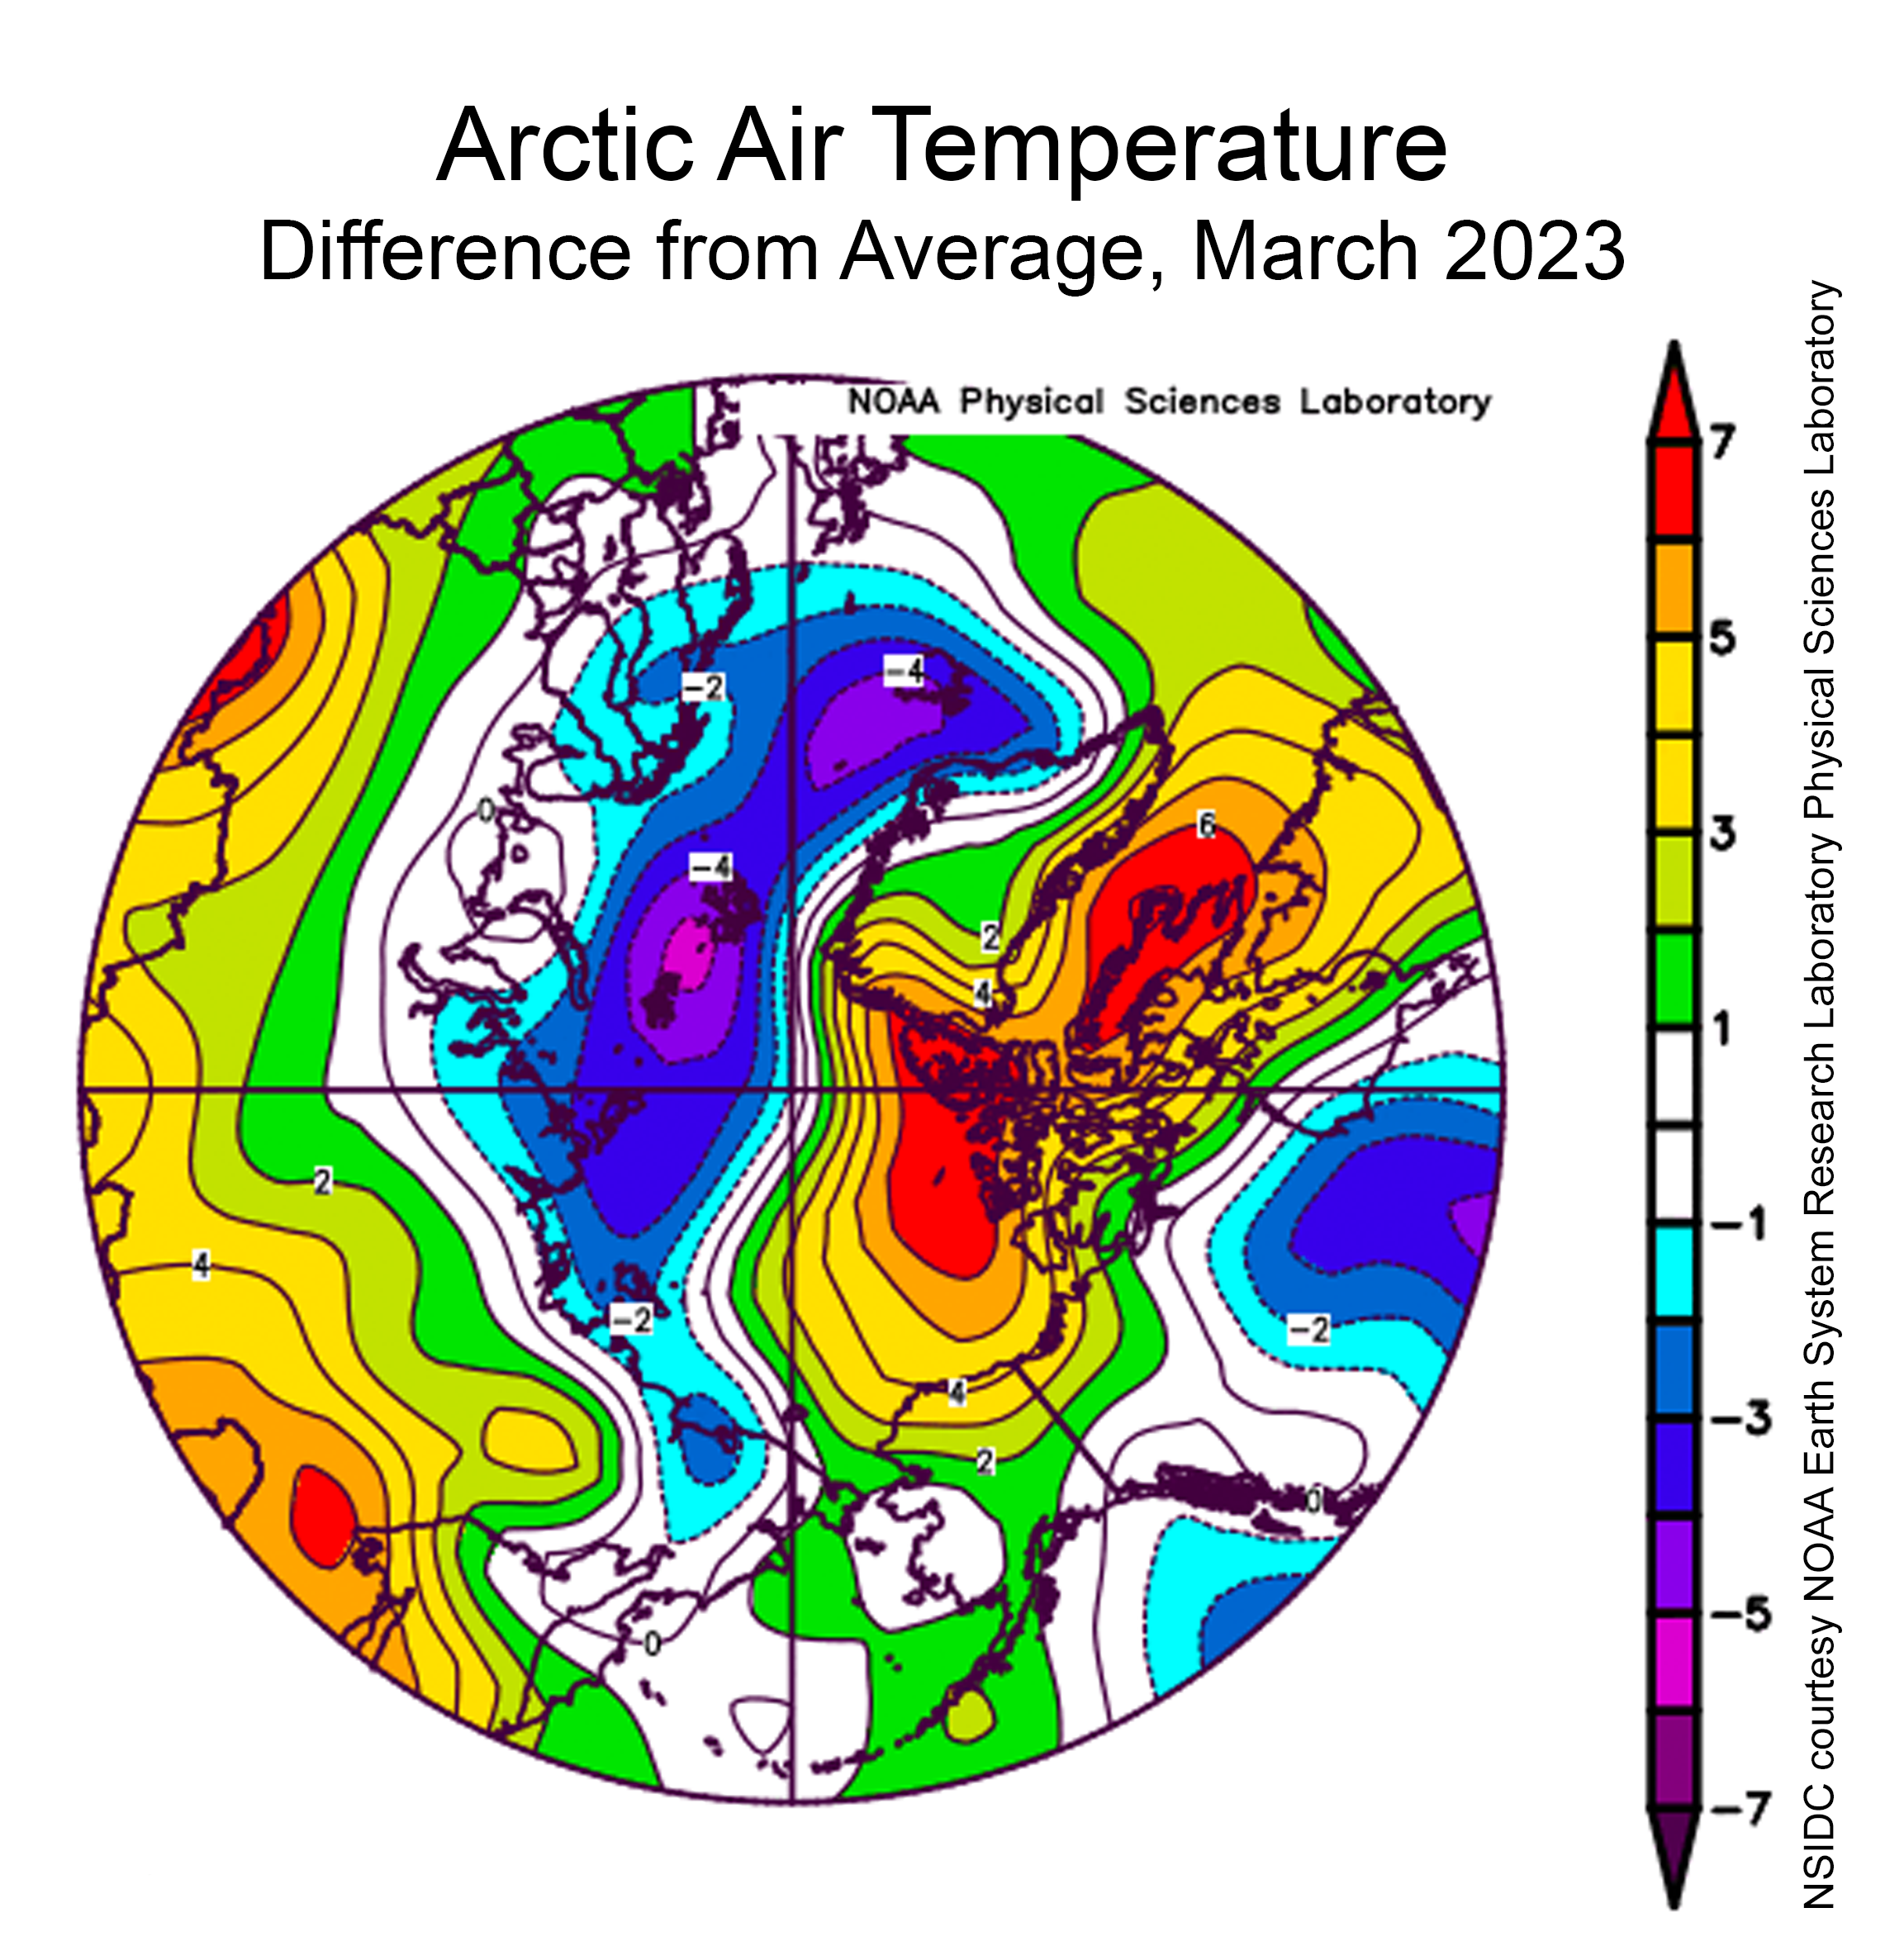
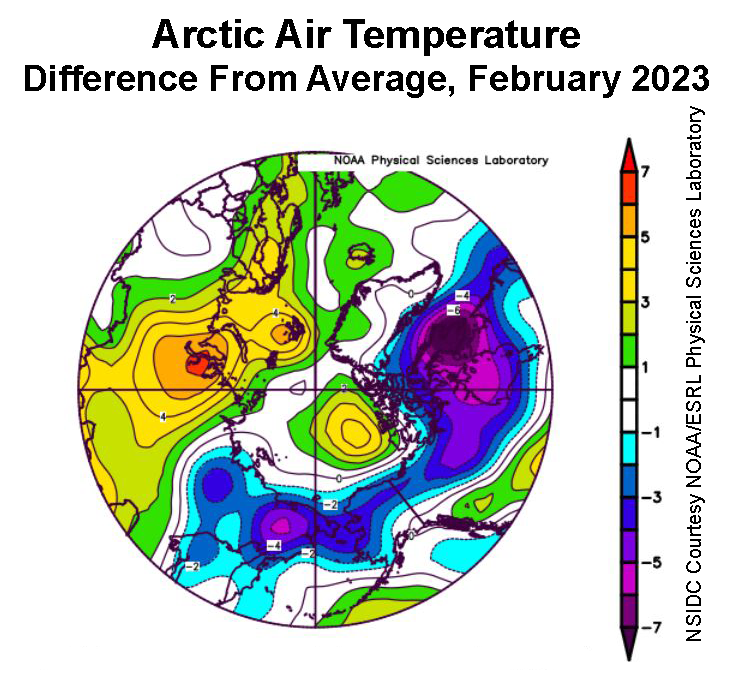
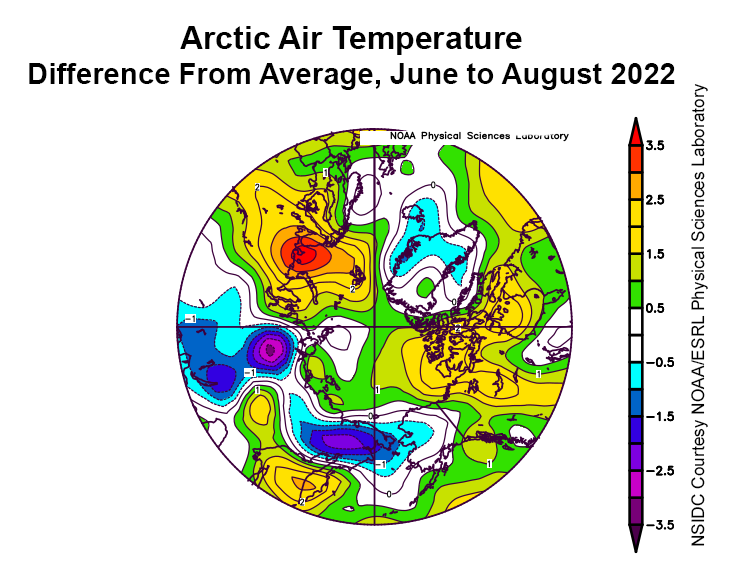
Figure 2a. This plot shows the departure from average air temperature in the Arctic at the 925 hPa level, in degrees Celsius, for June 2023. Yellows and reds indicate higher than average temperatures; blues and purples indicate lower than average temperatures.
Credit: NSIDC courtesy NOAA Earth System Research Laboratory Physical Sciences Laboratory
High-resolution image
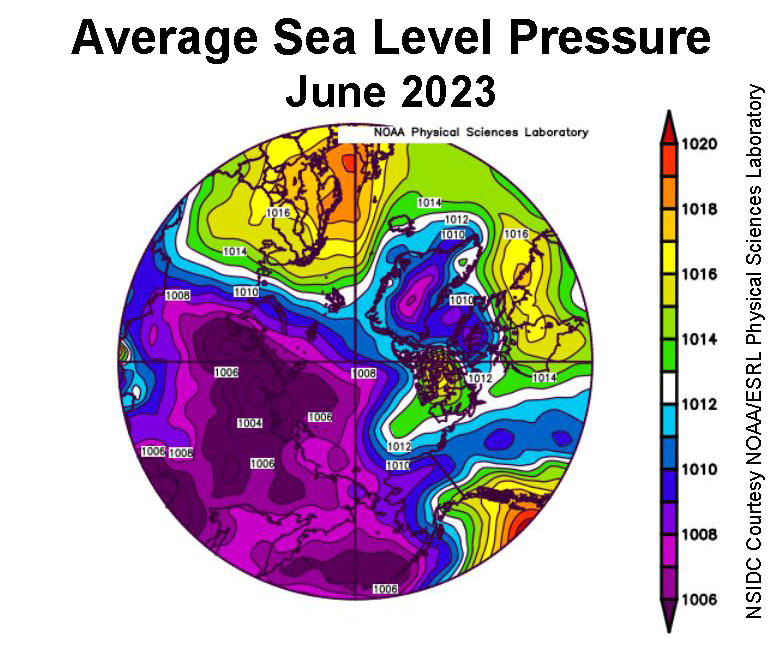
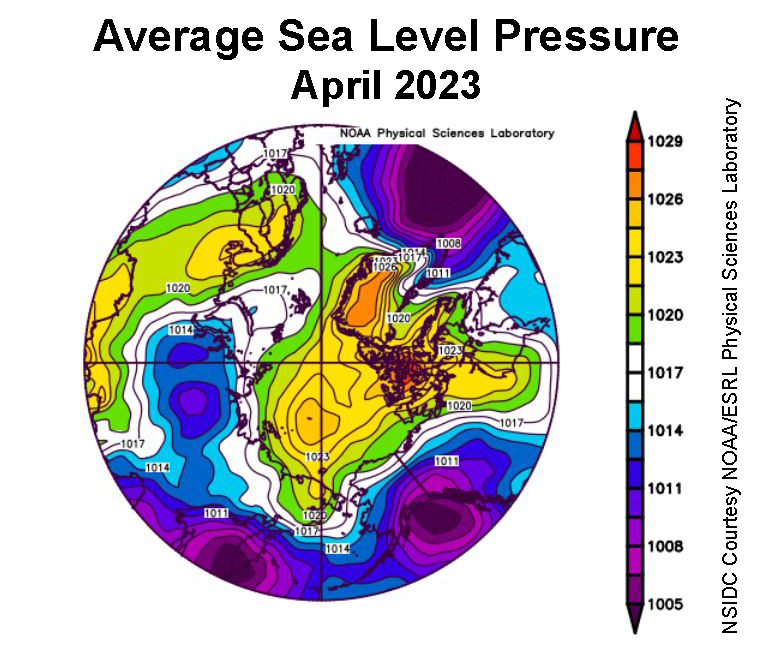
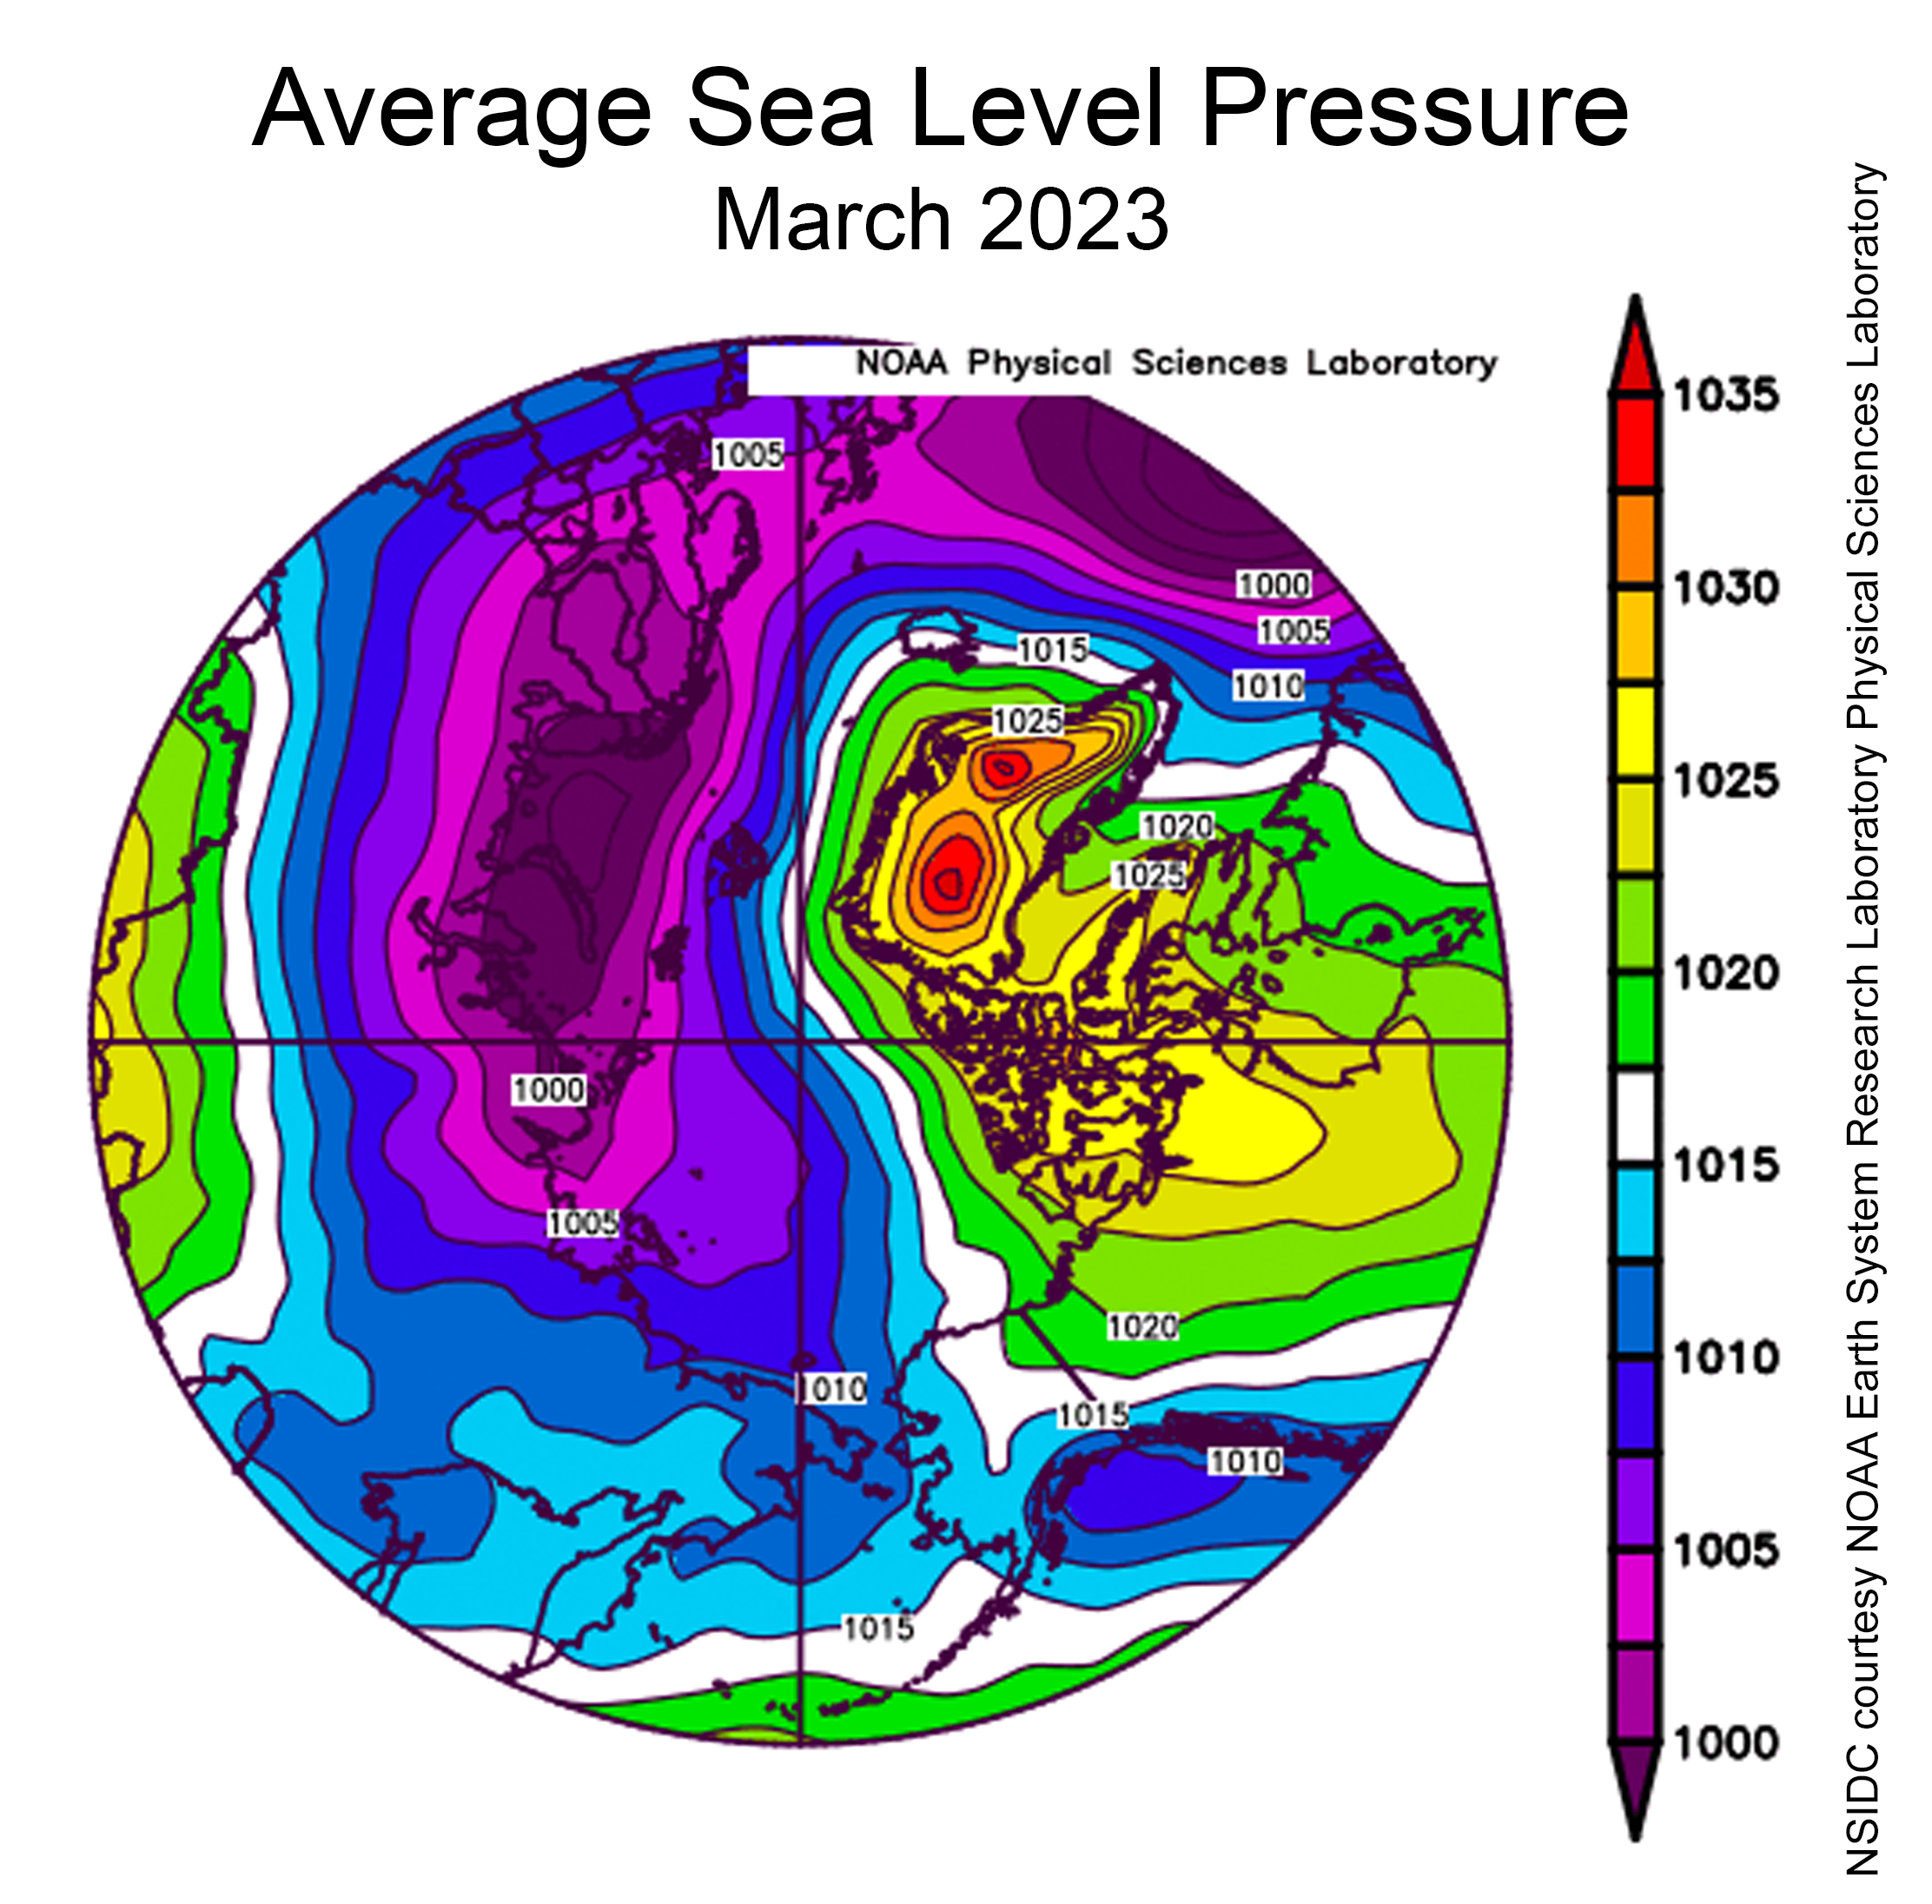
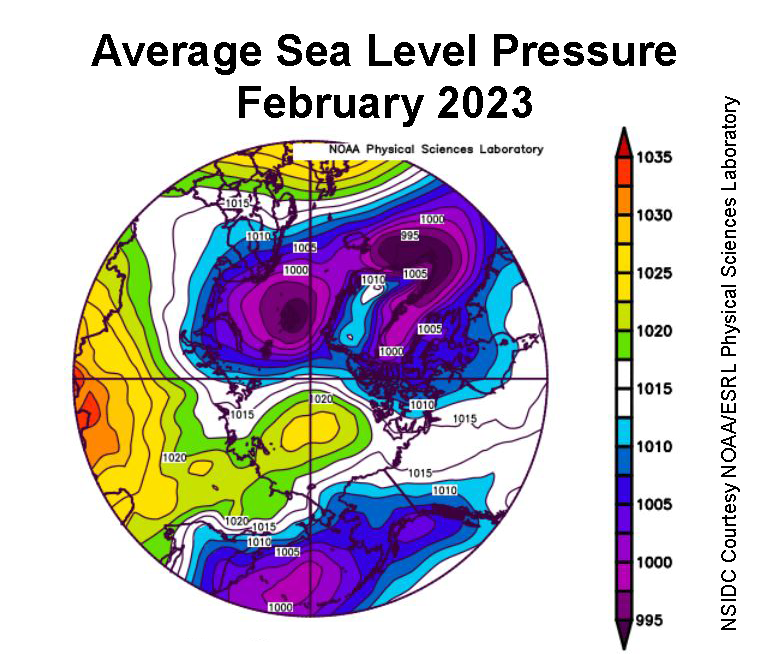
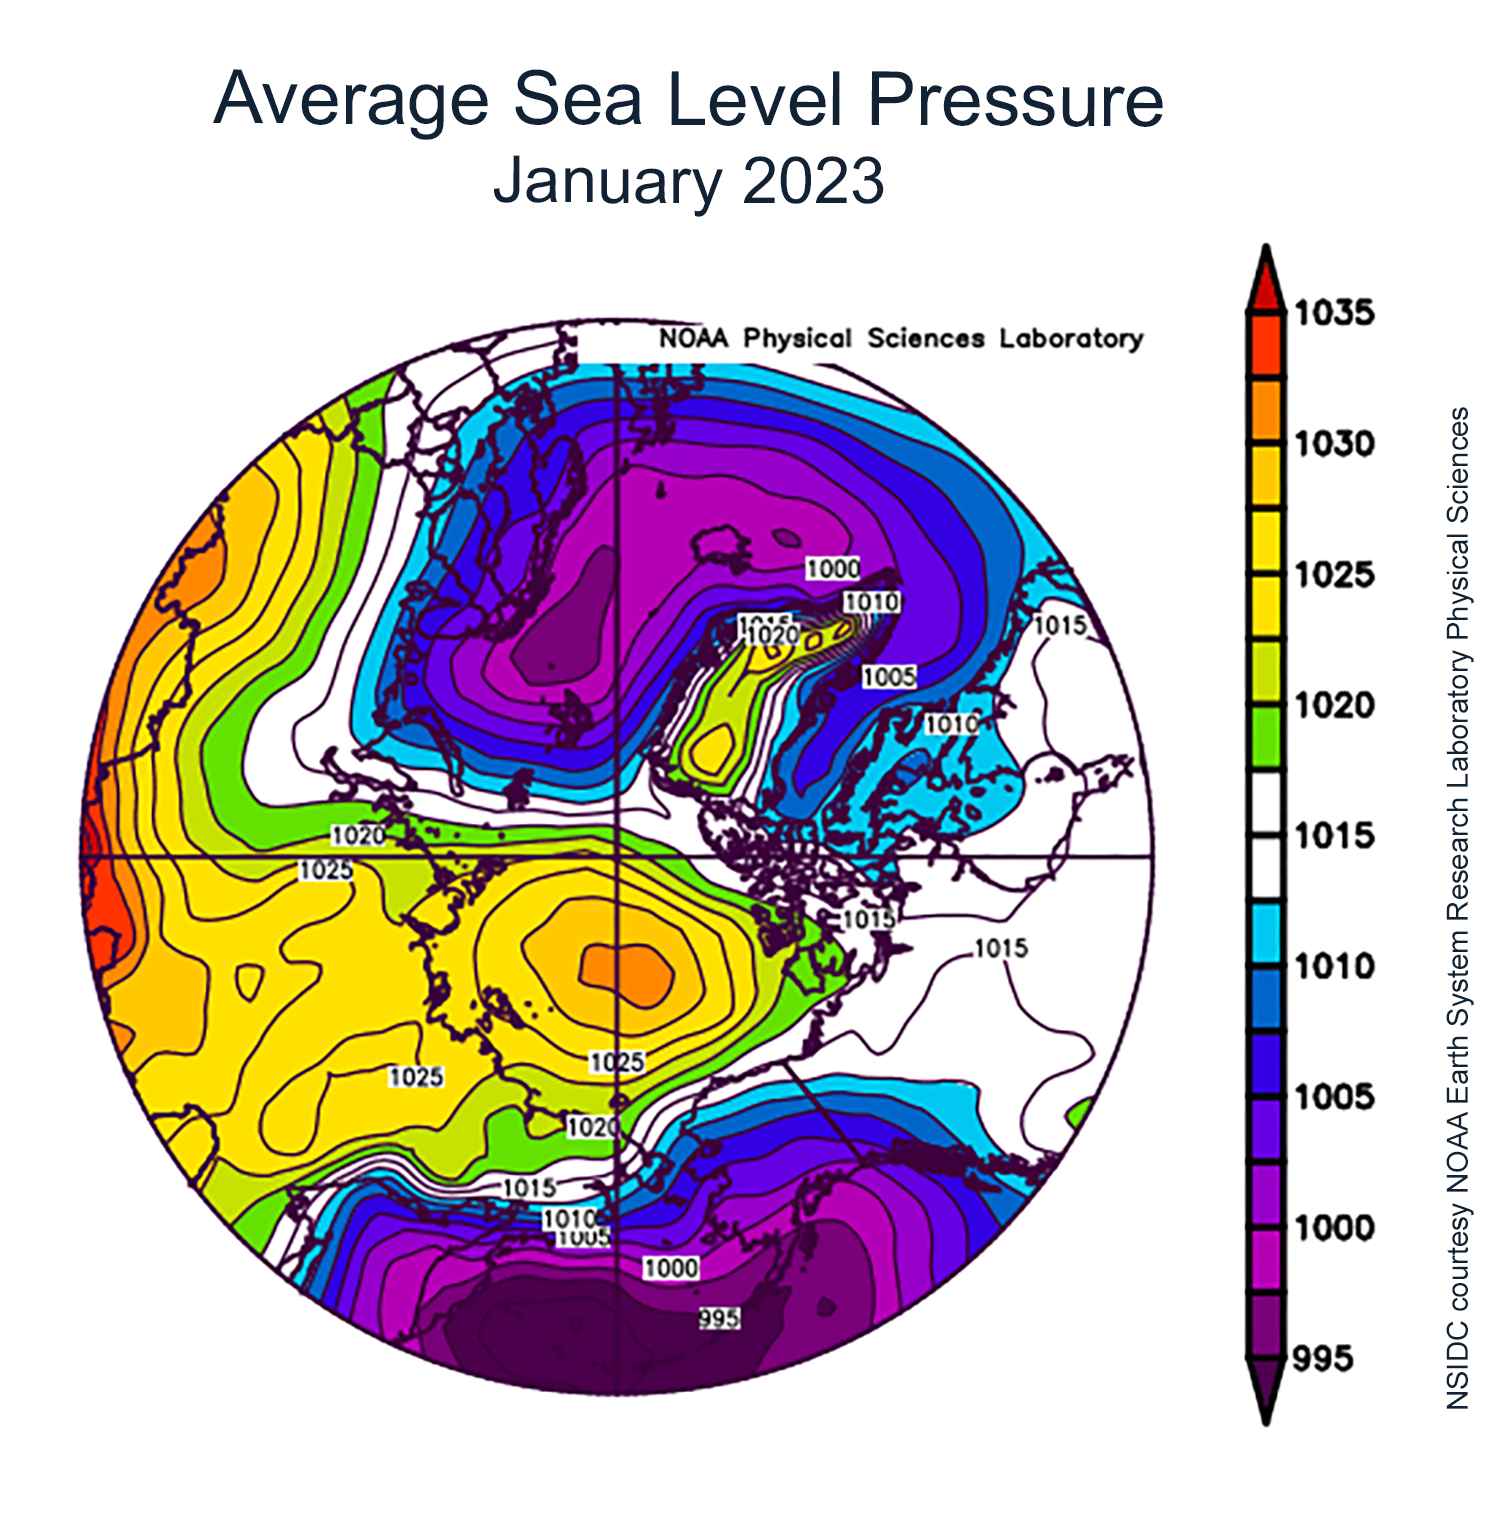
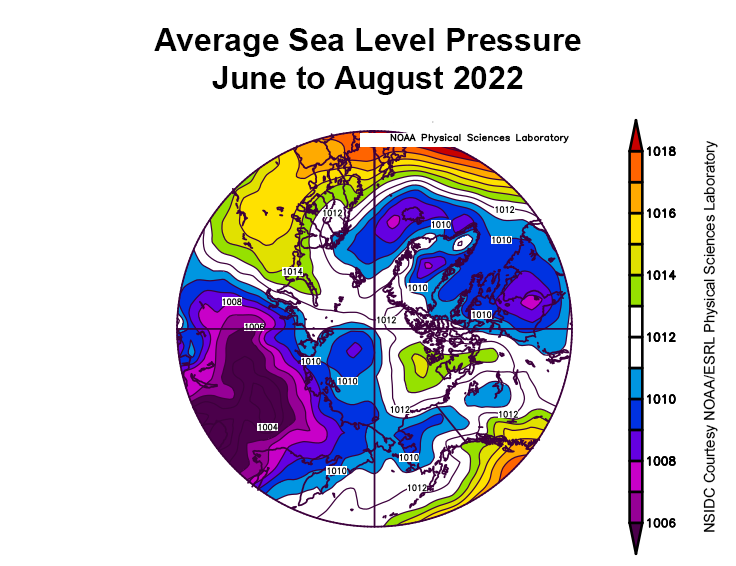
Figure 2b. This plot shows average sea level pressure in the Arctic in millibars for June 2023. Yellows and reds indicate high air pressure; blues and purples indicate low pressure.
Credit: NSIDC courtesy NOAA Earth System Research Laboratory Physical Sciences Laboratory
High-resolution image
Air temperatures at the 925 millibar level (approximately 2,500 feet above the surface) over the Arctic Ocean were mixed (Figure 2a). Above average temperatures of 1 to 4 degrees Celsius (2 to 7 degrees Fahrenheit) were found just off the coast in the Laptev Sea, the southern Beaufort Sea off the coast of Canada, and in the East Greenland Sea and stretching towards Svalbard. North of Alaska and in the East Siberian Sea, temperatures were 1 to 3 degrees Celsius (2 to 5 degrees Fahrenheit) below average.
Below-average sea level pressure dominated Eurasia in June, with low pressure extending over much of the Arctic Ocean (Figure 2b). Coupled with above-average sea level pressure over Scandinavia, this pressure pattern fostered relatively cold Arctic air reaching Novaya Zemlya and the coastal areas of the Kara Sea, resulting in temperatures just slightly below average for this time of year.
June 2023 compared to previous years
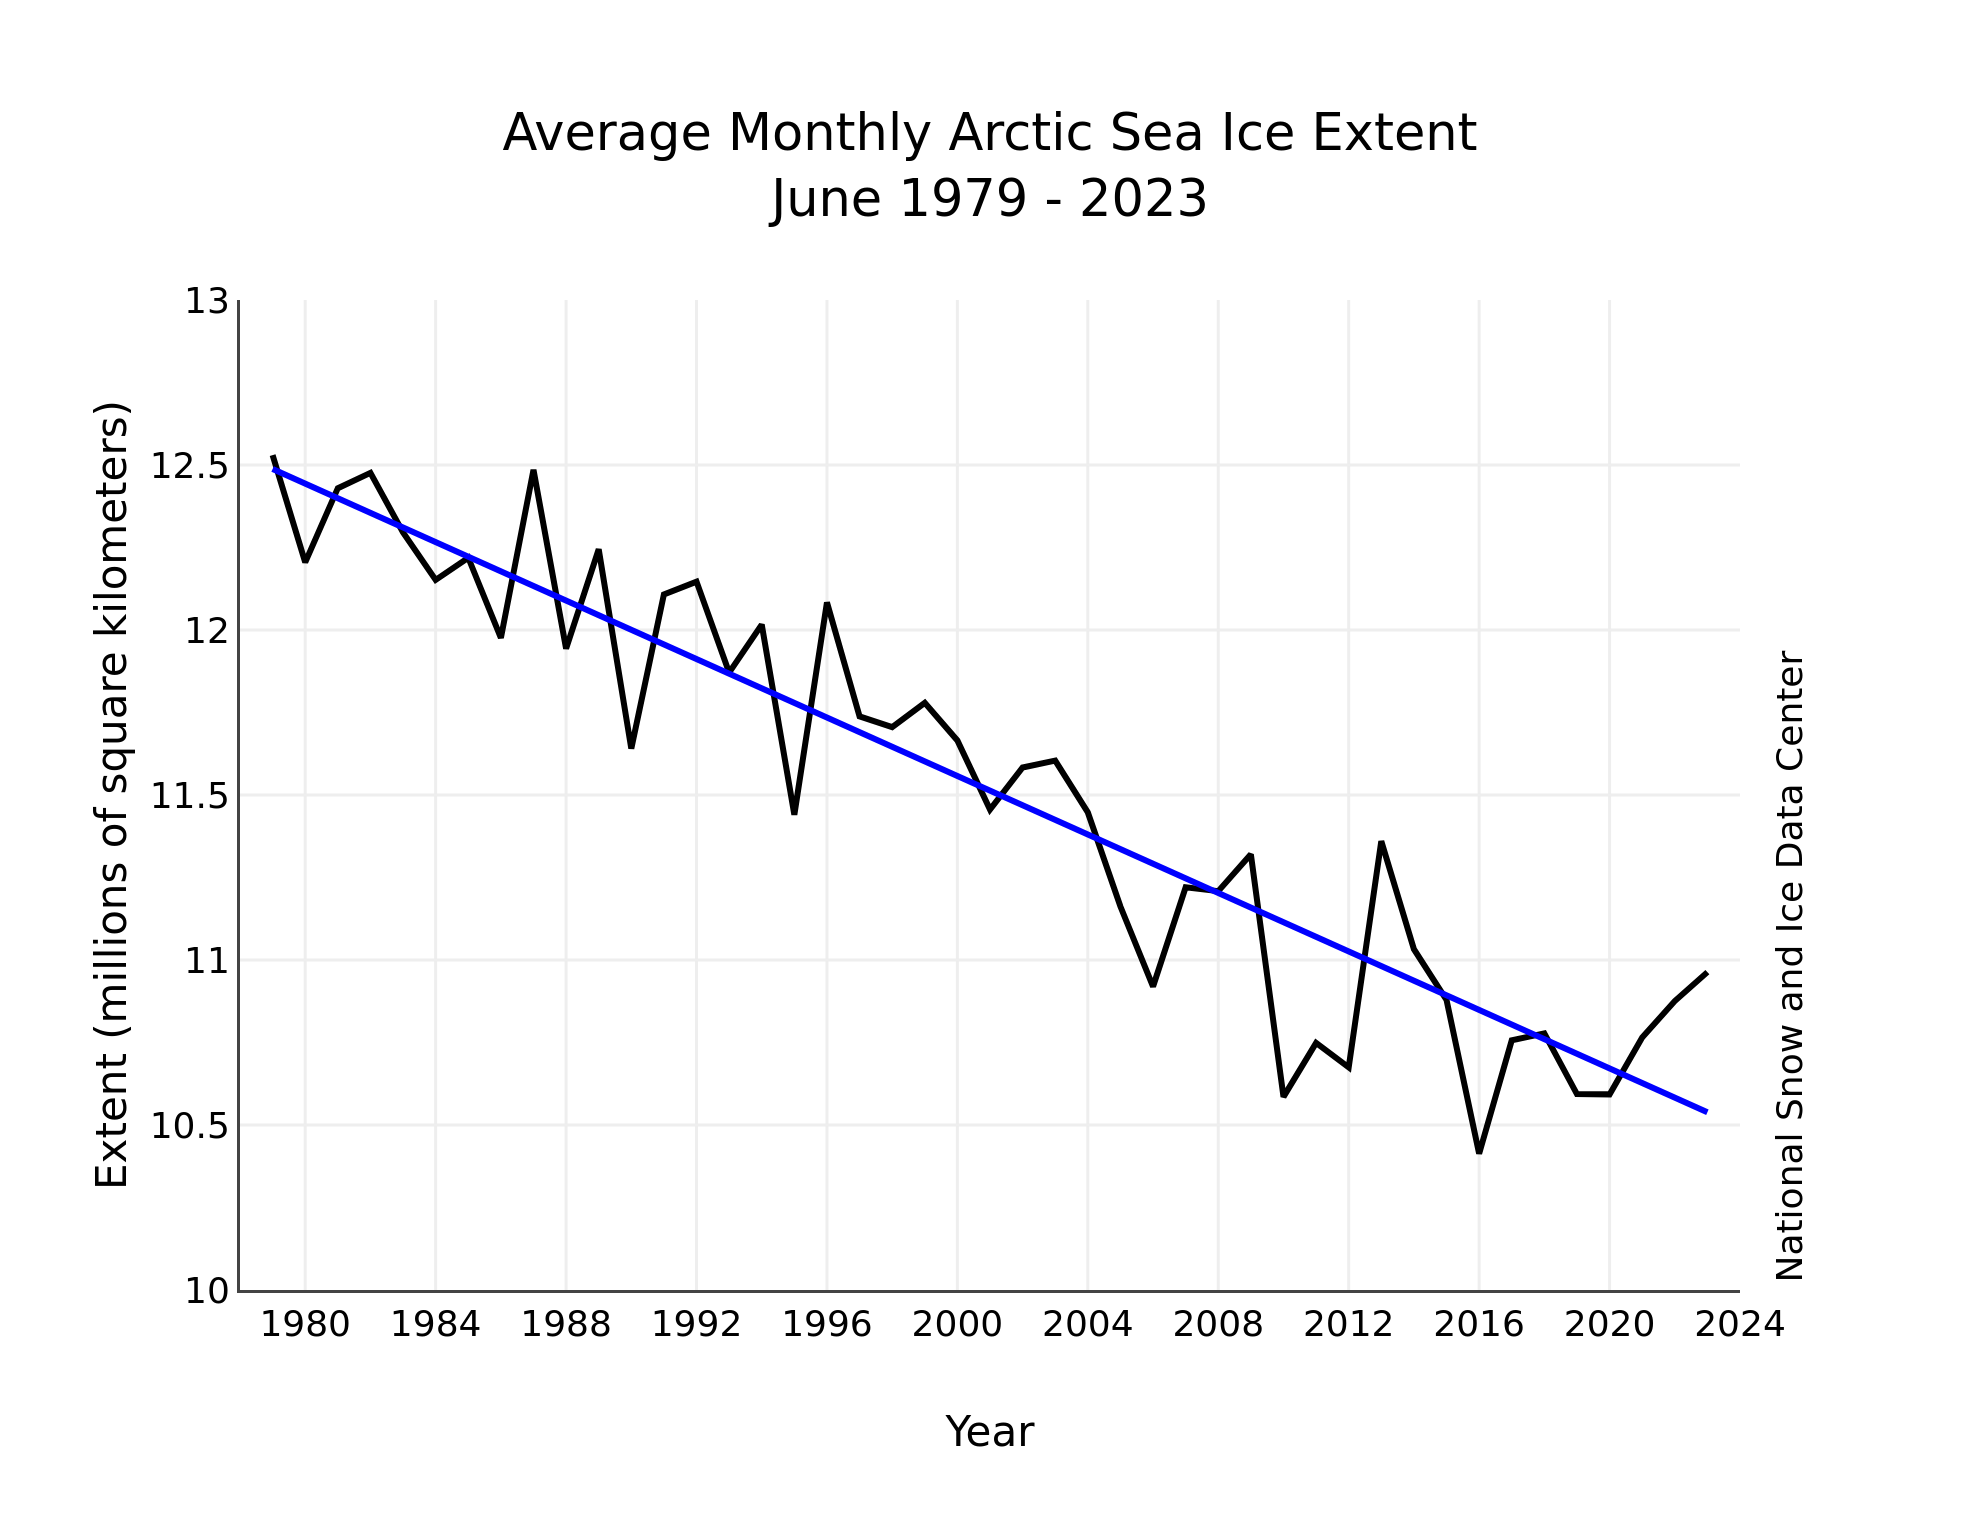
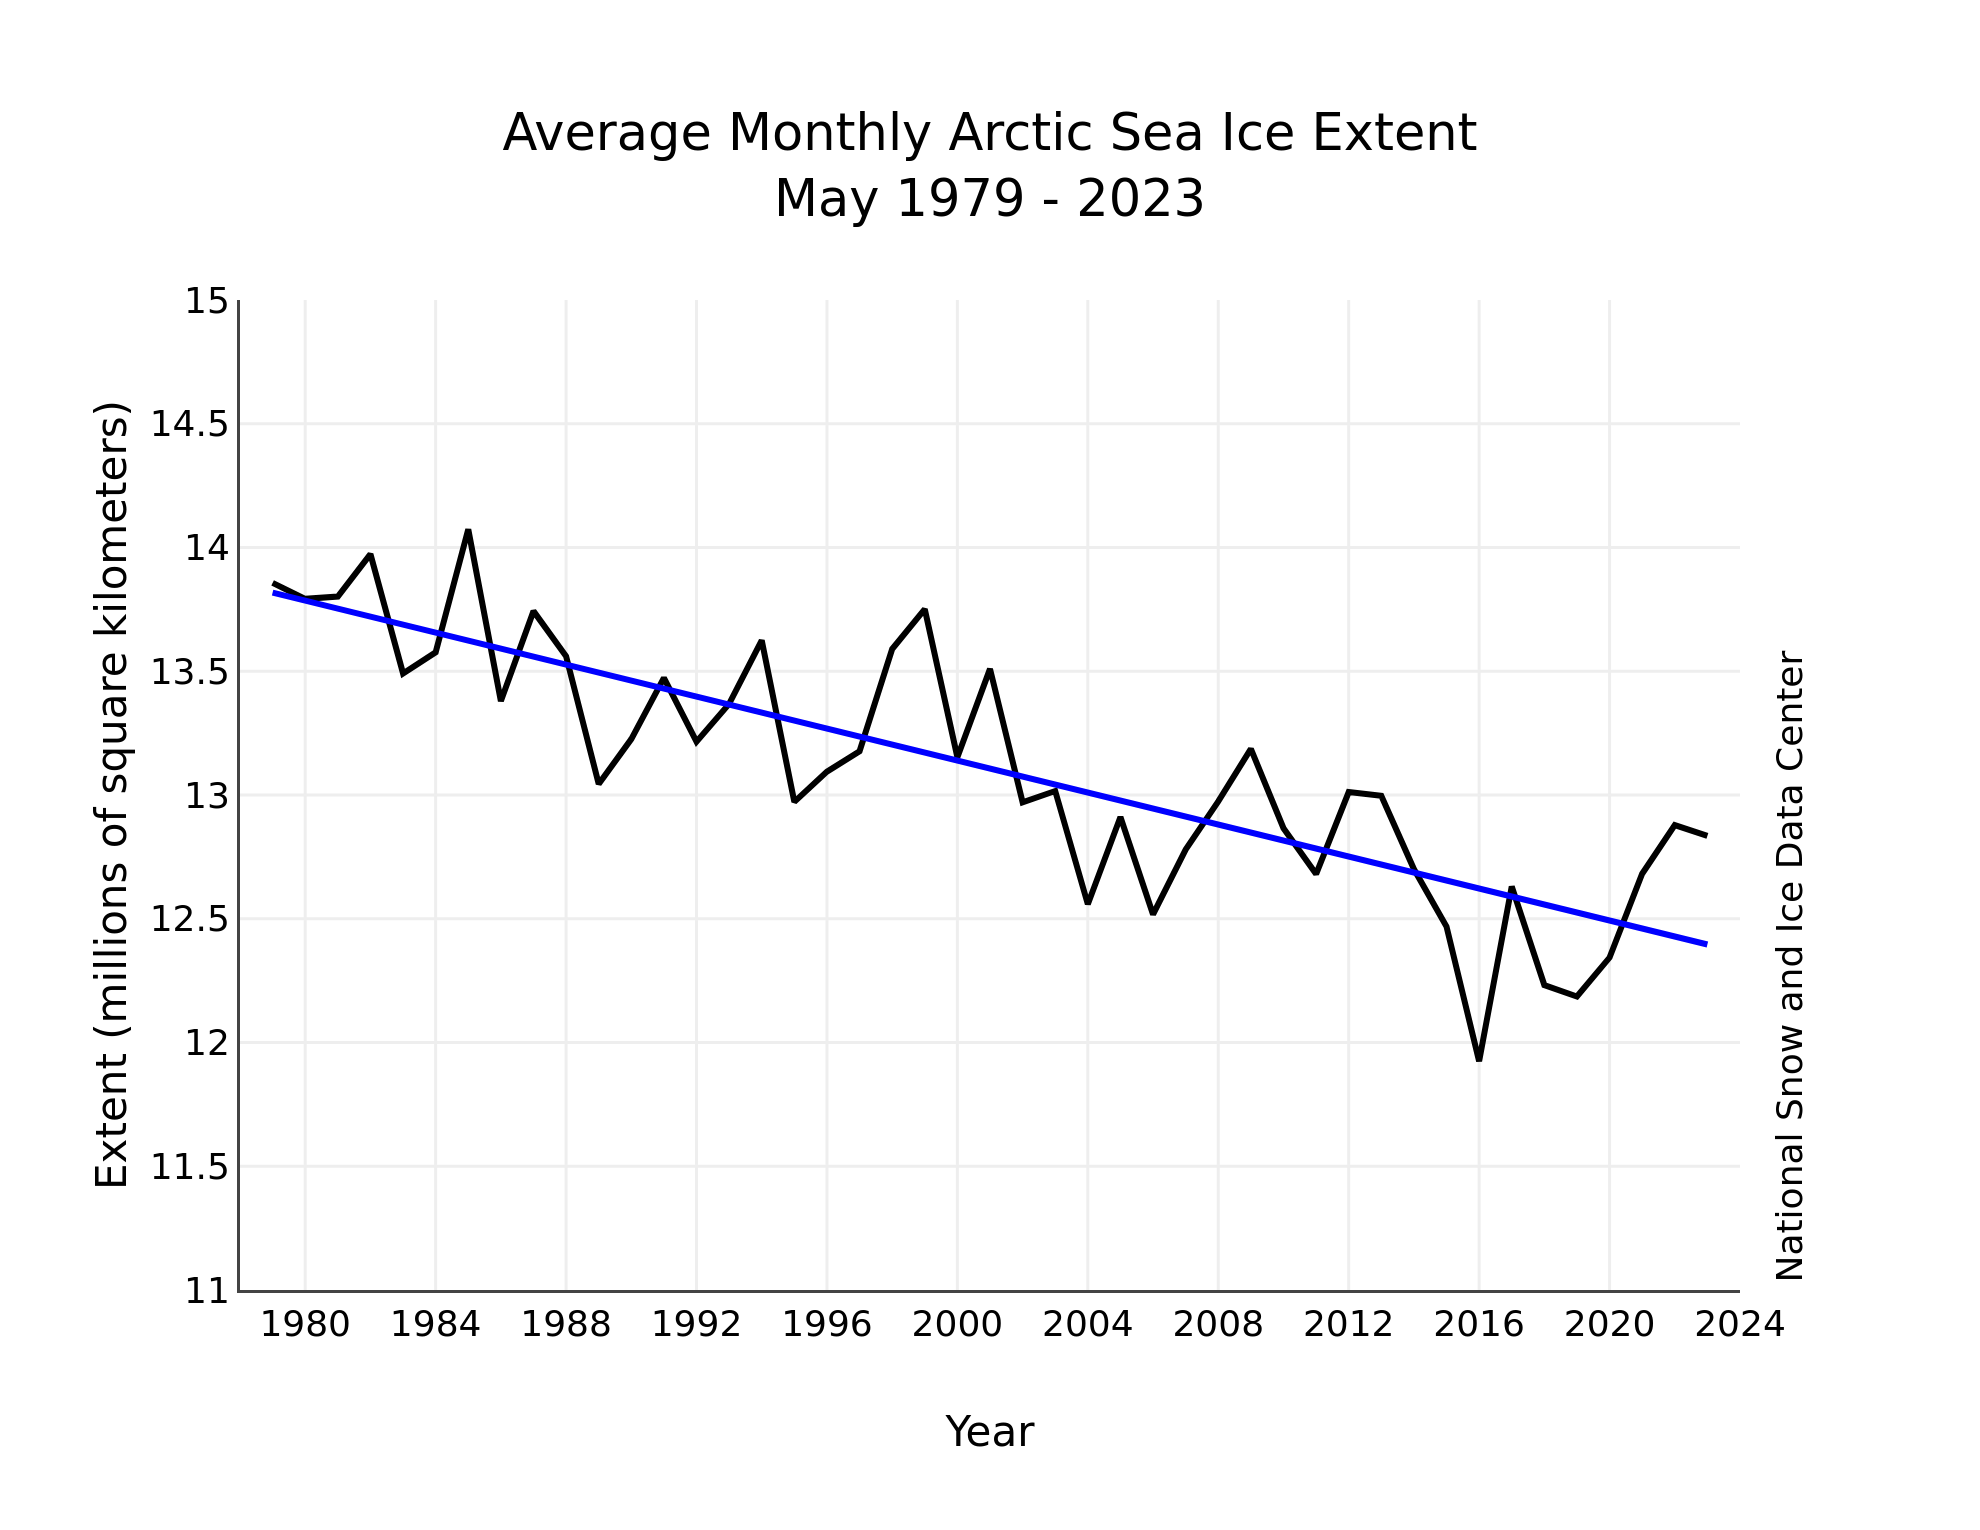
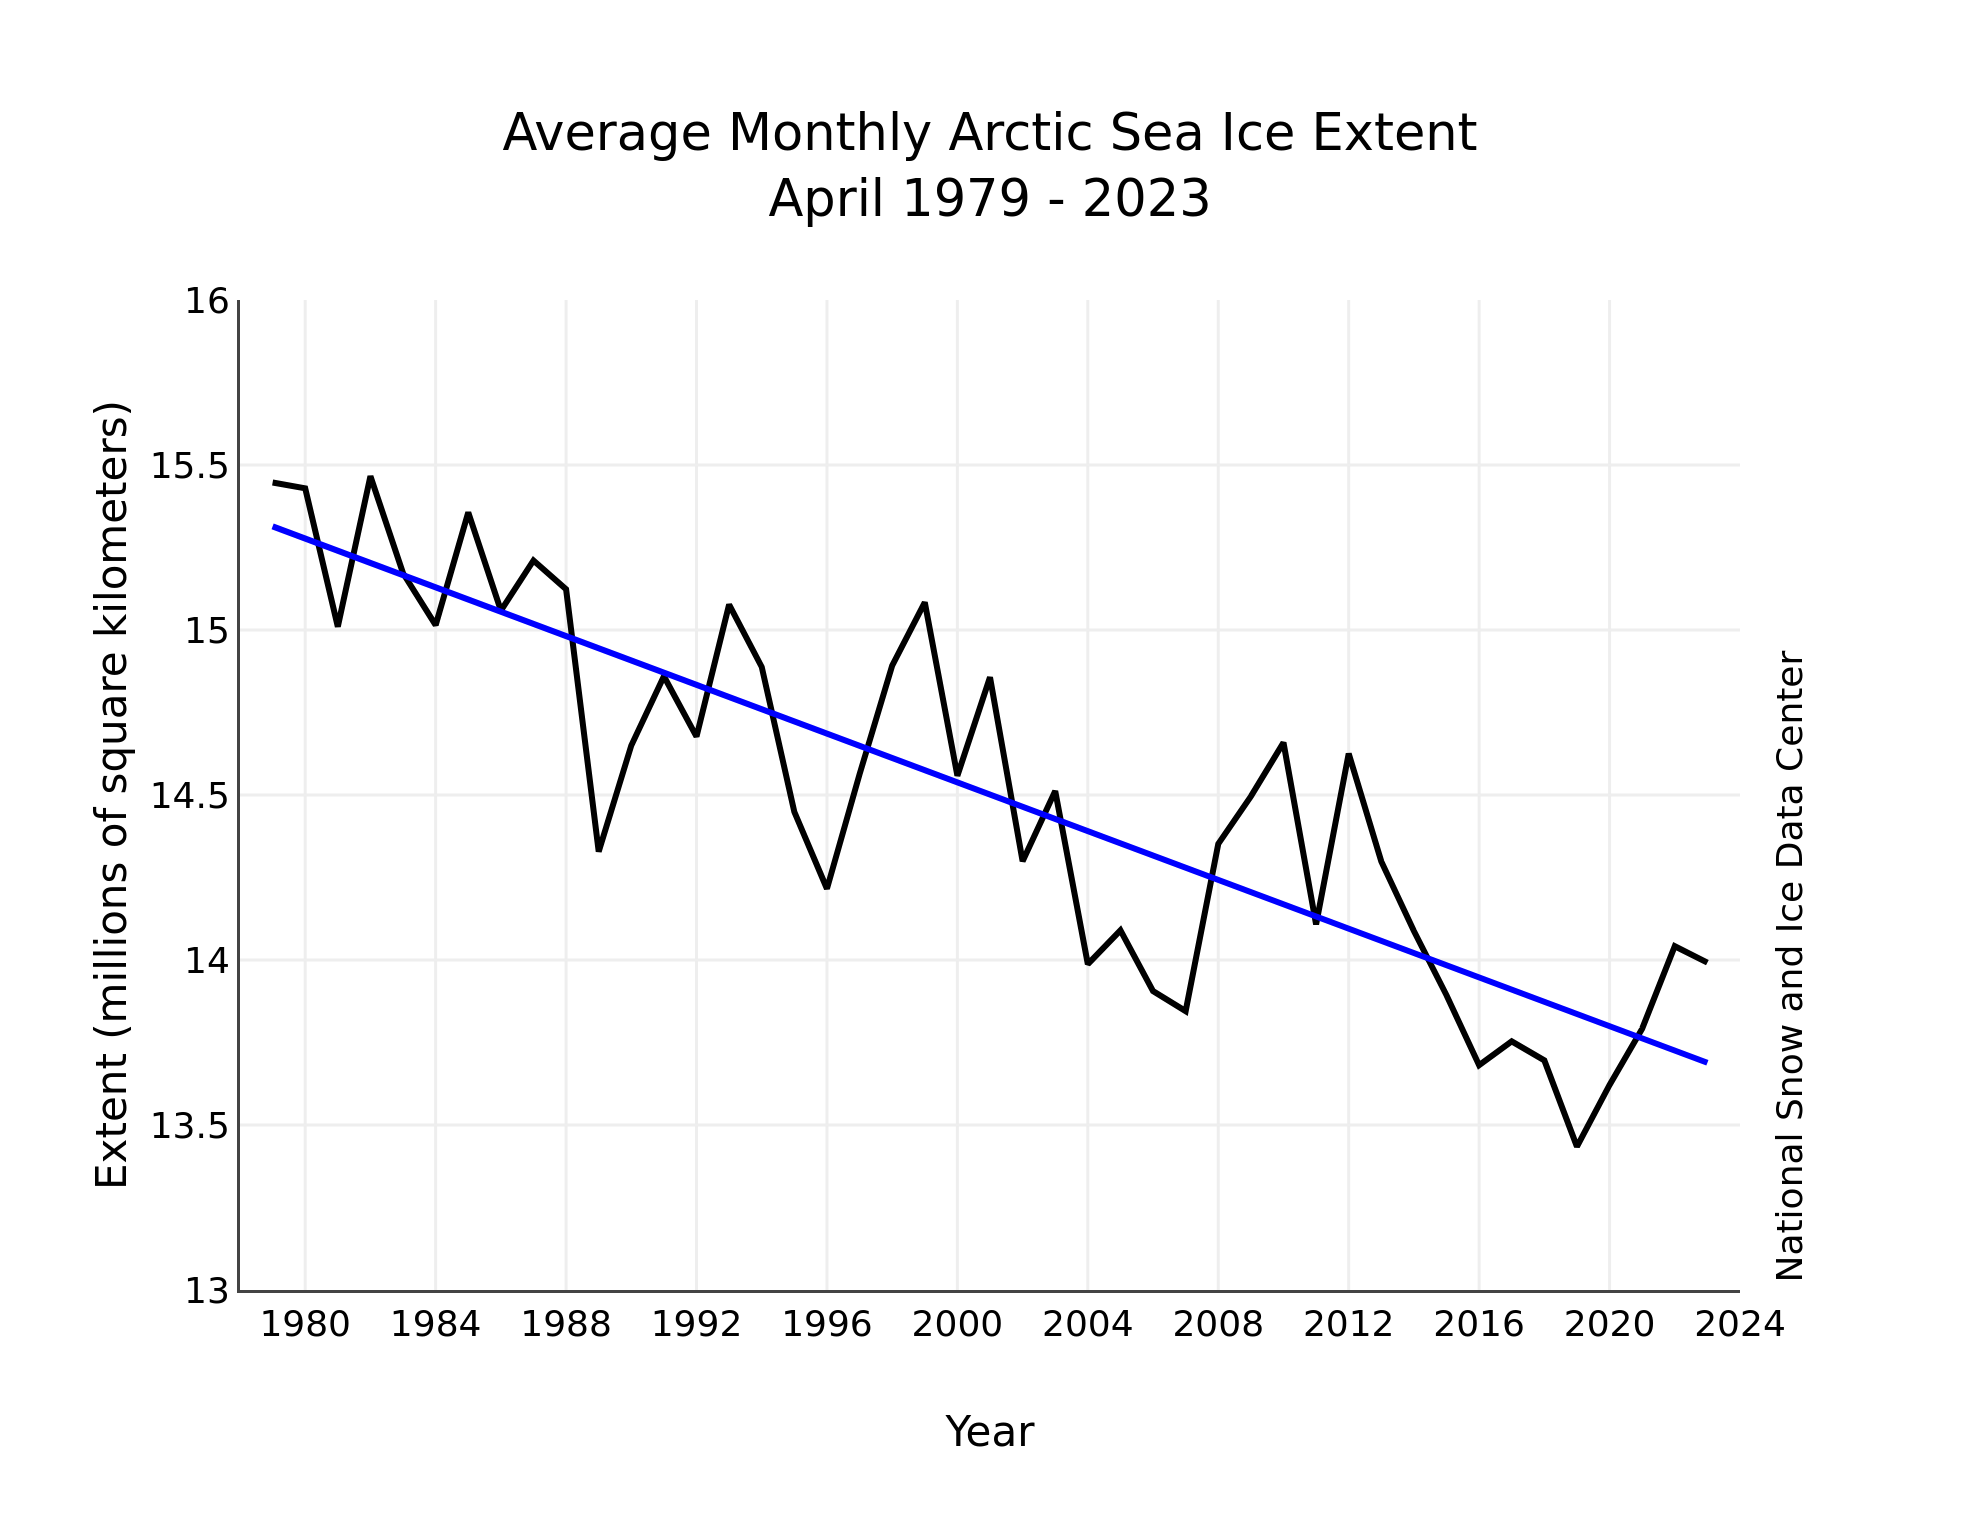
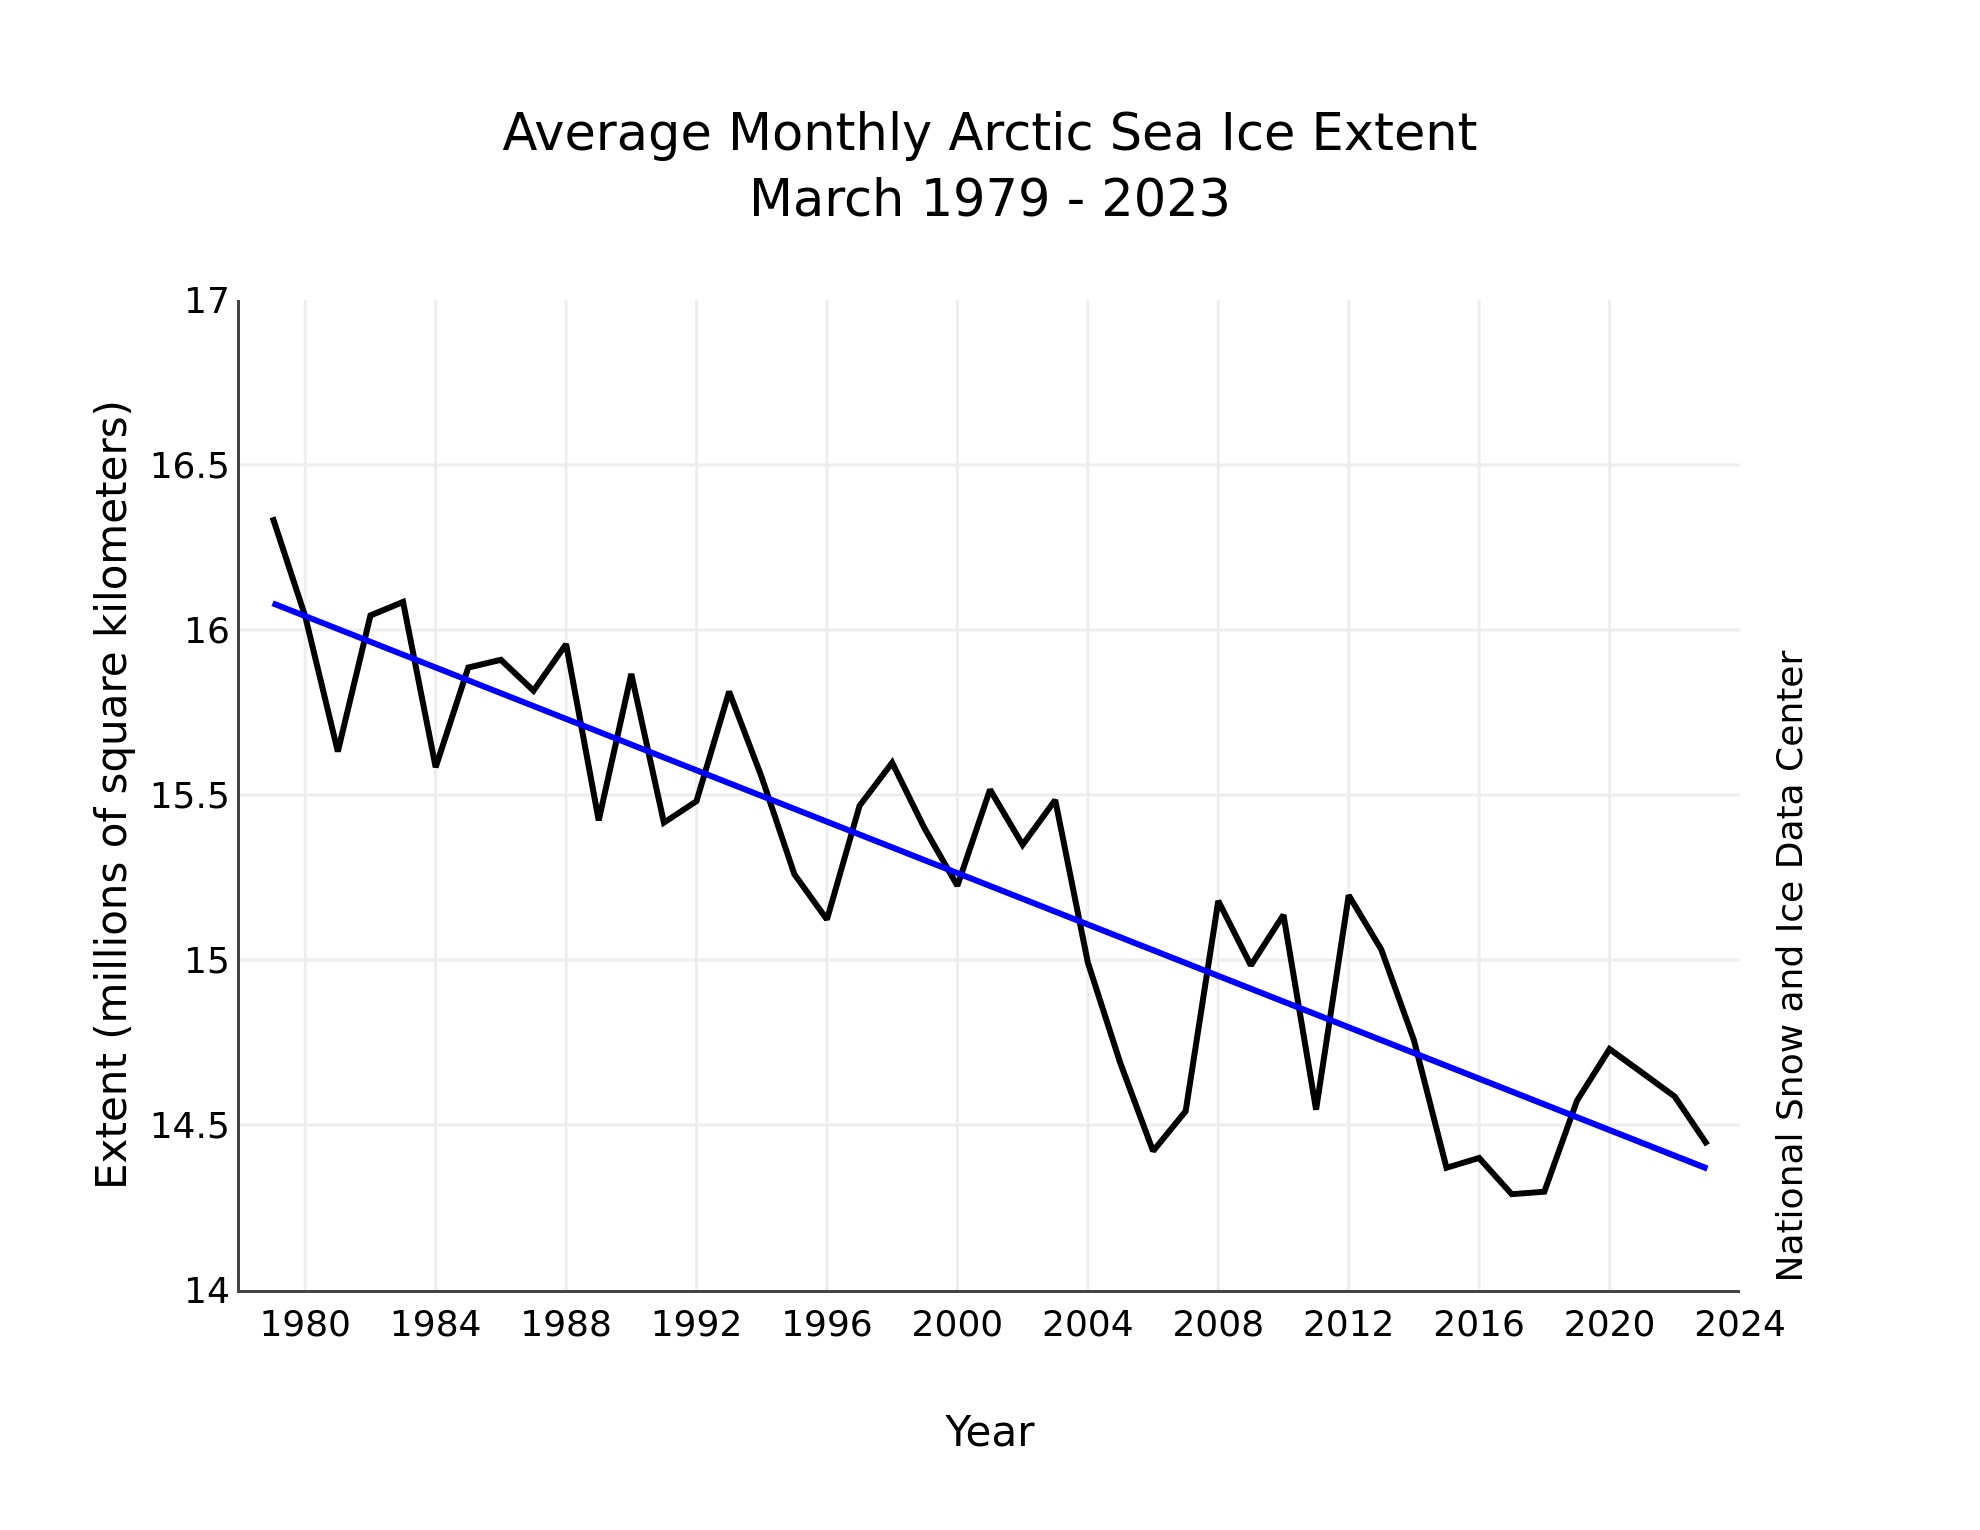
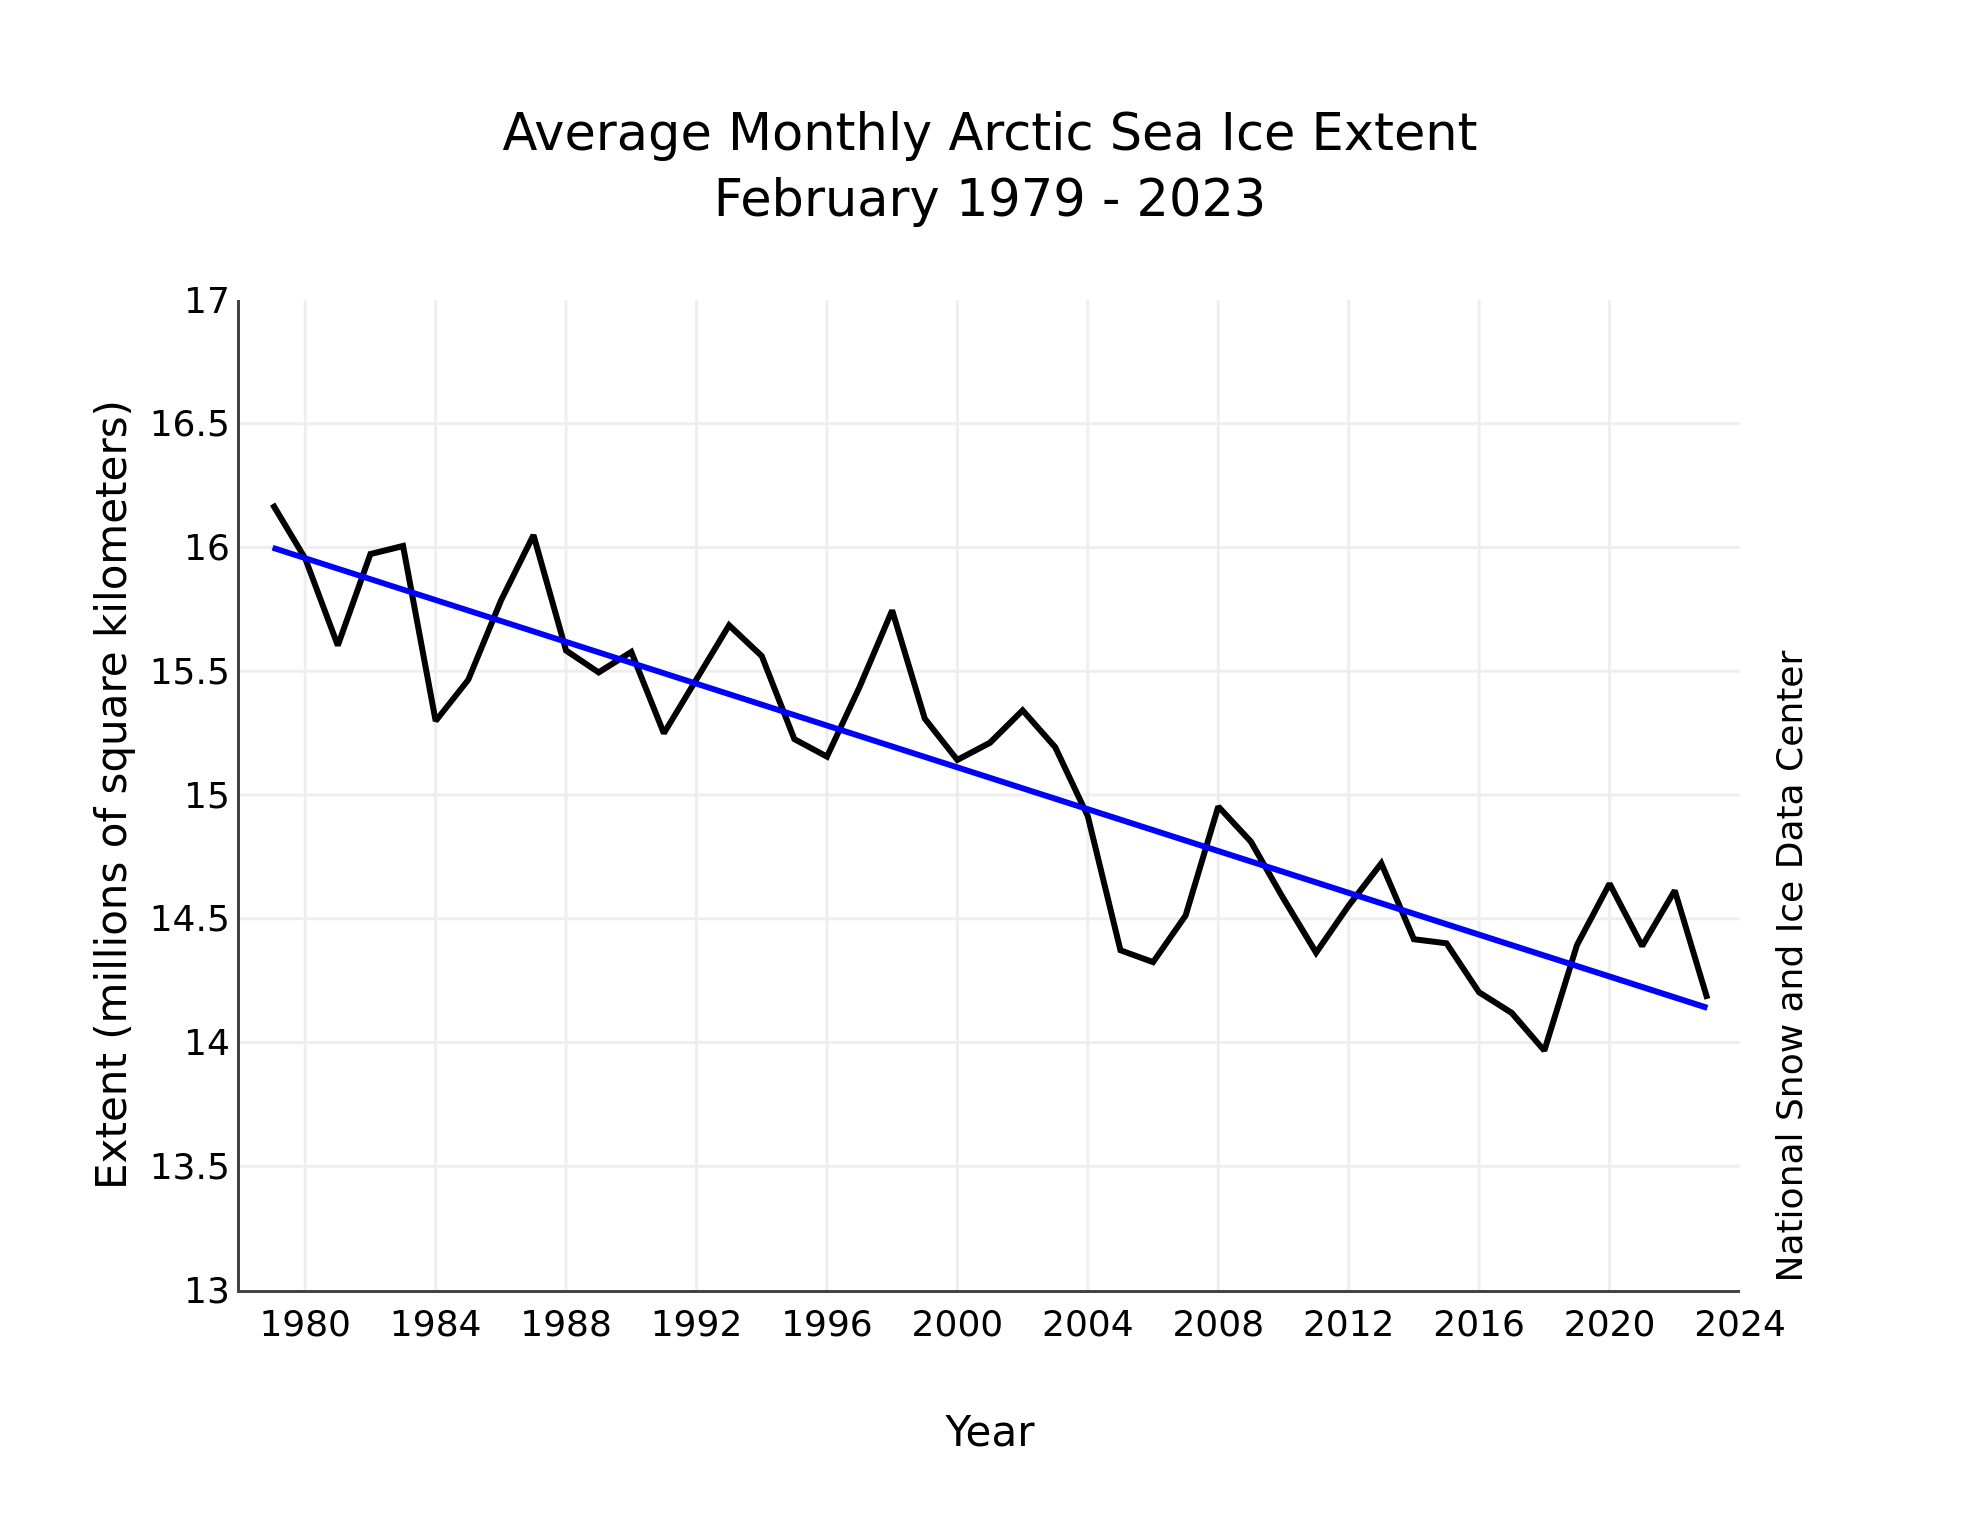
Figure 3. Monthly June sea ice extent for 1979 to 2023 shows a decline of 3.8 percent per decade.
Credit: National Snow and Ice Data Center
High-resolution image
The downward linear trend in Arctic sea ice extent in June over the 45-year satellite record is 44,300 square kilometers (17,100 square miles) per year, or 3.8 percent per decade relative to the 1981 to 2010 average (Figure 3). Based on the linear trend, since 1979, June has lost 1.99 million square kilometers (768,000 square miles) of ice. This is roughly equivalent to the size of Mexico.
An update on sea ice age
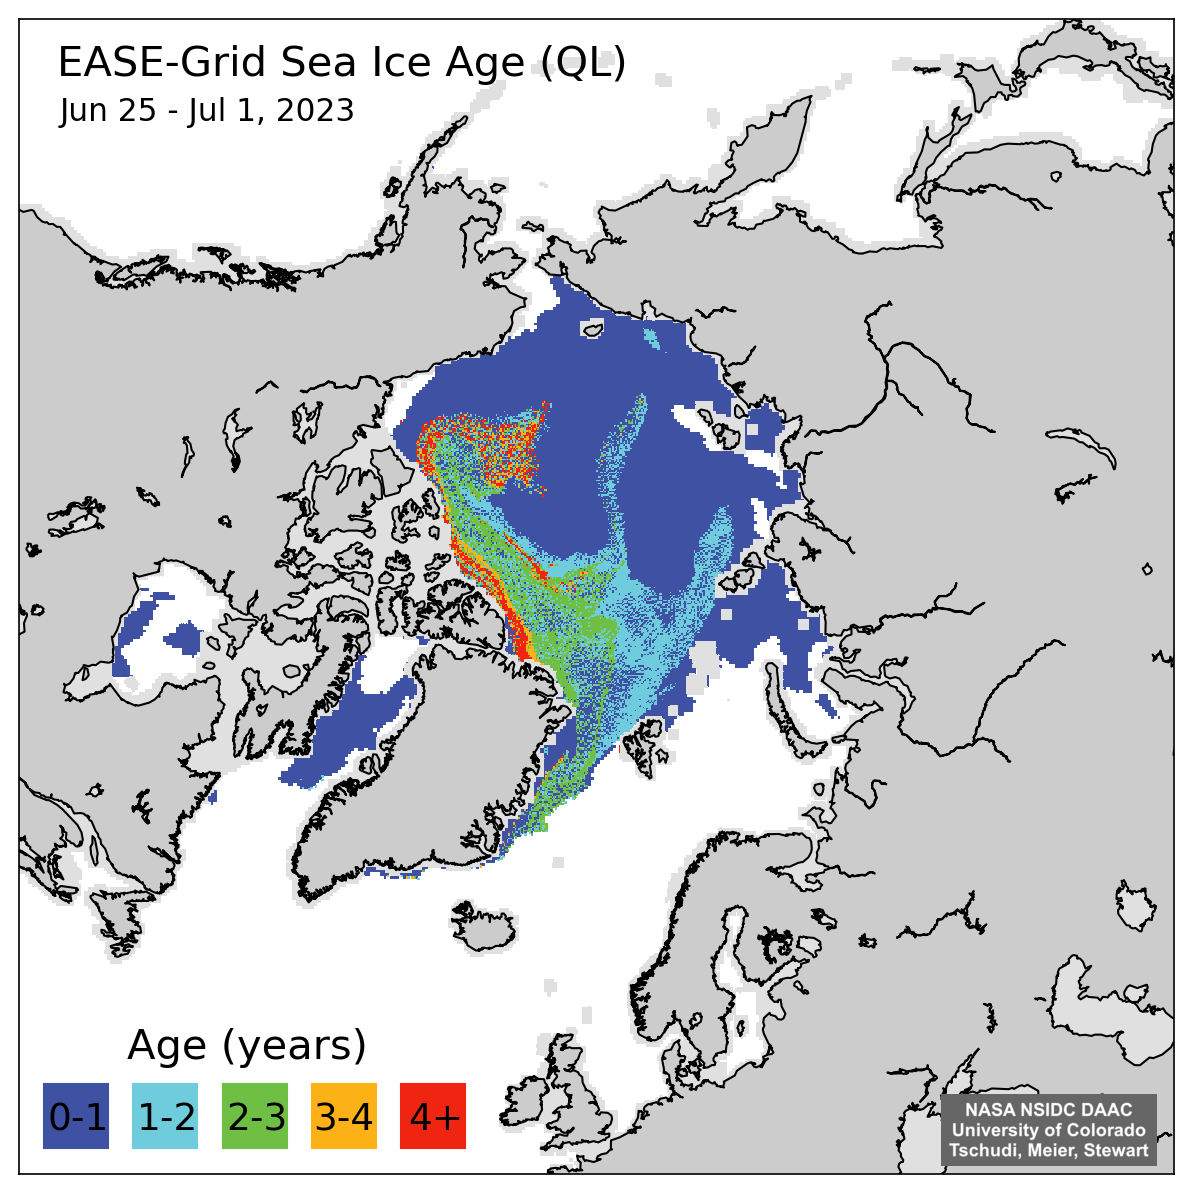
Figure 4. This map shows sea ice age for the week of June 25 to July 1, 2023. Dark blue represents up to one-year-old ice, light blue represents one- to two-year-old ice, green represents two- to three-year-old ice, orange represents three- to four-year-old ice, and red represents ice more than four years old.
Credit: Data and images are from NSIDC EASE-Grid Sea Ice Age, Version 4 (Tschudi et al., 2019a) and Quicklook Arctic Weekly EASE-Grid Sea Ice Age, Version 1.
High-resolution image
An update of sea ice age reveals extensive areas of first-year ice extending far north from the Siberian coast. While first-year ice is generally thinner and more prone to melt completely than older ice, the extensive first year ice located in high northern latitudes may not melt out completely. An area of multiyear ice, much of it 4+-years old residing in the Beaufort Sea region, will likely survive the summer melt season.
Solar geoengineering studies highlight the urgent need to limit global warming to 1.5 degrees Celsius
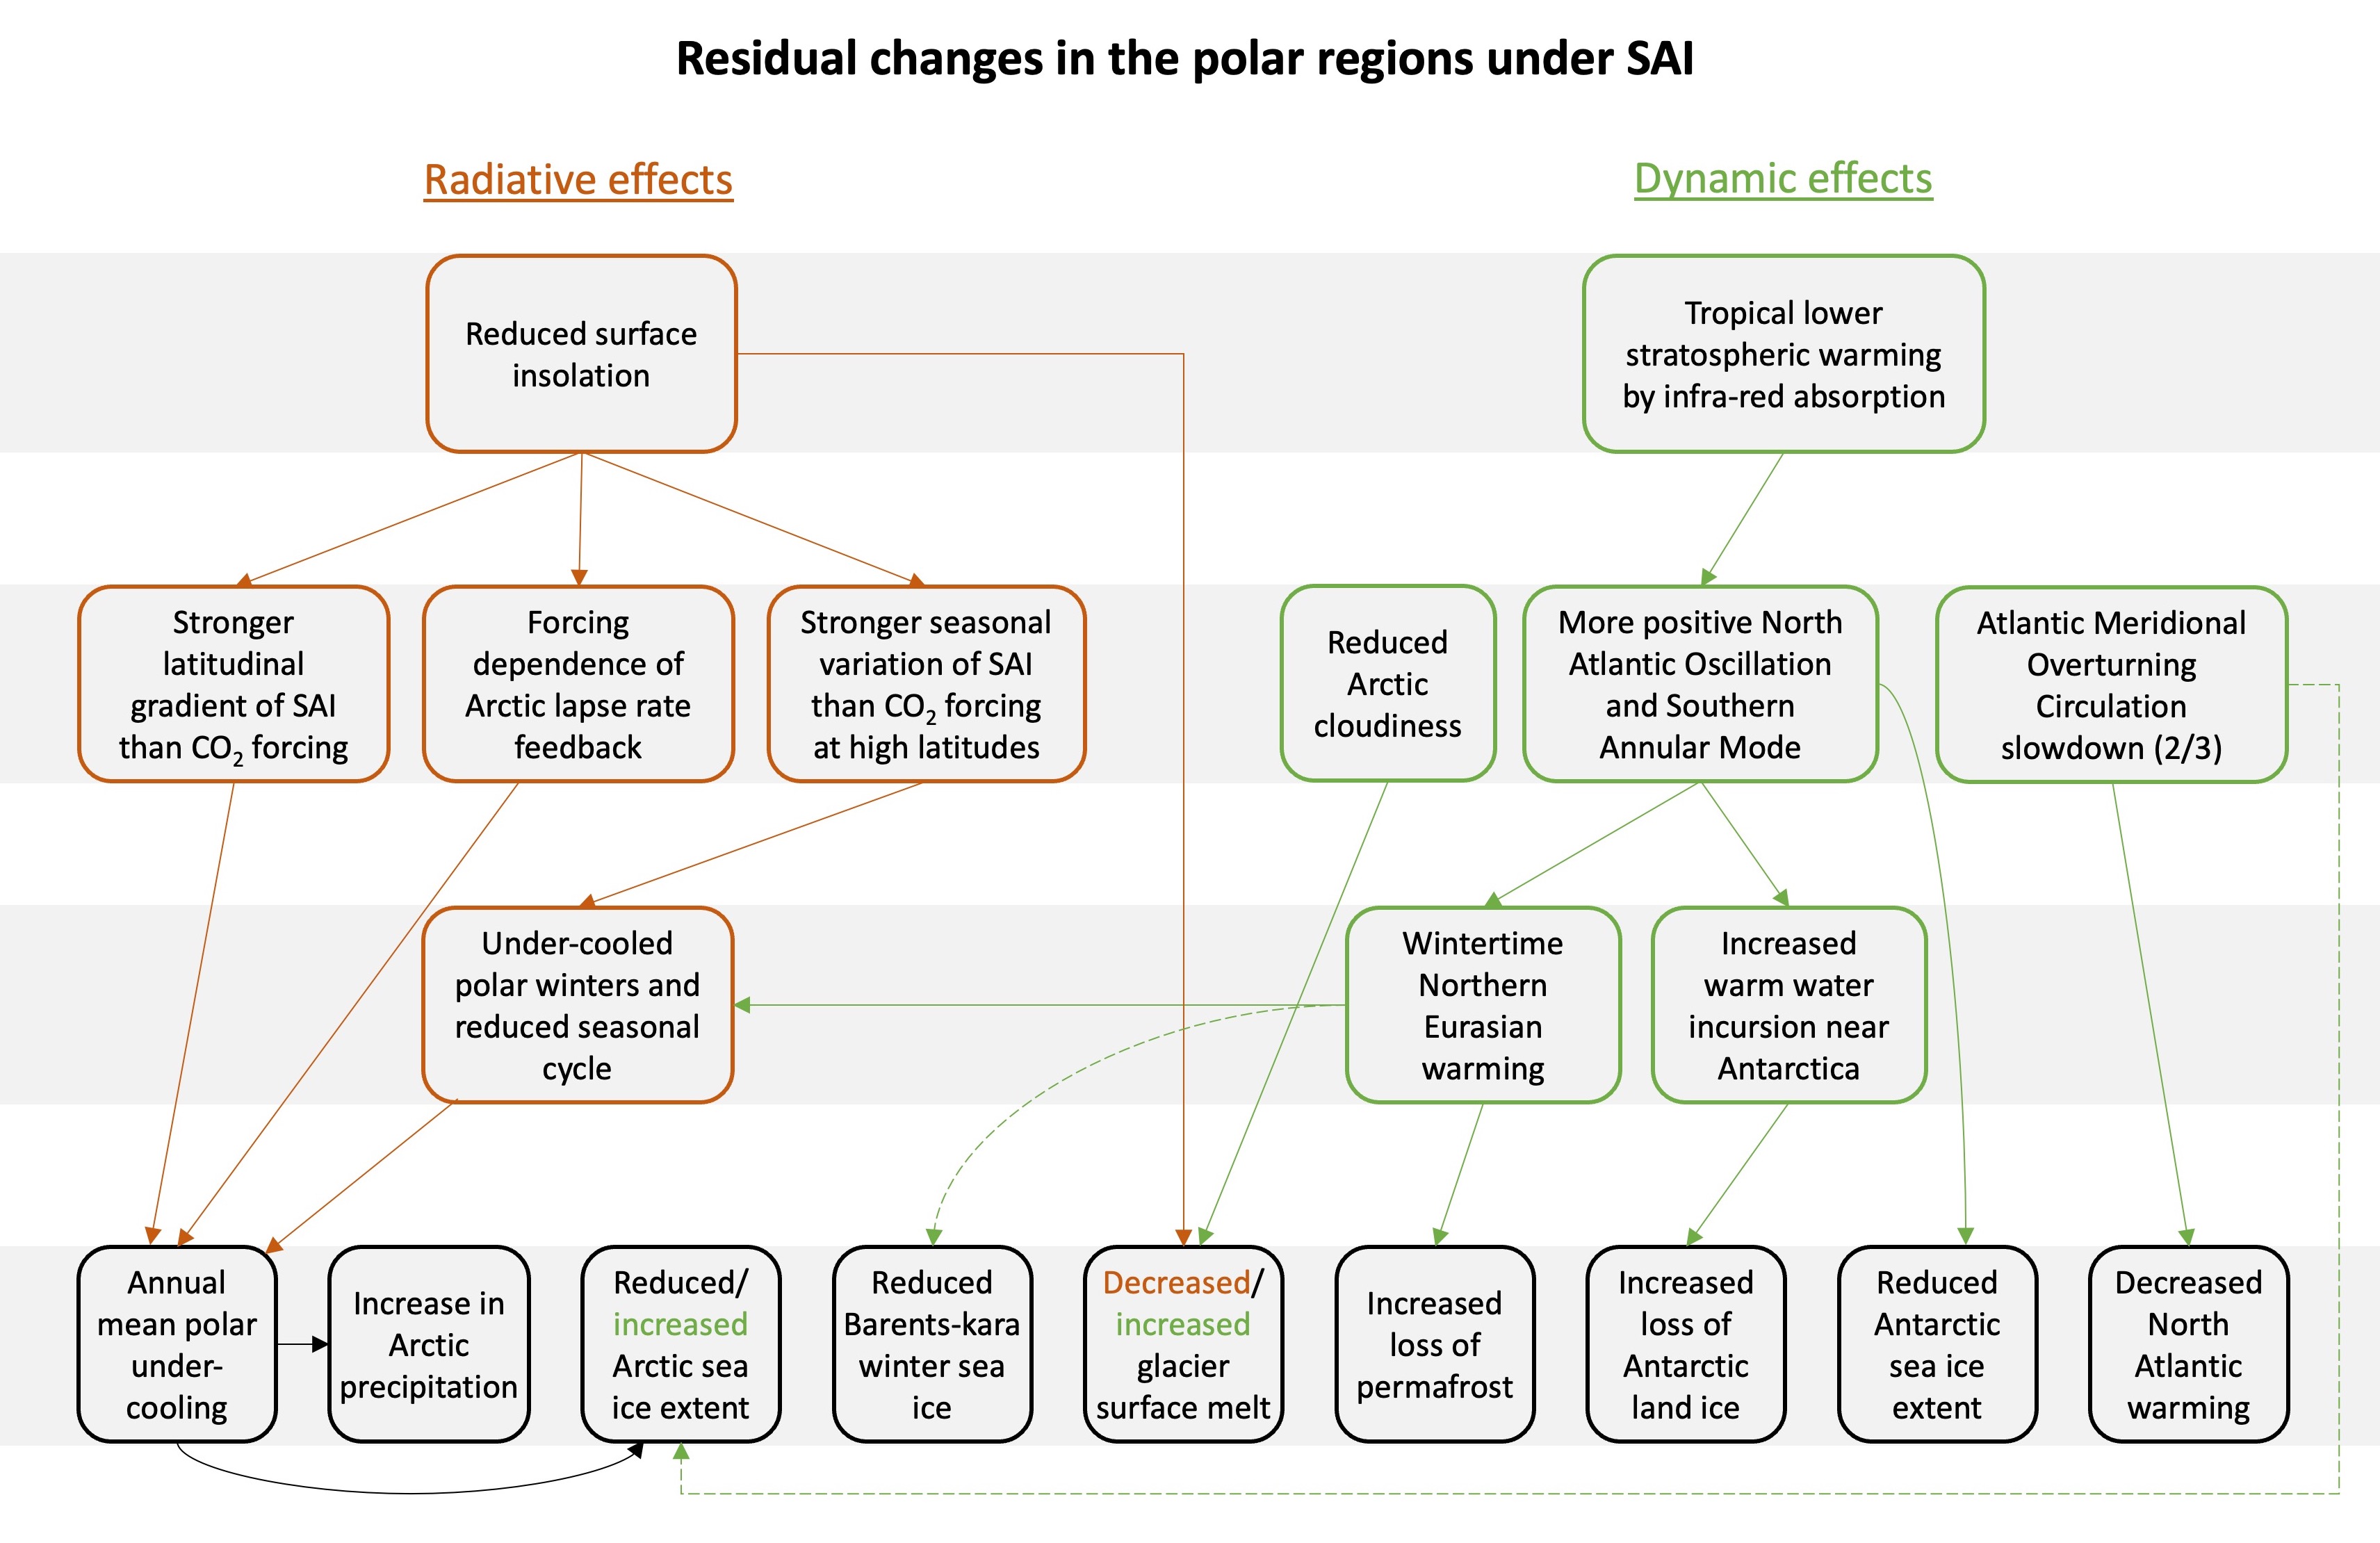
Figure 5. This figure shows interactions potentially resulting in residual changes in the polar regions under global Stratospheric Aerosol Injection (SAI), relative to a world at the same global mean temperature without SAI. The figure does not show the first order effect of SAI, which is to cool the planet and reverse the effects of climate change, but only the residual changes. This is a simplified version of the full figure in Duffey et al. (2023). See the full figure for individual studies supporting each link and the definitions of “radiative” and “dynamic” effects. Where studies disagree on the sign of a change, the number supporting the statement in the box is indicated in brackets. Where interactions have opposite impacts on residual changes, this is indicated by color coding.
Credit: Alistair Duffey
High-resolution image
As new studies come out suggesting that the Arctic Ocean may witness its first ice-free summer by the 2030s, solar geoengineering studies have been exploring the potential benefits and pitfalls of reducing incoming sunlight and thus slowing Arctic warming. A review paper co-led by NSIDC scientist Julienne Stroeve explored the impacts of stratospheric aerosol injection on polar climate, considering impacts of both local and global injection of reflective sulfate aerosols into the stratosphere.
Without local injection of aerosols in the Arctic, cooling will not be as effective. However, any consideration of adding aerosols to the stratosphere to reduce incoming sunlight must be balanced by potential impacts on other aspects of the climate system, such as precipitation. If aerosols were only injected into the Arctic for example, drying in Northern Hemisphere lower latitude regions may occur. Furthermore, since the Arctic is dark or mostly dark for up to half of the year, the direct radiative effects of aerosol injection (i.e. blocking of sunlight) will be seasonally dependent. However, stratospheric heating from aerosol injection during the dark period may result in winter-time warming over high-latitude areas.
There are also potential impacts on weather and ocean circulation patterns (Figure 5). This could include more melting from the Antarctic ice shelves, thereby increasing Antarctic’s contribution to sea level rise. Atmospheric responses must be viewed with caution as the sensitivity of Arctic to changes in atmospheric circulation in climate models used for these types of assessments is not realistically simulated.
Antarctic extent remains low
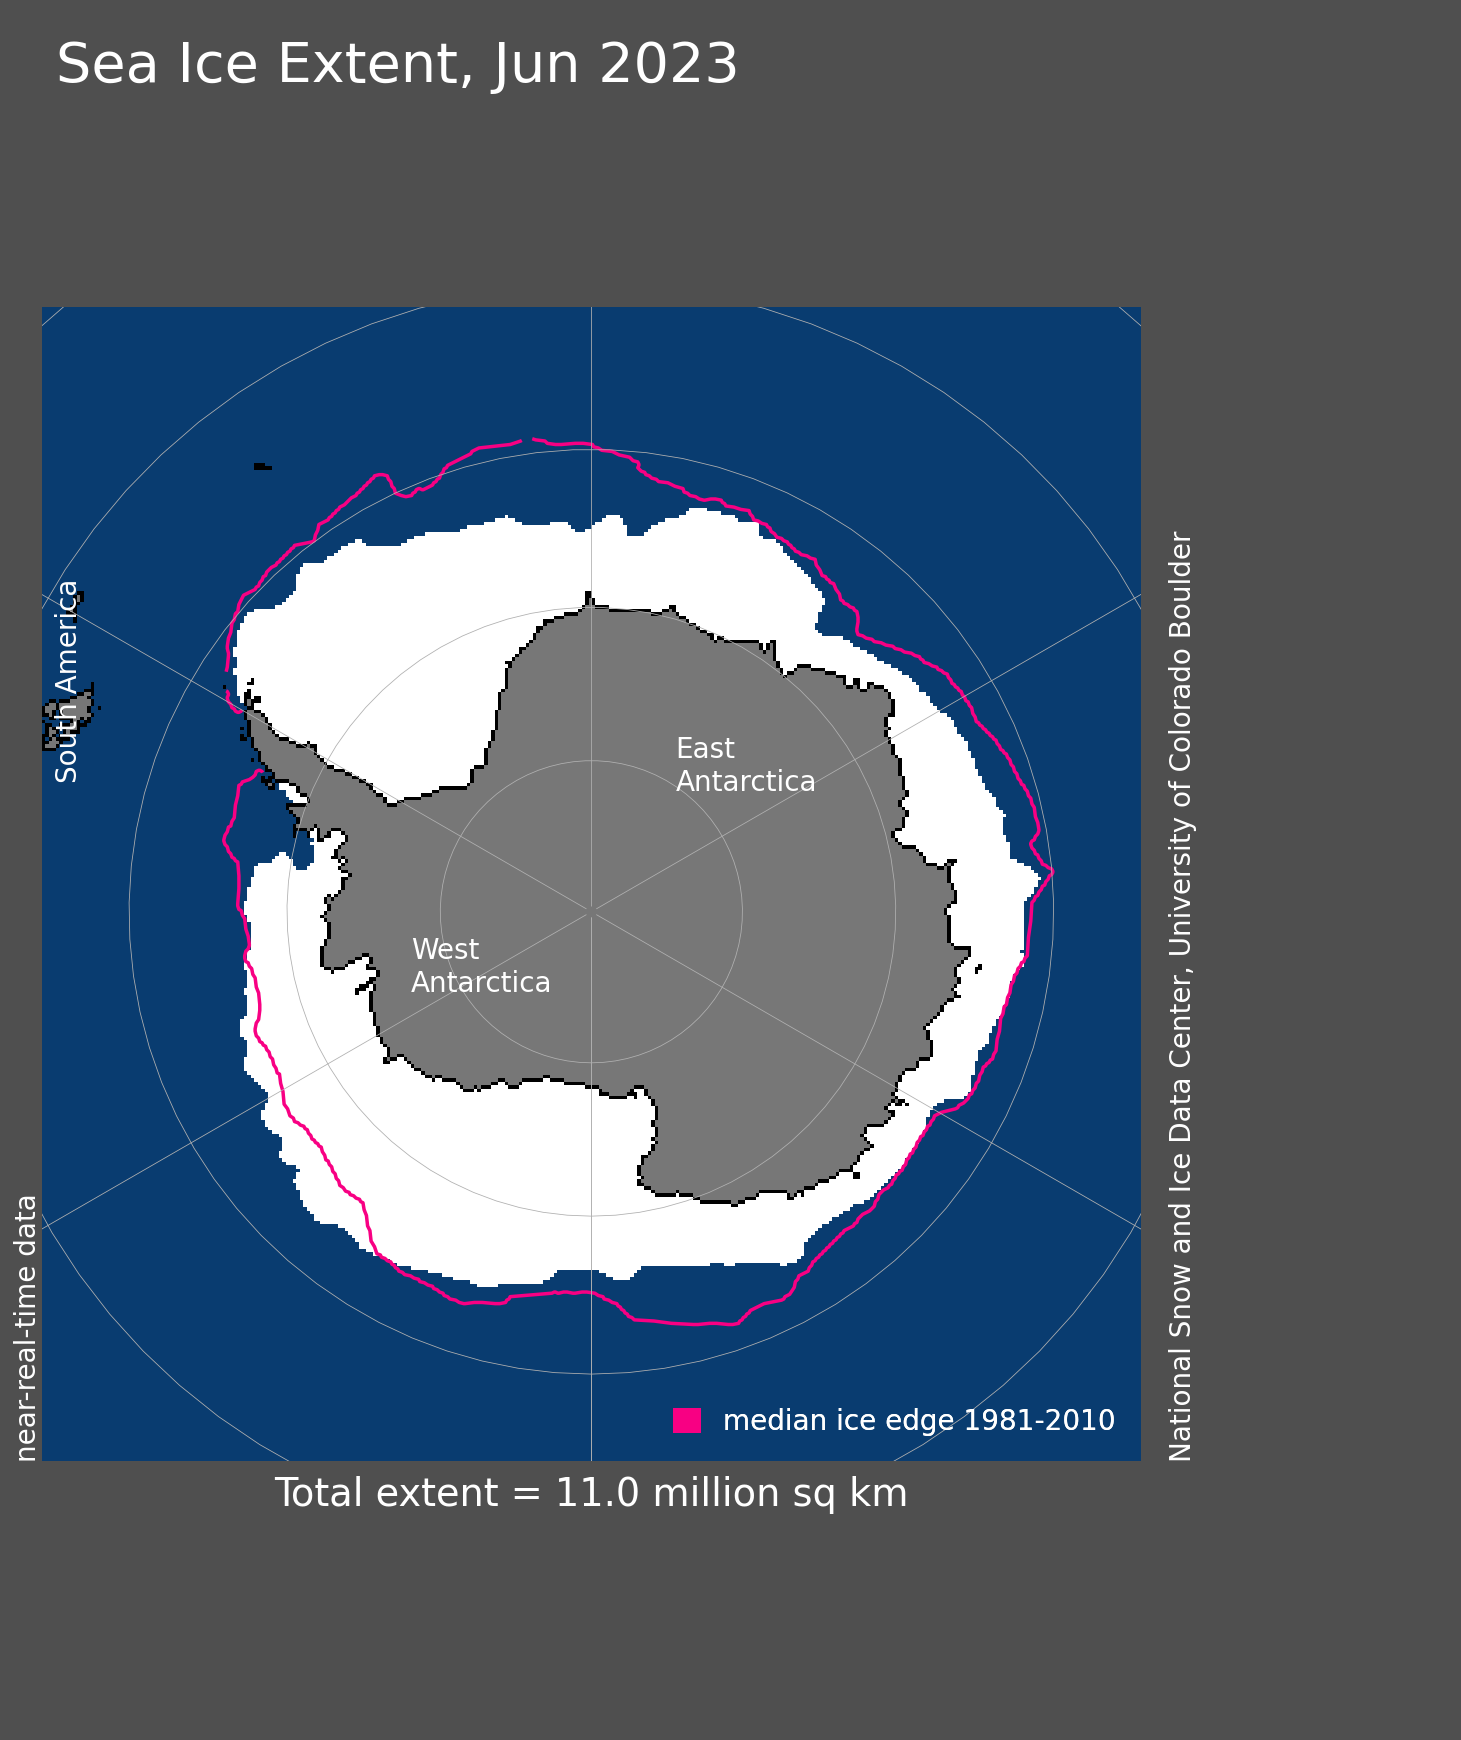
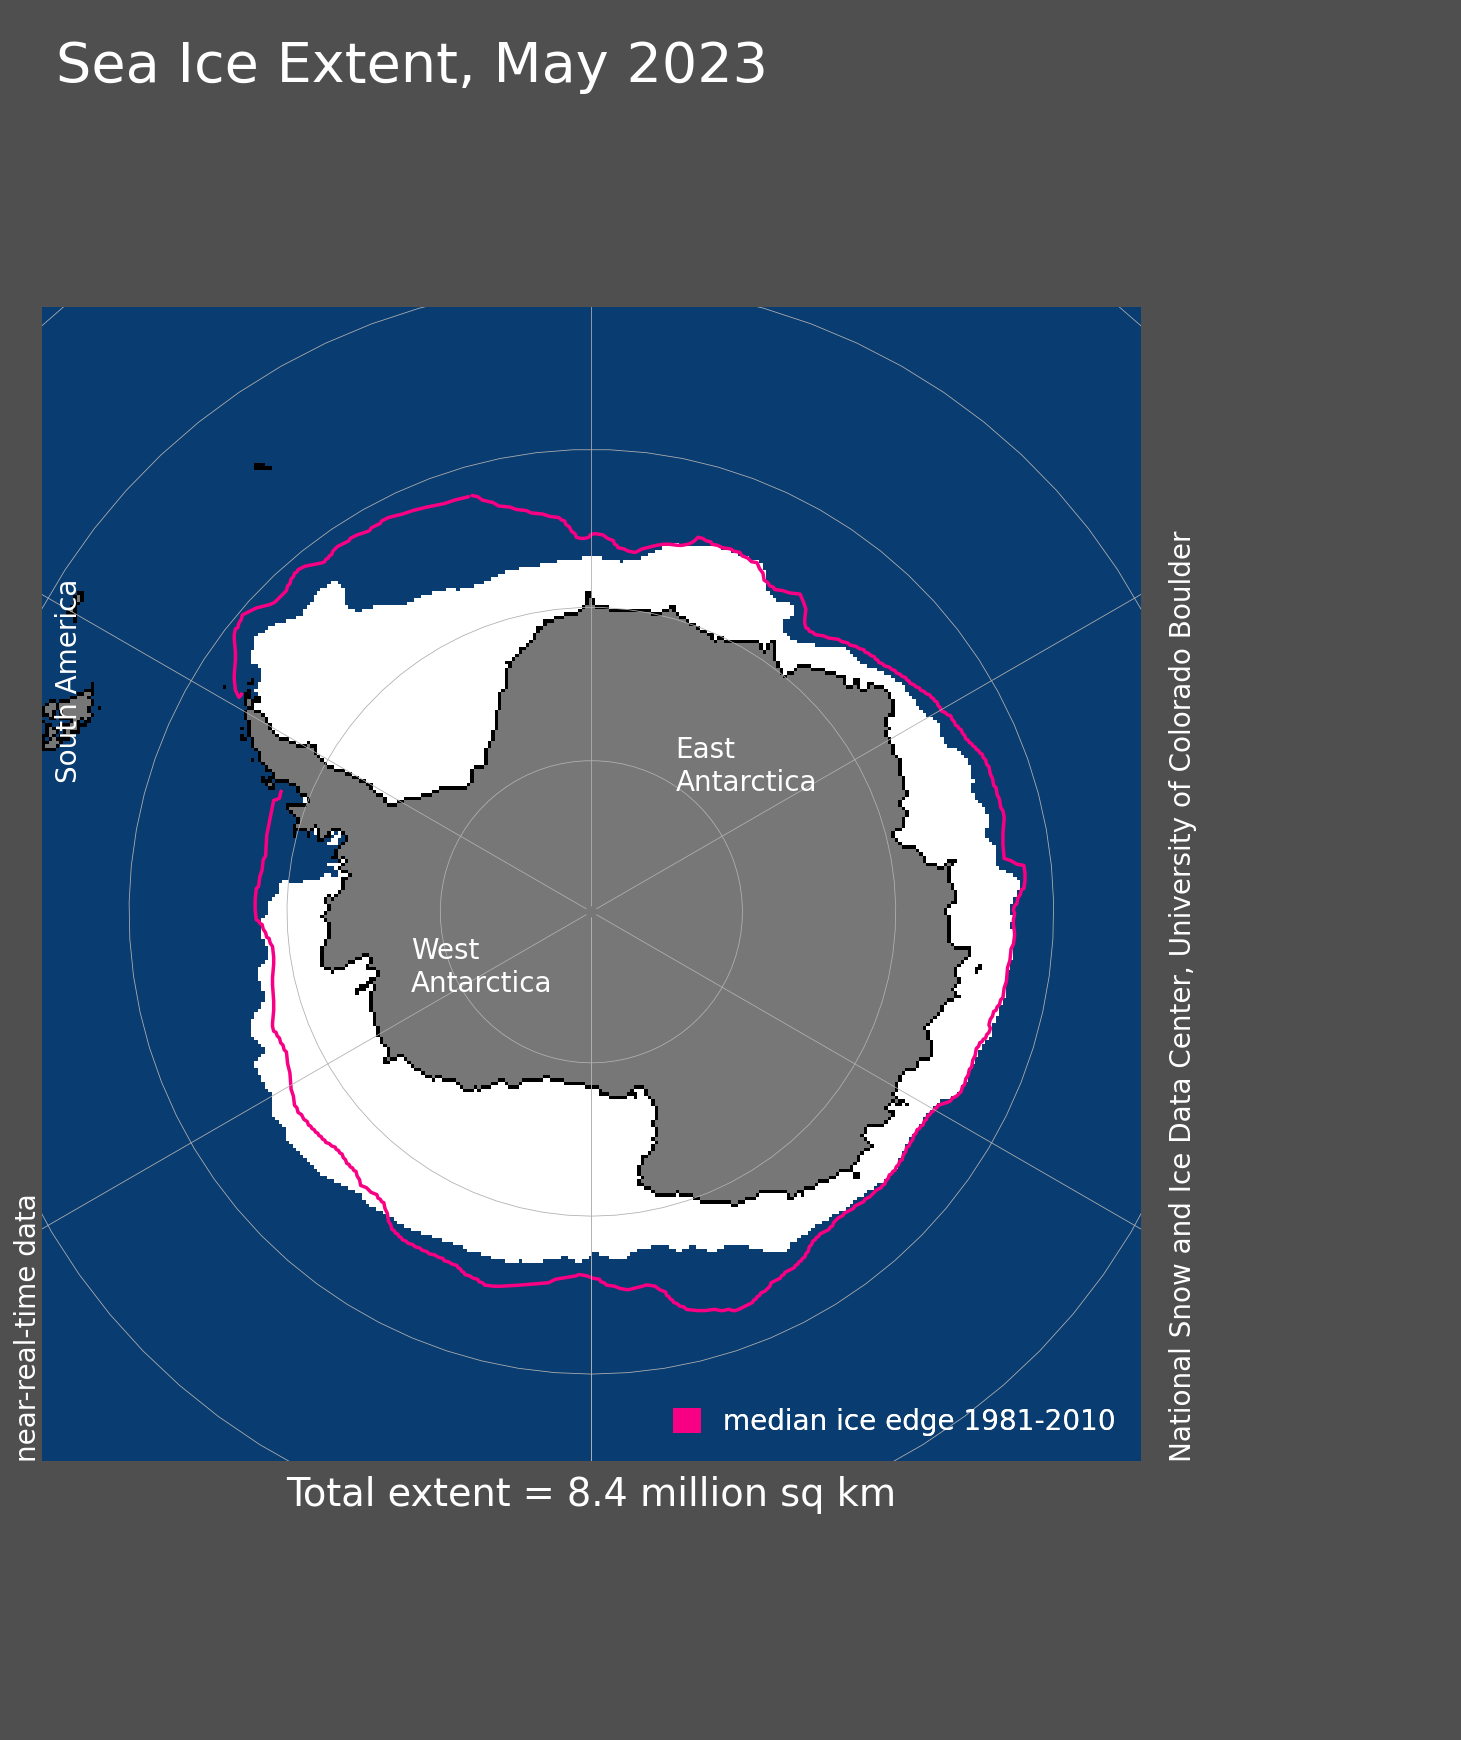
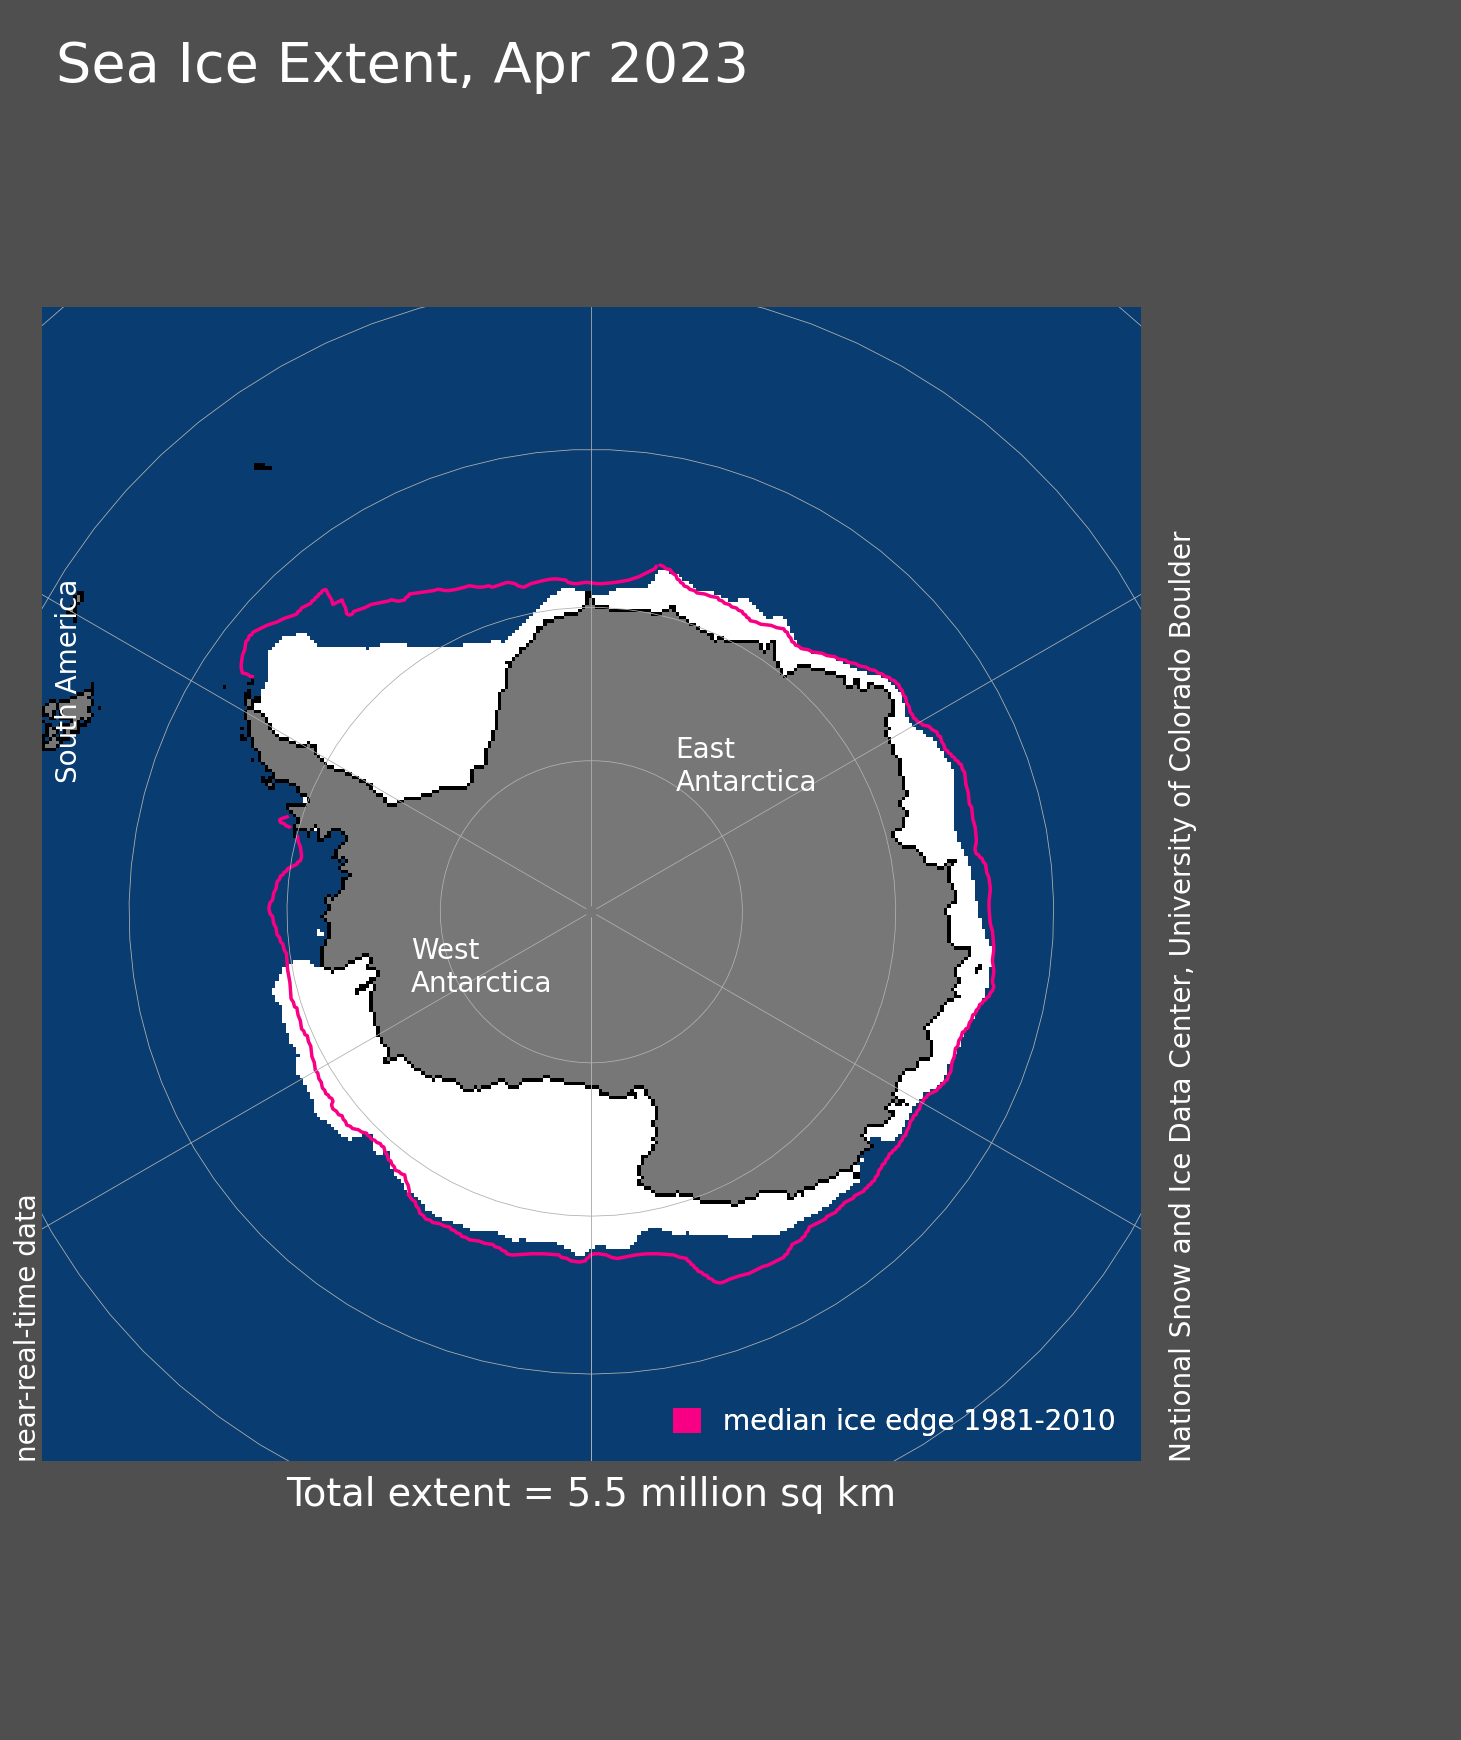
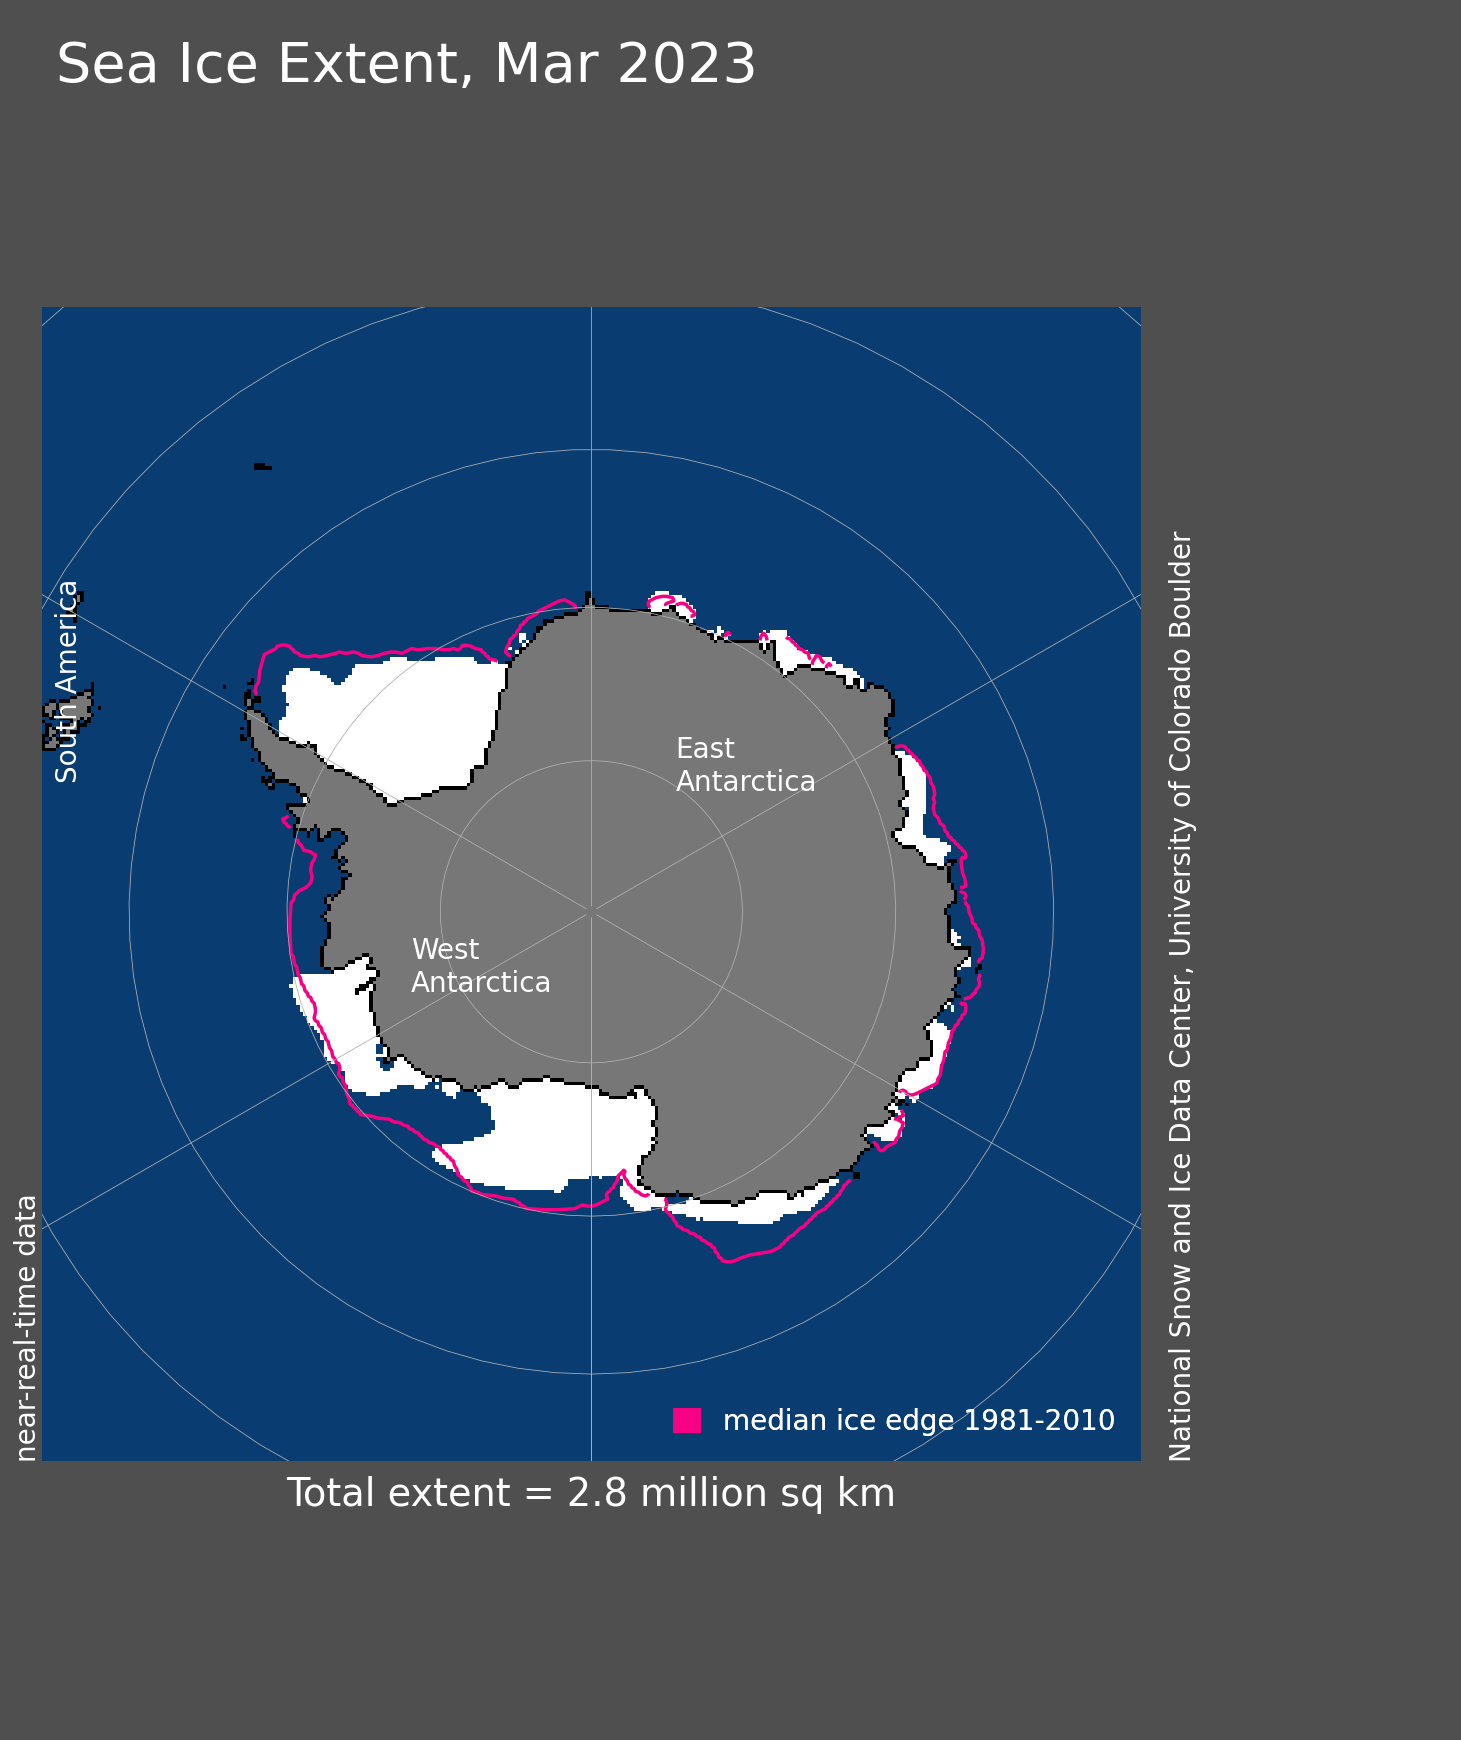
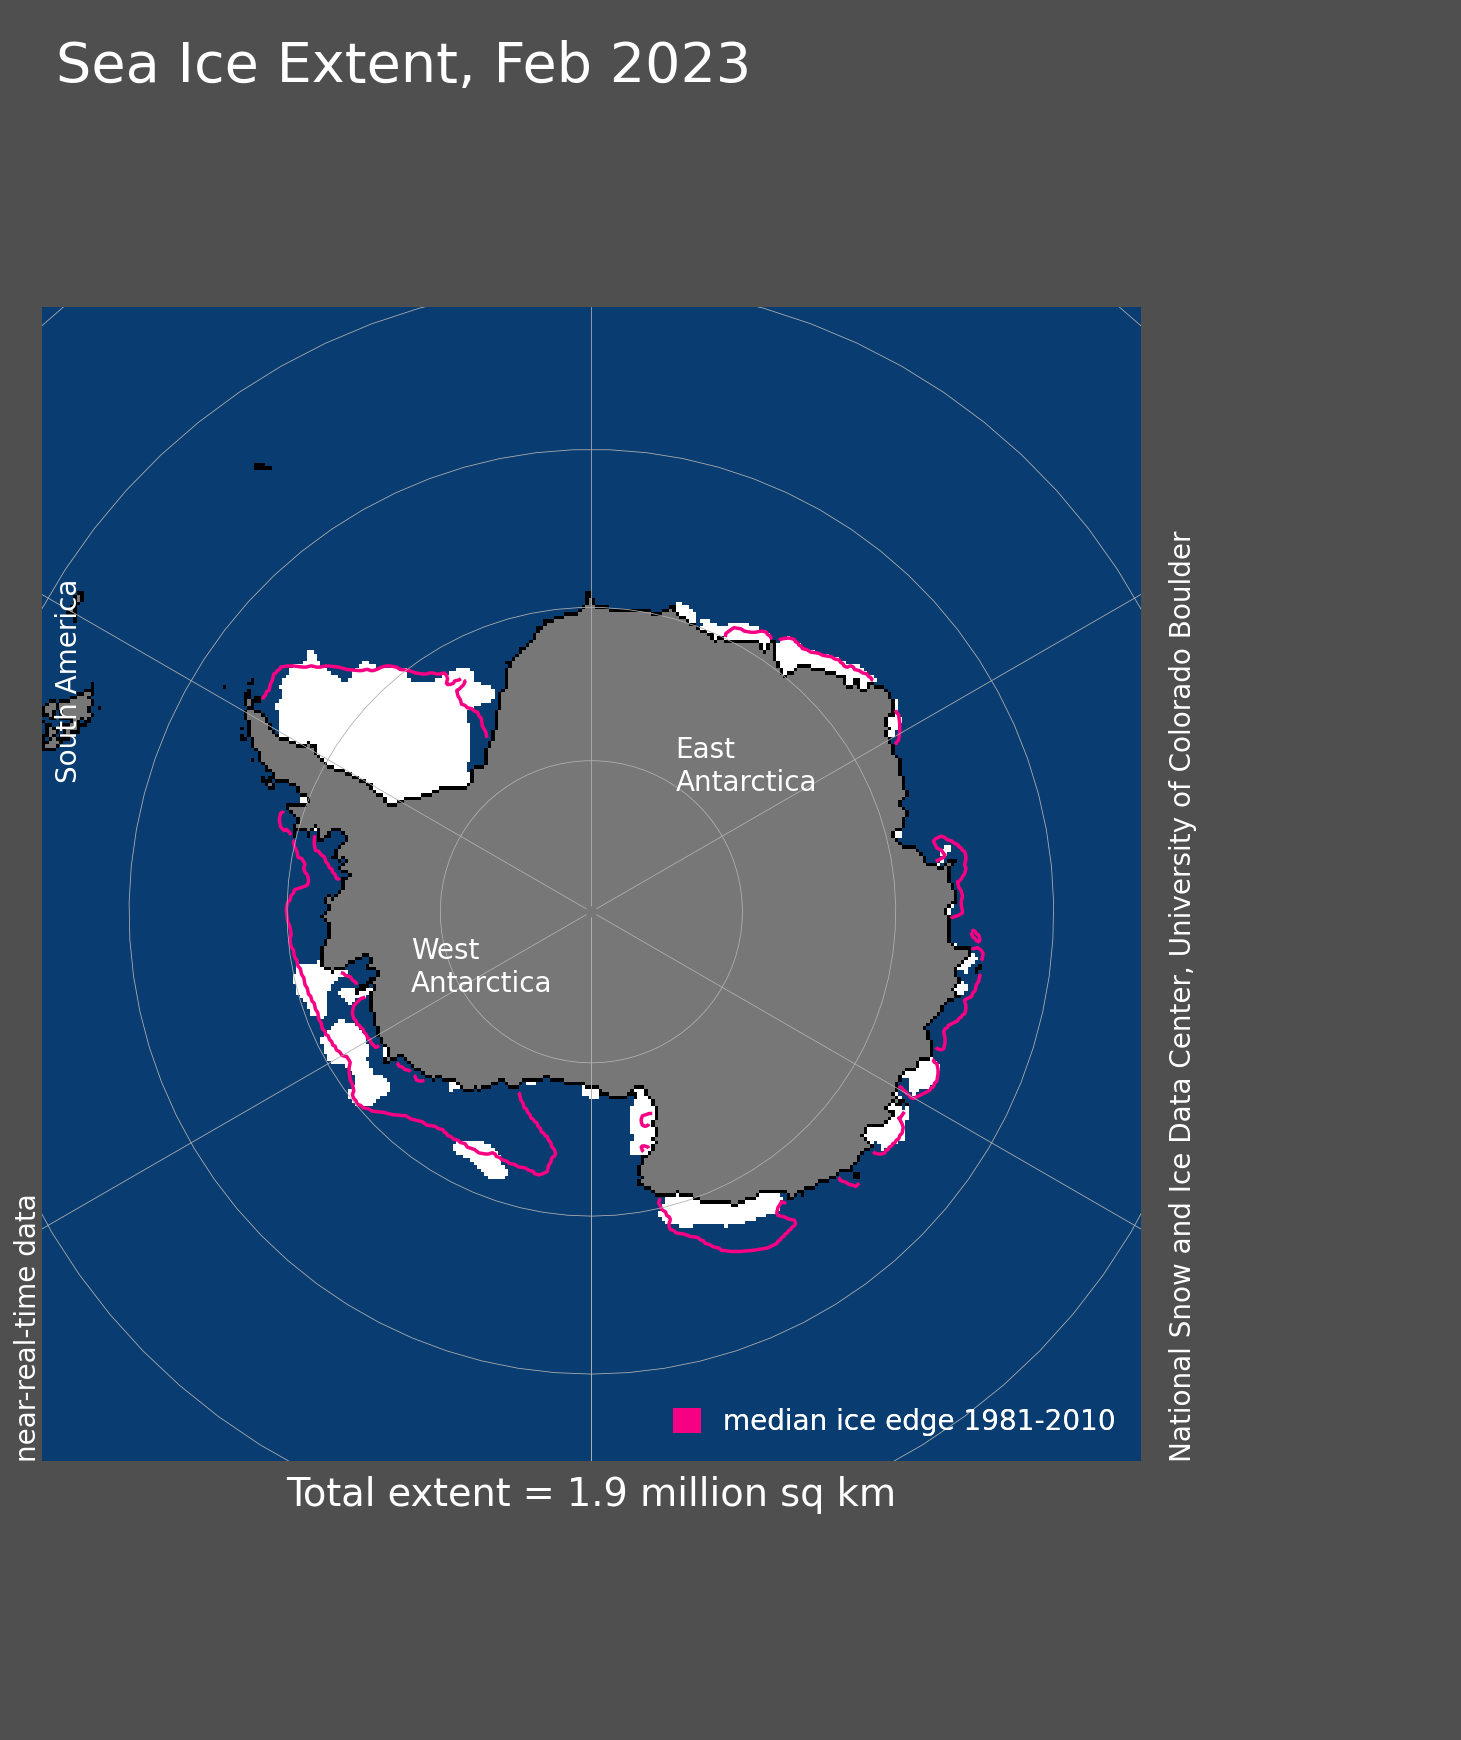
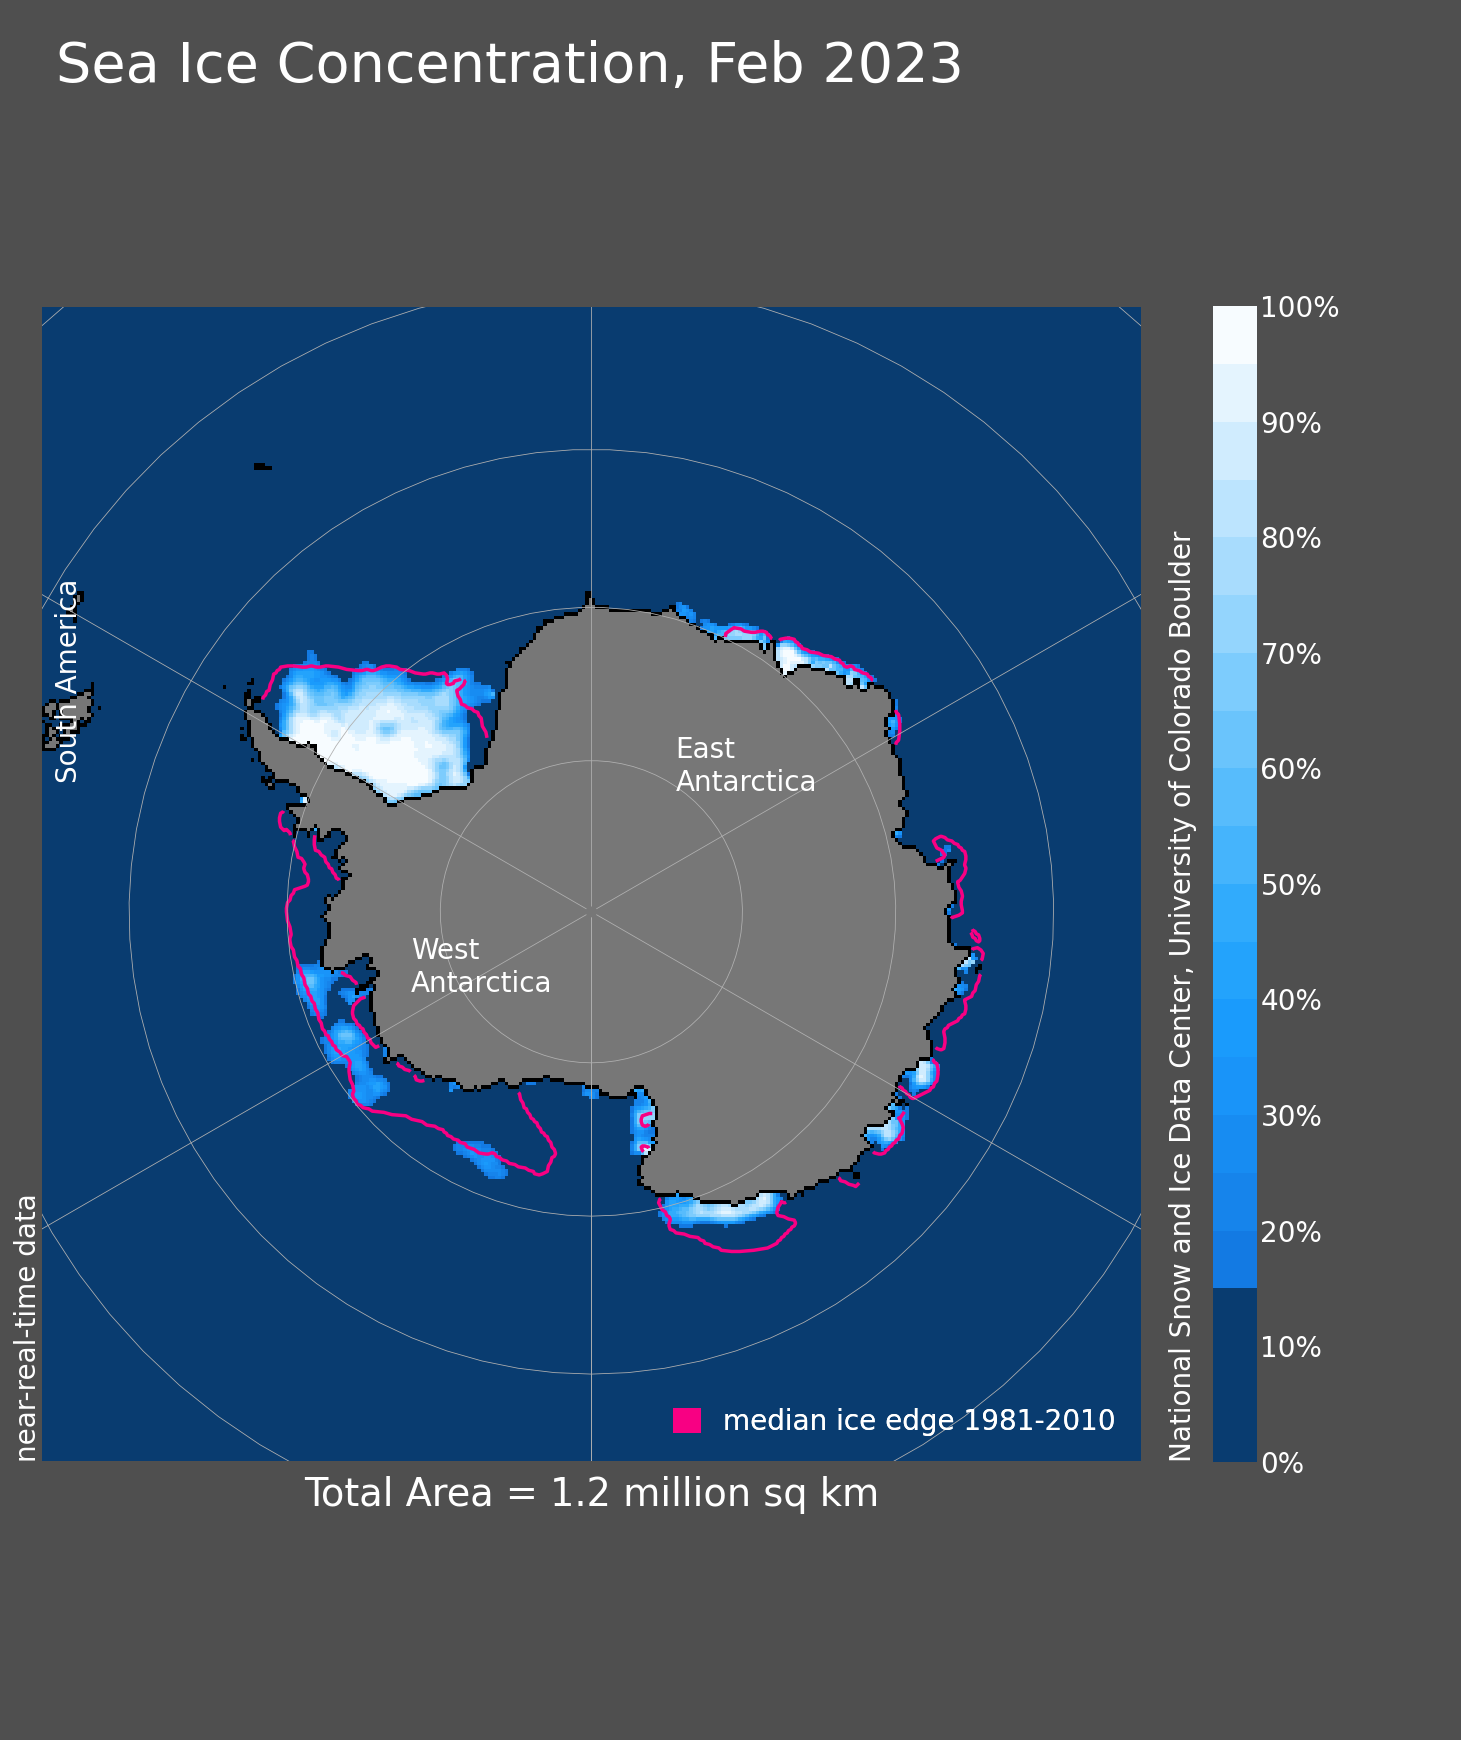
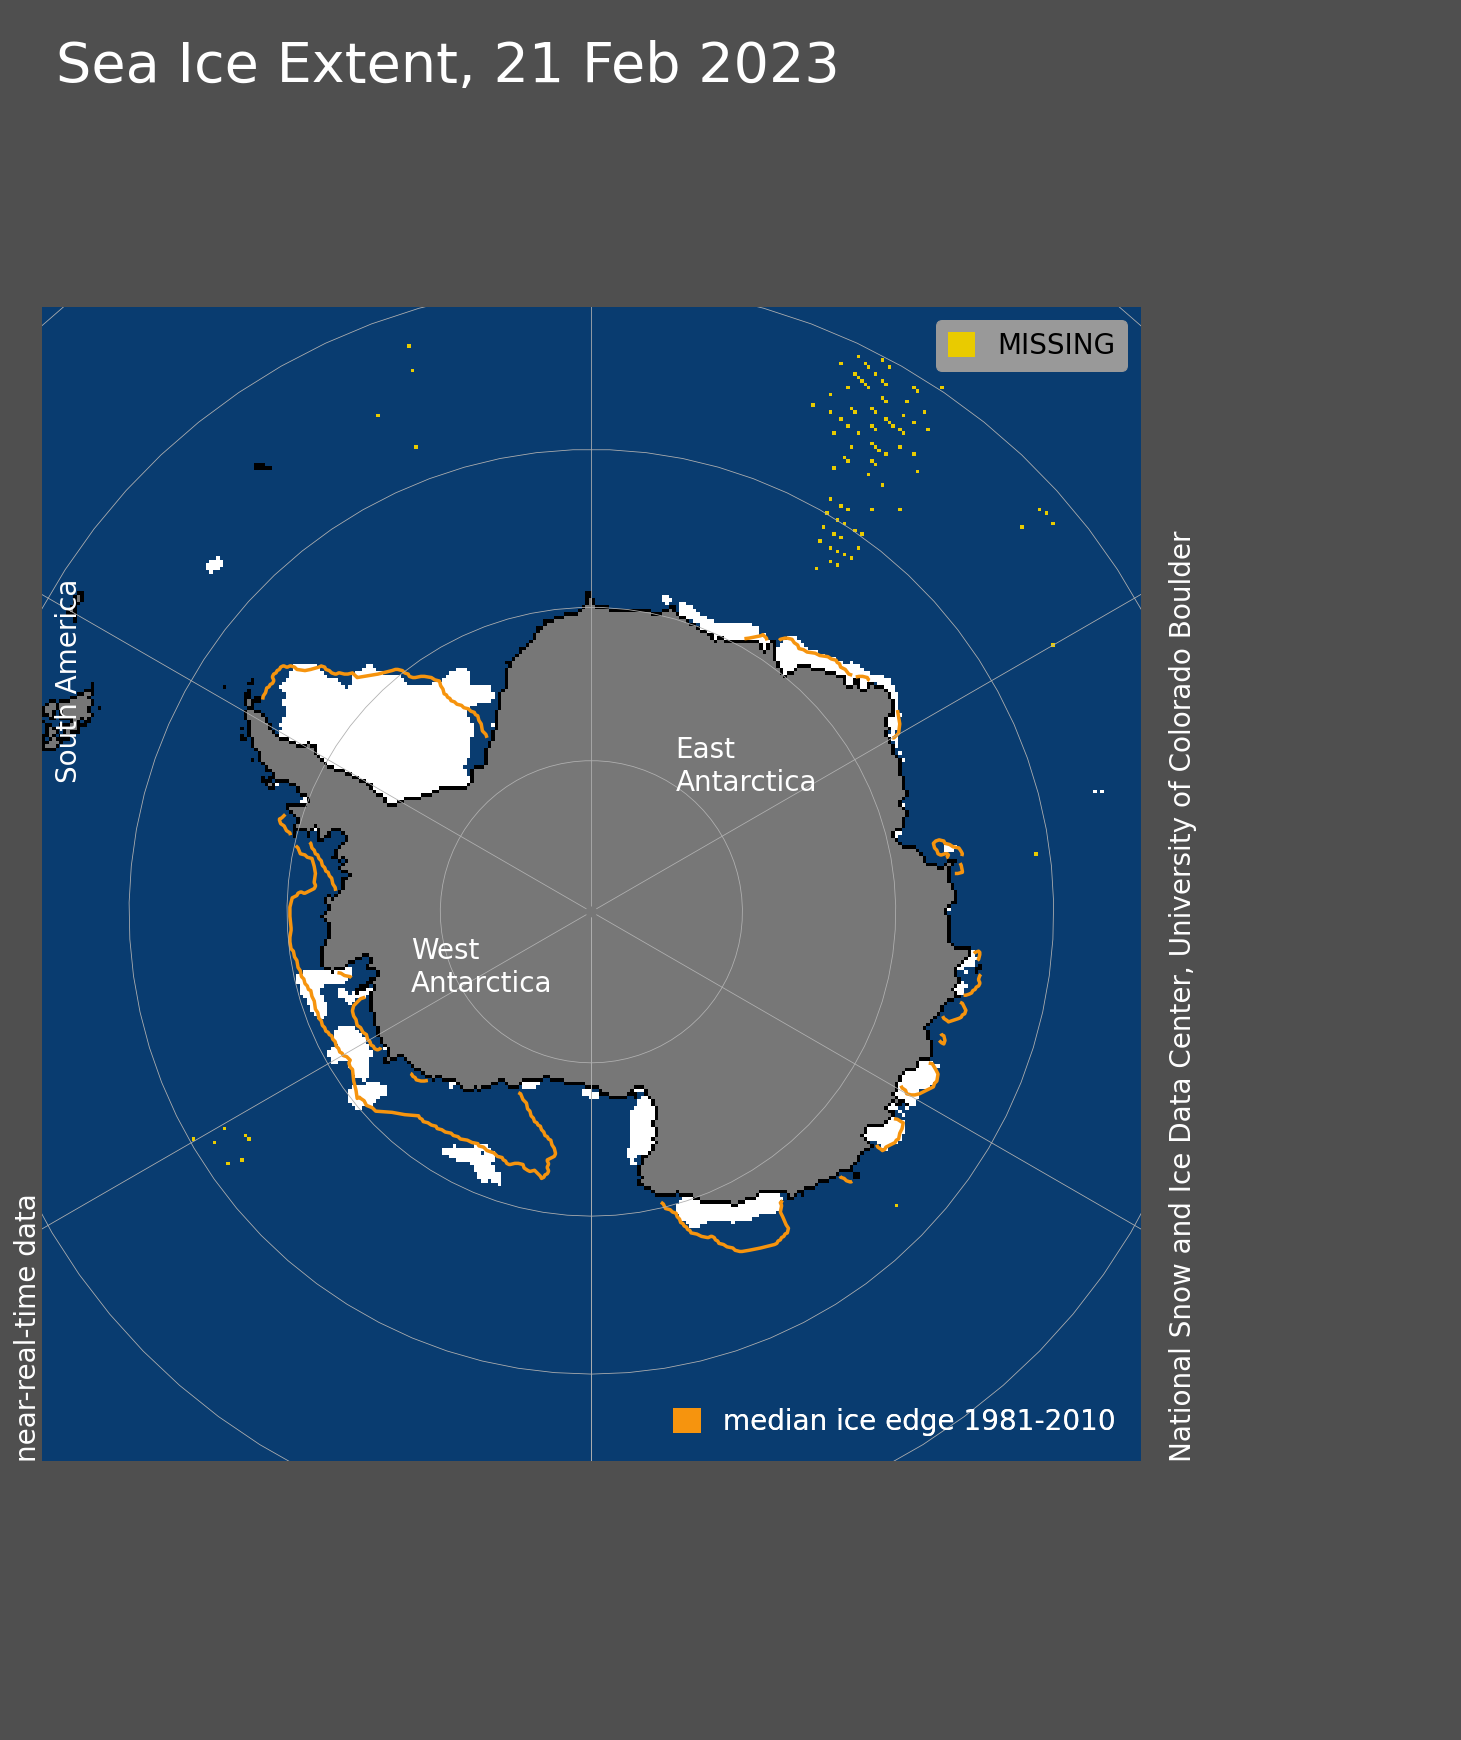
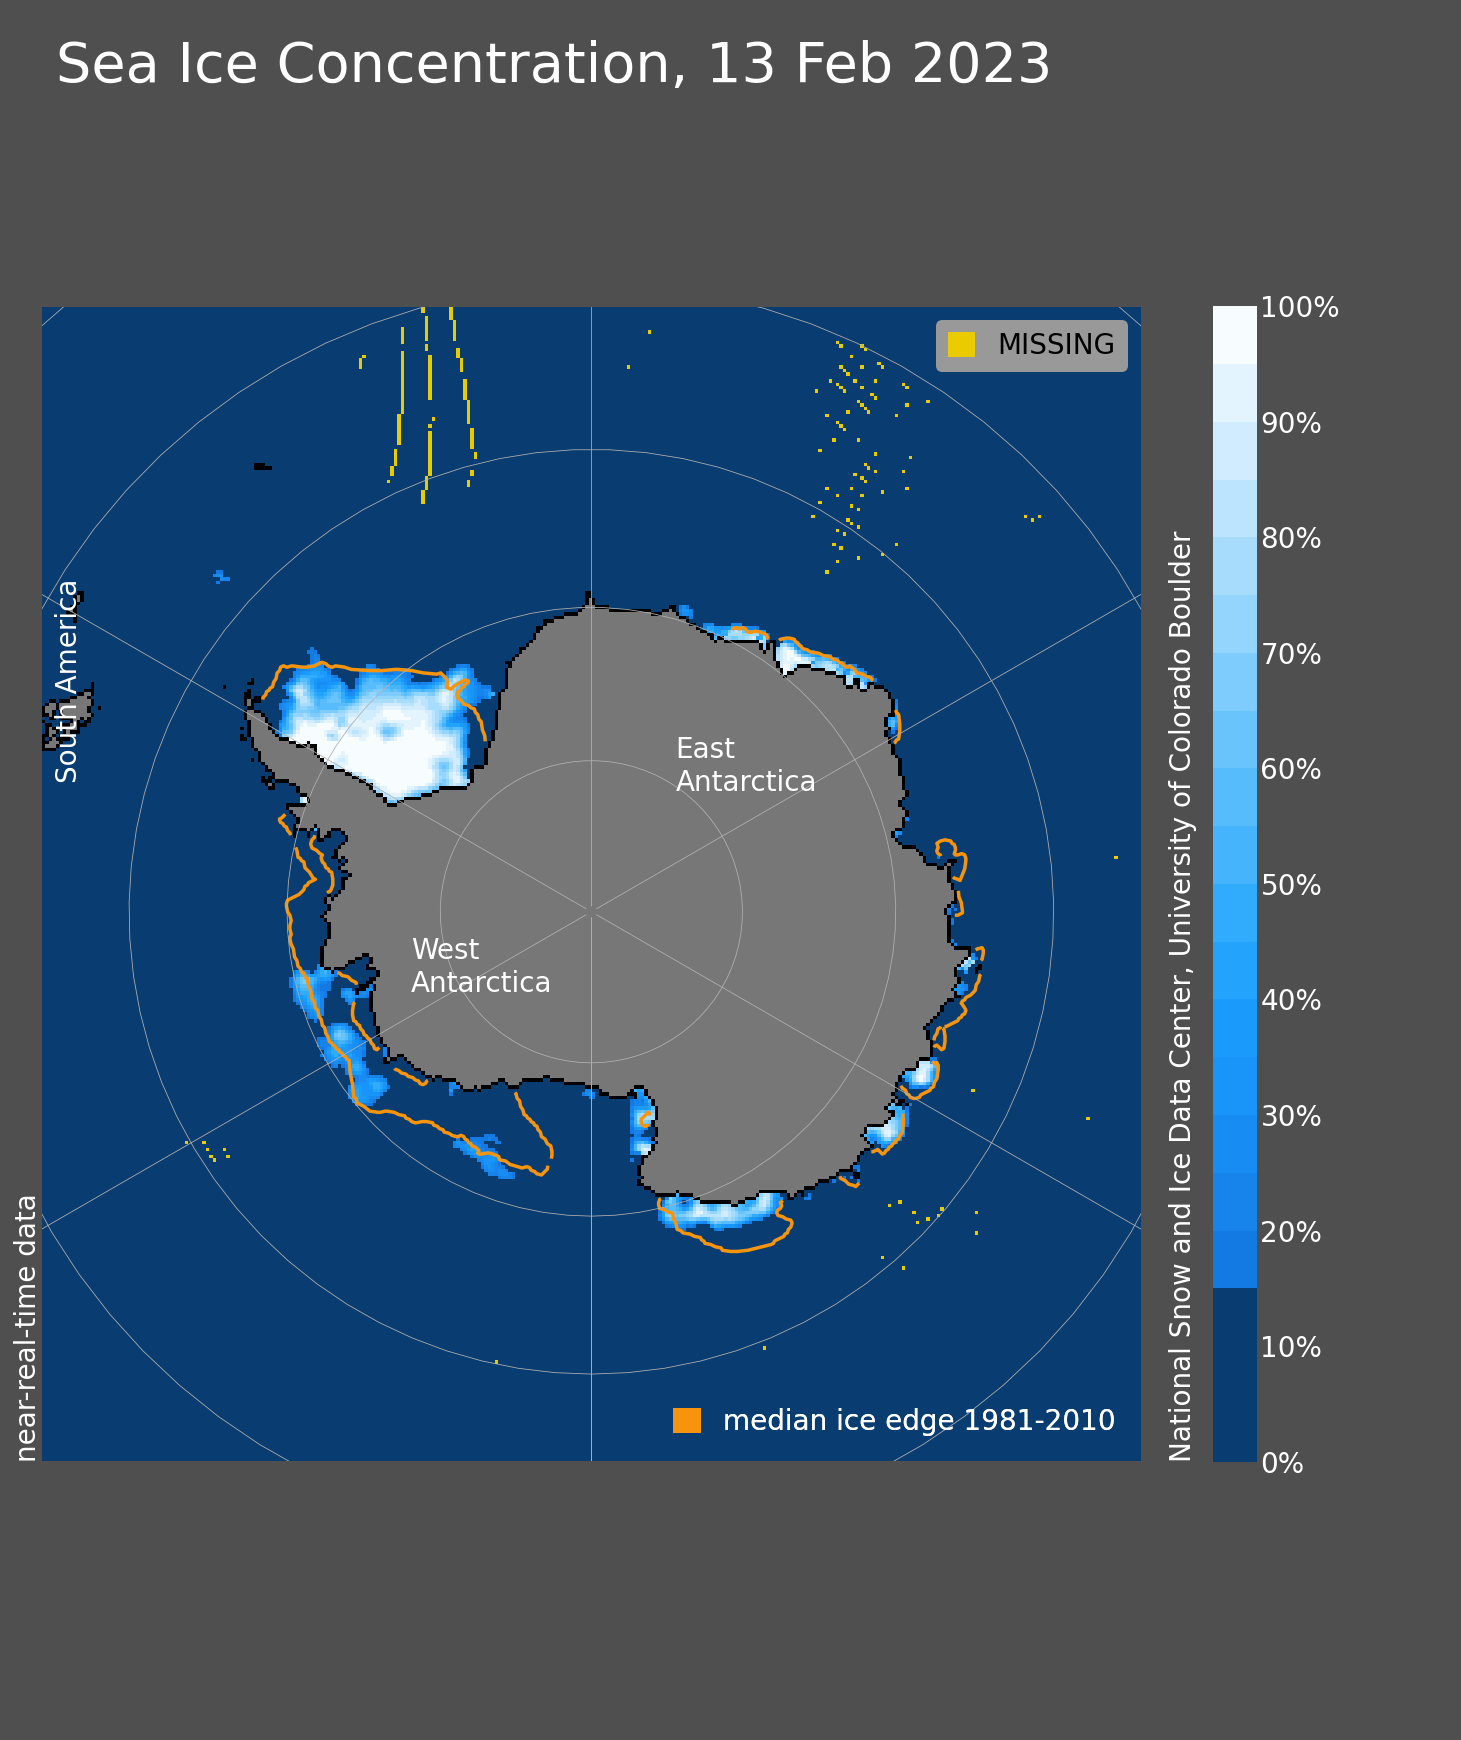
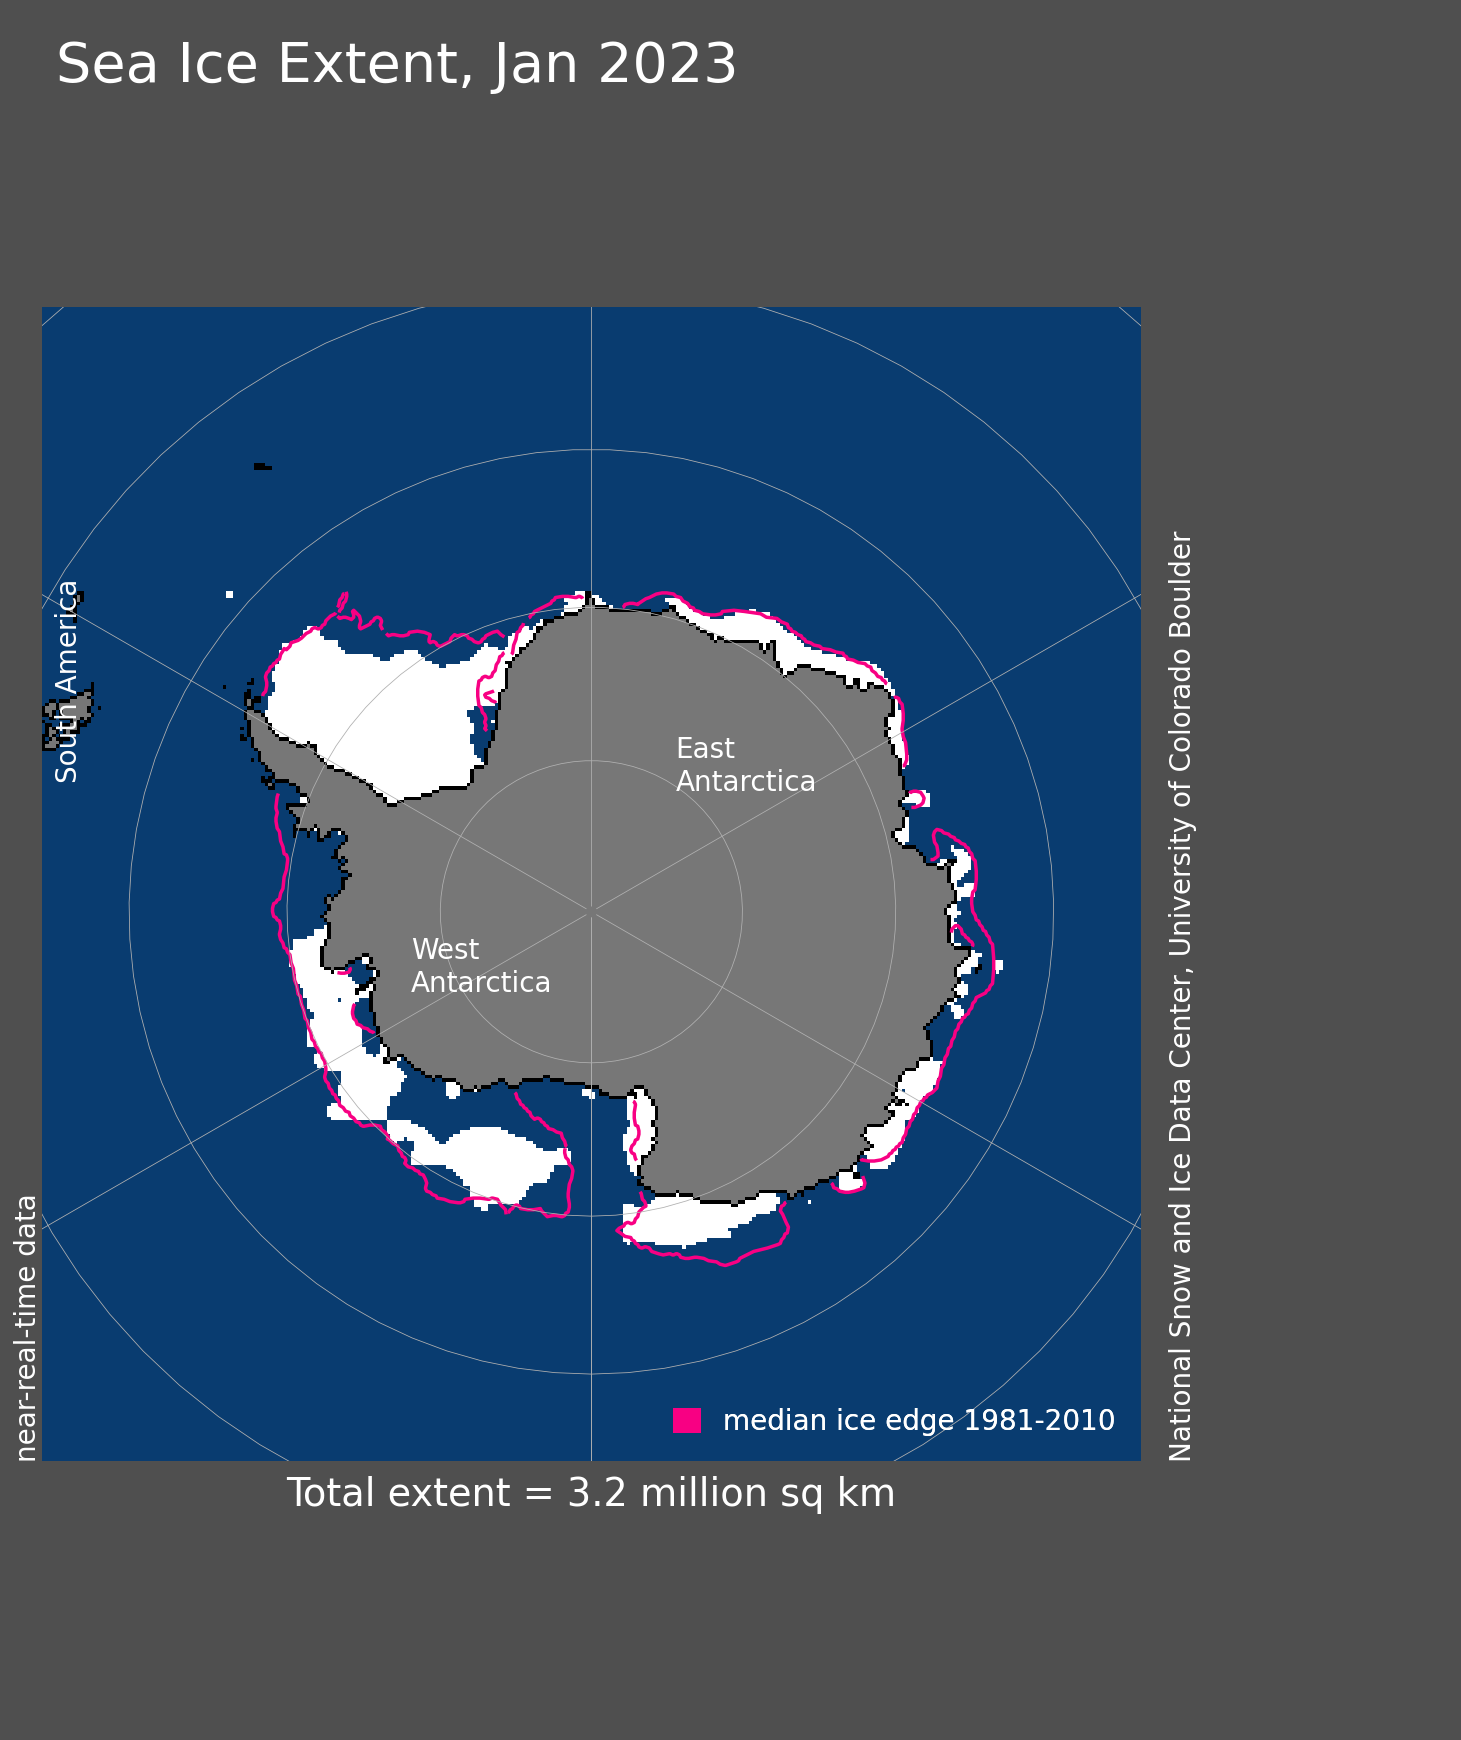
Figure 6a. Antarctic sea ice extent for June 2023 was 11.02 million square kilometers (4.25 million square miles). The magenta line shows the 1981 to 2010 average extent for that month. Sea Ice Index data. About the data
Credit: National Snow and Ice Data Center
High-resolution image
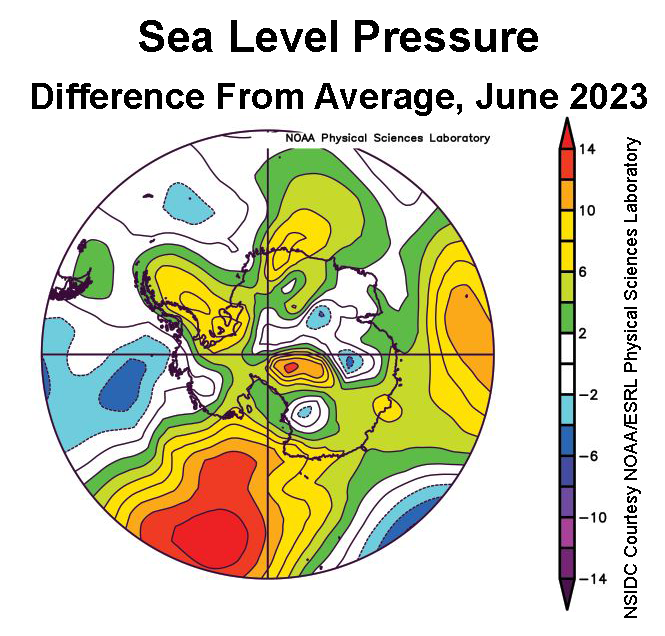
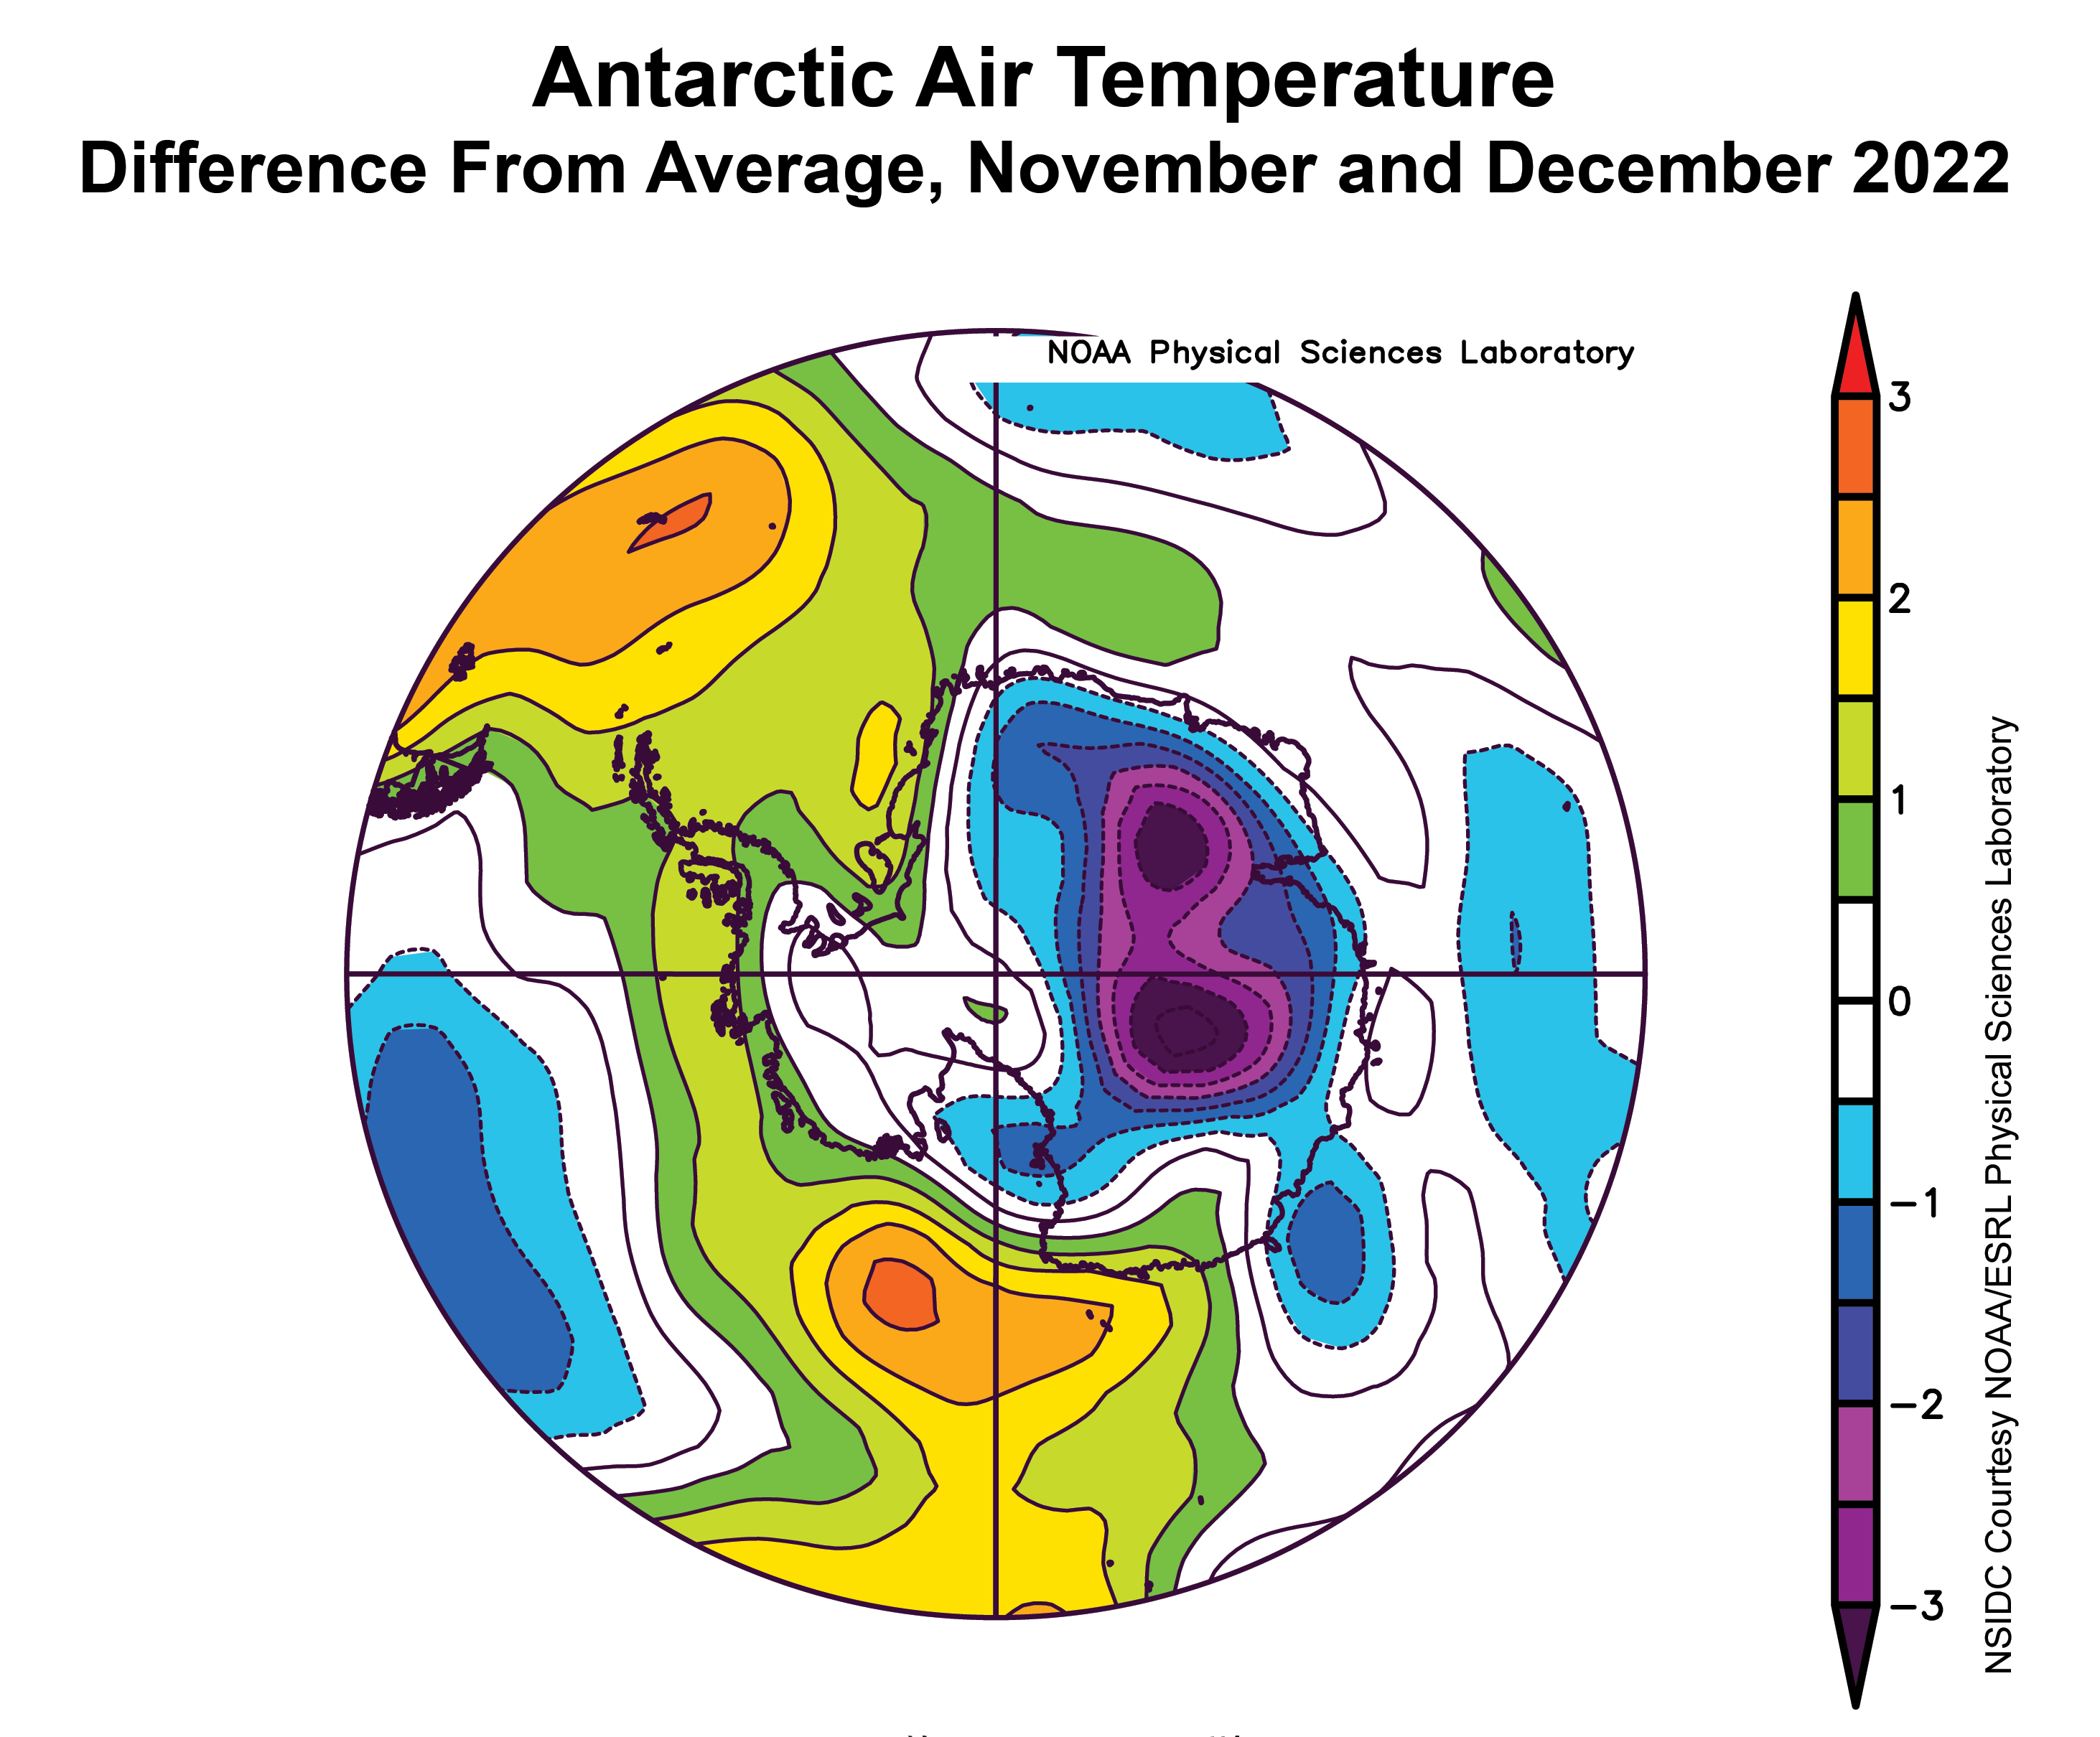
Figure 6b. This plot shows the departure from average sea level pressure in the Antarctic in millibars for June 1, 2023 to June 30, 2023. Yellows and reds indicate high air pressure; blues and purples indicate low pressure.
Credit: NSIDC courtesy NOAA Earth System Research Laboratory Physical Sciences Laboratory
High-resolution image
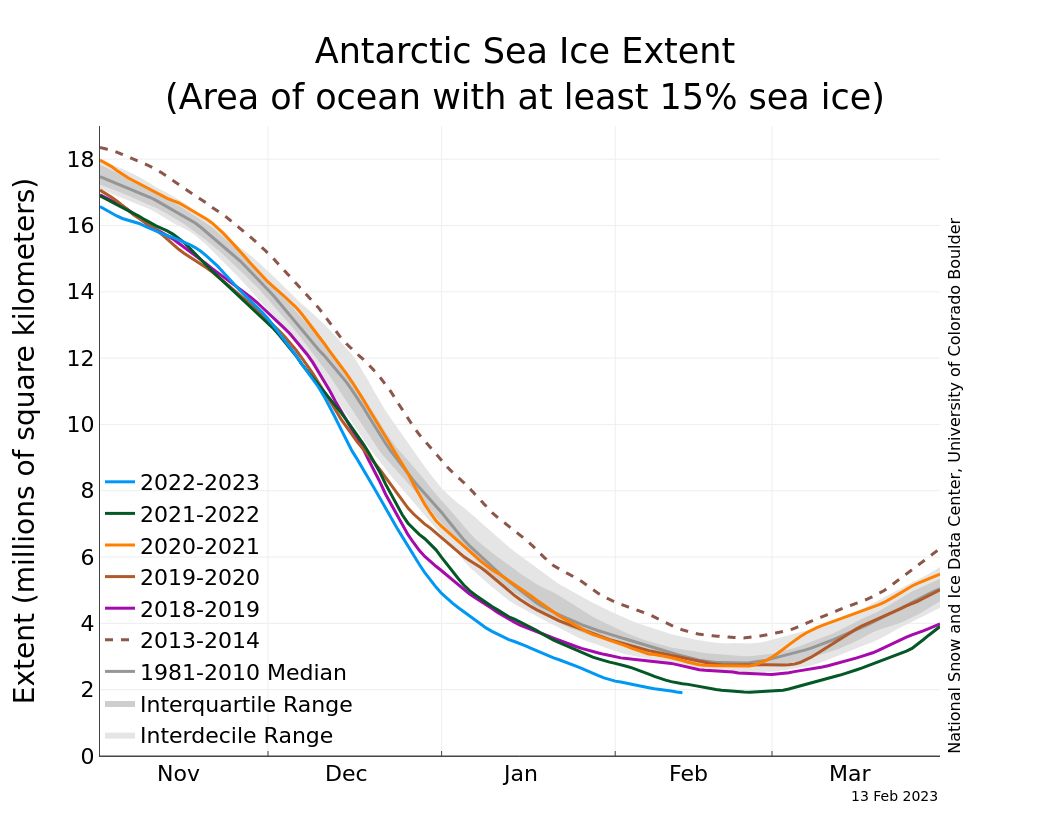
The total ice extent in the Antarctic is continuing to track at extreme record low levels, with departures from the long-term average of more than four standard deviations. Sea ice extent is below average everywhere except in the northern Amundsen Sea where it is more extensive than average (Figure 6a). In the Indian Ocean sector, ice extent is near average to slightly below.
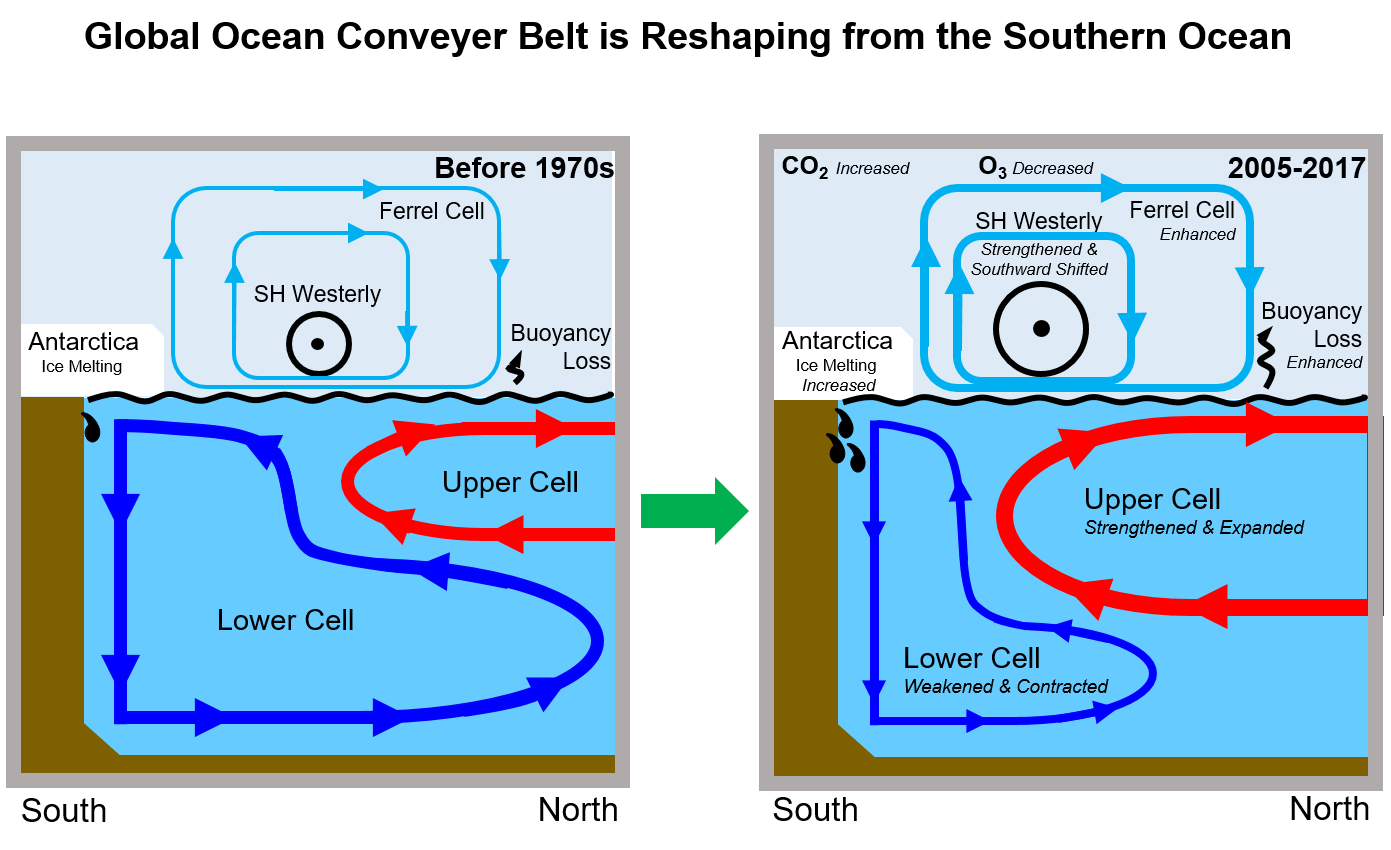
The dramatically slower pace of ice growth through the 2023 autumn and early winter is a topic of intense research. Among the most likely causes are warmer ocean conditions in the polar water layer. This layer of colder, slightly less saline seawater is usually at or very near the freezing point. A small temperature increase, from mixing upward from deeper ocean layers or from warmer ocean surface water to the north, could slow the formation of new sea ice during autumn and winter. Under typical conditions, the polar water, a layer of several tens of meters thickness in the sea ice regions of both poles, is both slightly fresher and less dense than the underlying ocean waters, which leads to strong stratification of the topmost waters. However, if warm ocean water from just north of the surface extent of the cold water has been mixed into the polar water, it reduces this density contrast, and this reduces the stratification and allows warmth to more easily mix upward from below, further increasing the heat in the upper ocean layer and prolonging the period of reduced ice growth.
A further contributing factor for the southern Bellingshausen Sea region is the persistently strong and eastward position of the Amundsen Sea Low. This is driving warm winds southward along the western Peninsula, and across the Peninsula (Figure 6b), in both cases suppressing ice growth, and moving ice in the northwestern Weddell eastward.
Trying to measure sea ice during a record low ice cover year of the Antarctic
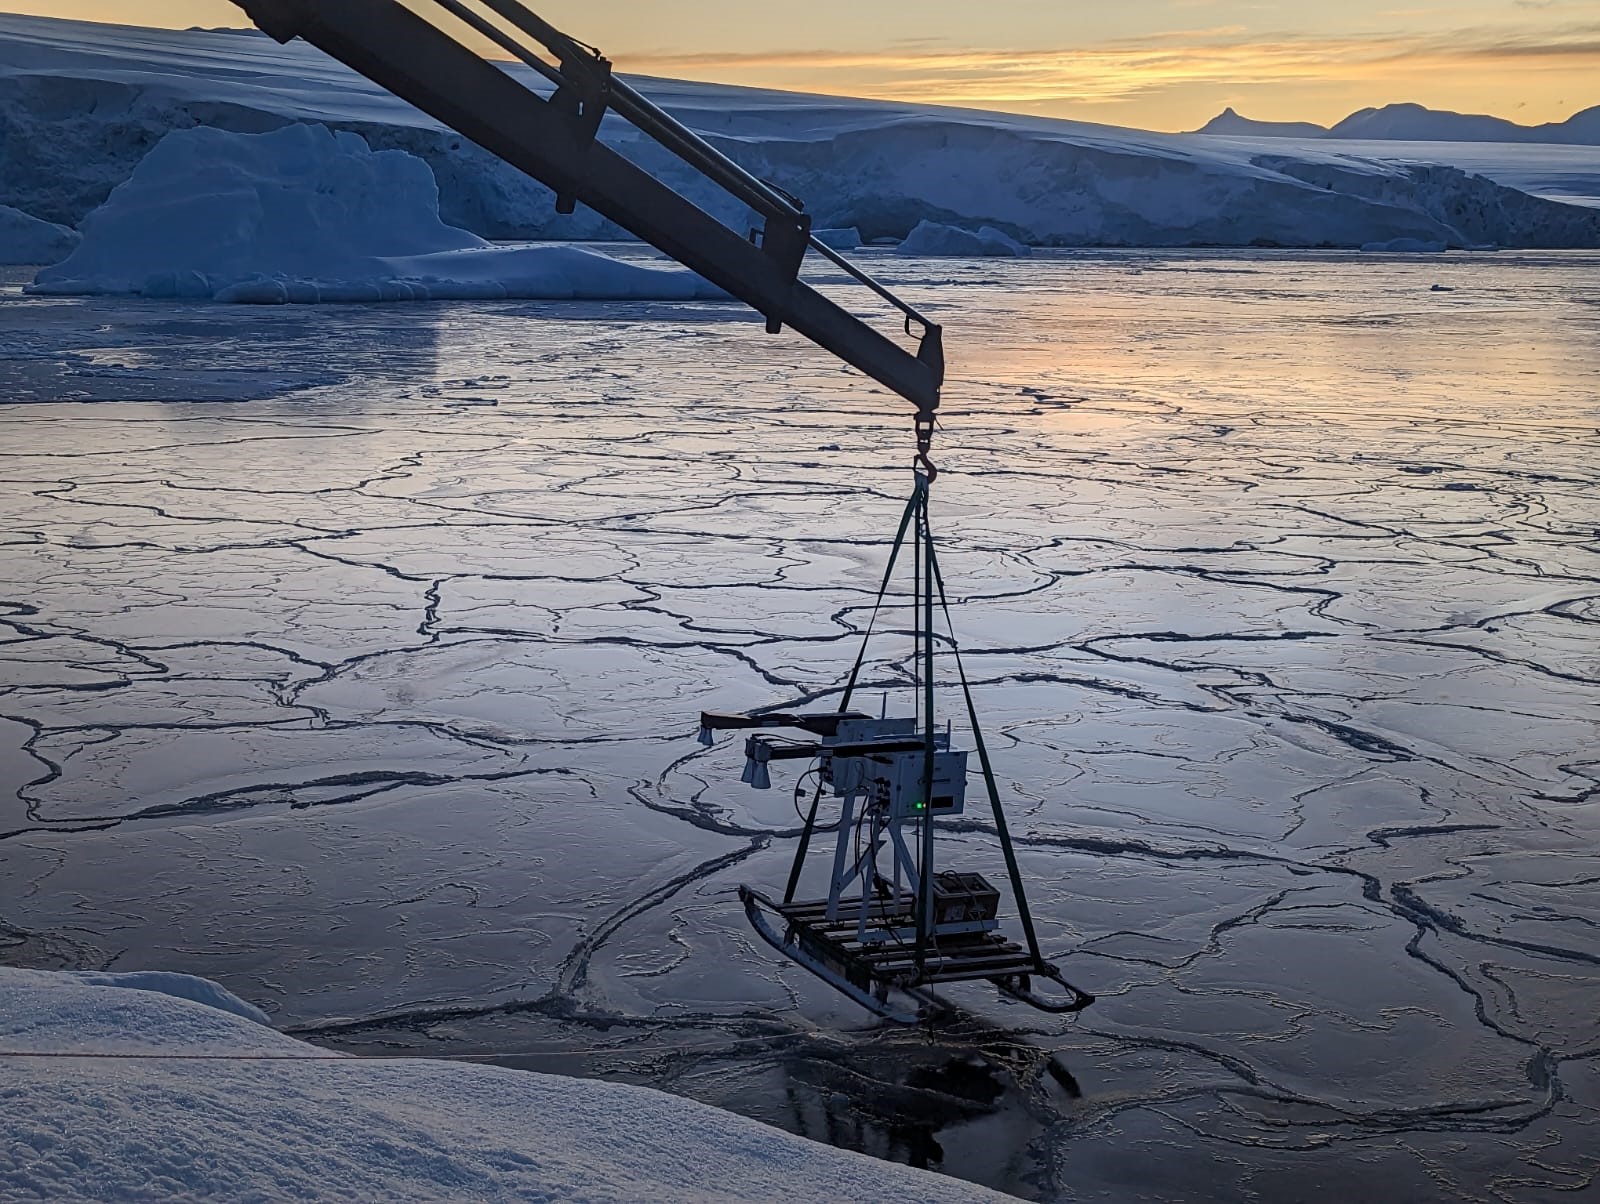
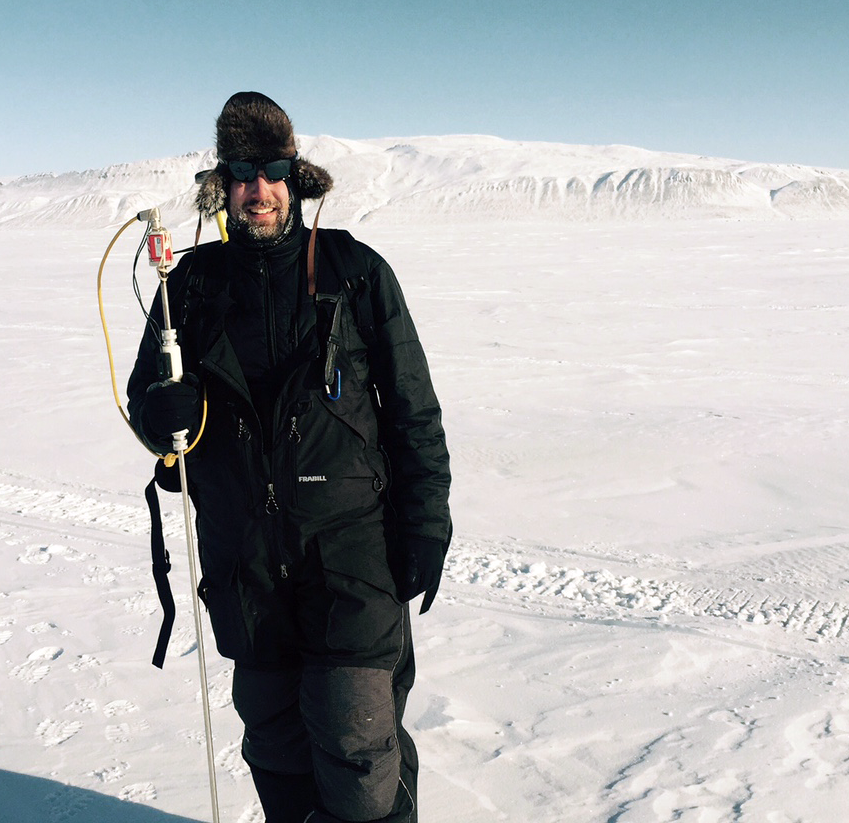
Figure 7. This photo shows the Ku- and Ka-band radar being deployed over newly forming sea ice off the coast of the Antarctic Peninsula near Rothera Station.
Credit: Vishnu Nandan, University of Manitoba
High-resolution image
The Antarctic Peninsula is the fastest warming region in the southern hemisphere, and this year its western coast is experiencing particularly low sea ice extent, contributing to the record low extent for the Antarctic as a whole. As part of a joint project between the University of Manitoba and a United Kingdom-led Drivers and Effects of Fluctuations in sea Ice in the ANTarctic (DEFIANT) project, Vishnu Nandan and Robbie Mallett from the University of Manitoba are spending the winter at the UK’s Rothera Base near the Peninsula where they are monitoring thin ice cover with a crane-mounted dual-frequency radar. This instrument mimics satellite-mounted radars such as CryoSat-2, Ka-band Altimeter (AltiKa), and the European Space Agency’s forthcoming Copernicus Polar Ice and Snow Topography Altimeter (CRISTAL) mission. It was previously deployed on the year-long Multidisciplinary drifting Observatory for the Study of Arctic Climate (MOSAiC) expedition in 2019 and 2020.
By scanning different ice types from a range of heights, the team’s previous surface-based observations are now being contextualized with regard to airborne and satellite platforms. Over the rest of the winter, Nandan and Mallett will perform sled-based transects of sea ice with the radar, investigating snow properties and their contribution to uncertainties in satellite-estimates of sea ice thickness. Snow remains one of the largest contributors in this respect, and results of DEFIANT’s field campaigns will provide valuable knowledge ahead of the European Space Agency CRISTAL’s anticipated launch in 2027.
Further reading
Duffey, A., P. Irvine, M. Tsamados, and J. Stroeve. 2023. Solar geoengineering in the polar regions: A review. Earth’s Future, 11, e2023EF003679. doi:10.1029/2023EF003679
Kim, Y. H., S. K. Min, N. P. Gillett, et al. 2023. Observationally-constrained projections of an ice-free Arctic even under a low emission scenario. Nature Communications. doi:10.1038/s41467-023-38511-8
Tschudi, M., W. N. Meier, and J. S. Stewart. 2019. Quicklook Arctic Weekly EASE-Grid Sea Ice Age, Version 1 [Data Set]. Boulder, Colorado USA. NASA National Snow and Ice Data Center Distributed Active Archive Center, doi:10.5067/2XXGZY3DUGNQ
Topál, D., and Q. Ding. 2023. Atmospheric circulation-constrained model sensitivity recalibrates Arctic climate projections. Nature Climate Change. doi:10.1038/s41558-023-01698-1


