The seasonal decline in Arctic sea ice extent was moderate through much of May before picking up pace over the last few days of the month. Meanwhile, Antarctic sea ice extent remained far below previous satellite-era record lows for this time of year.
Overview of conditions
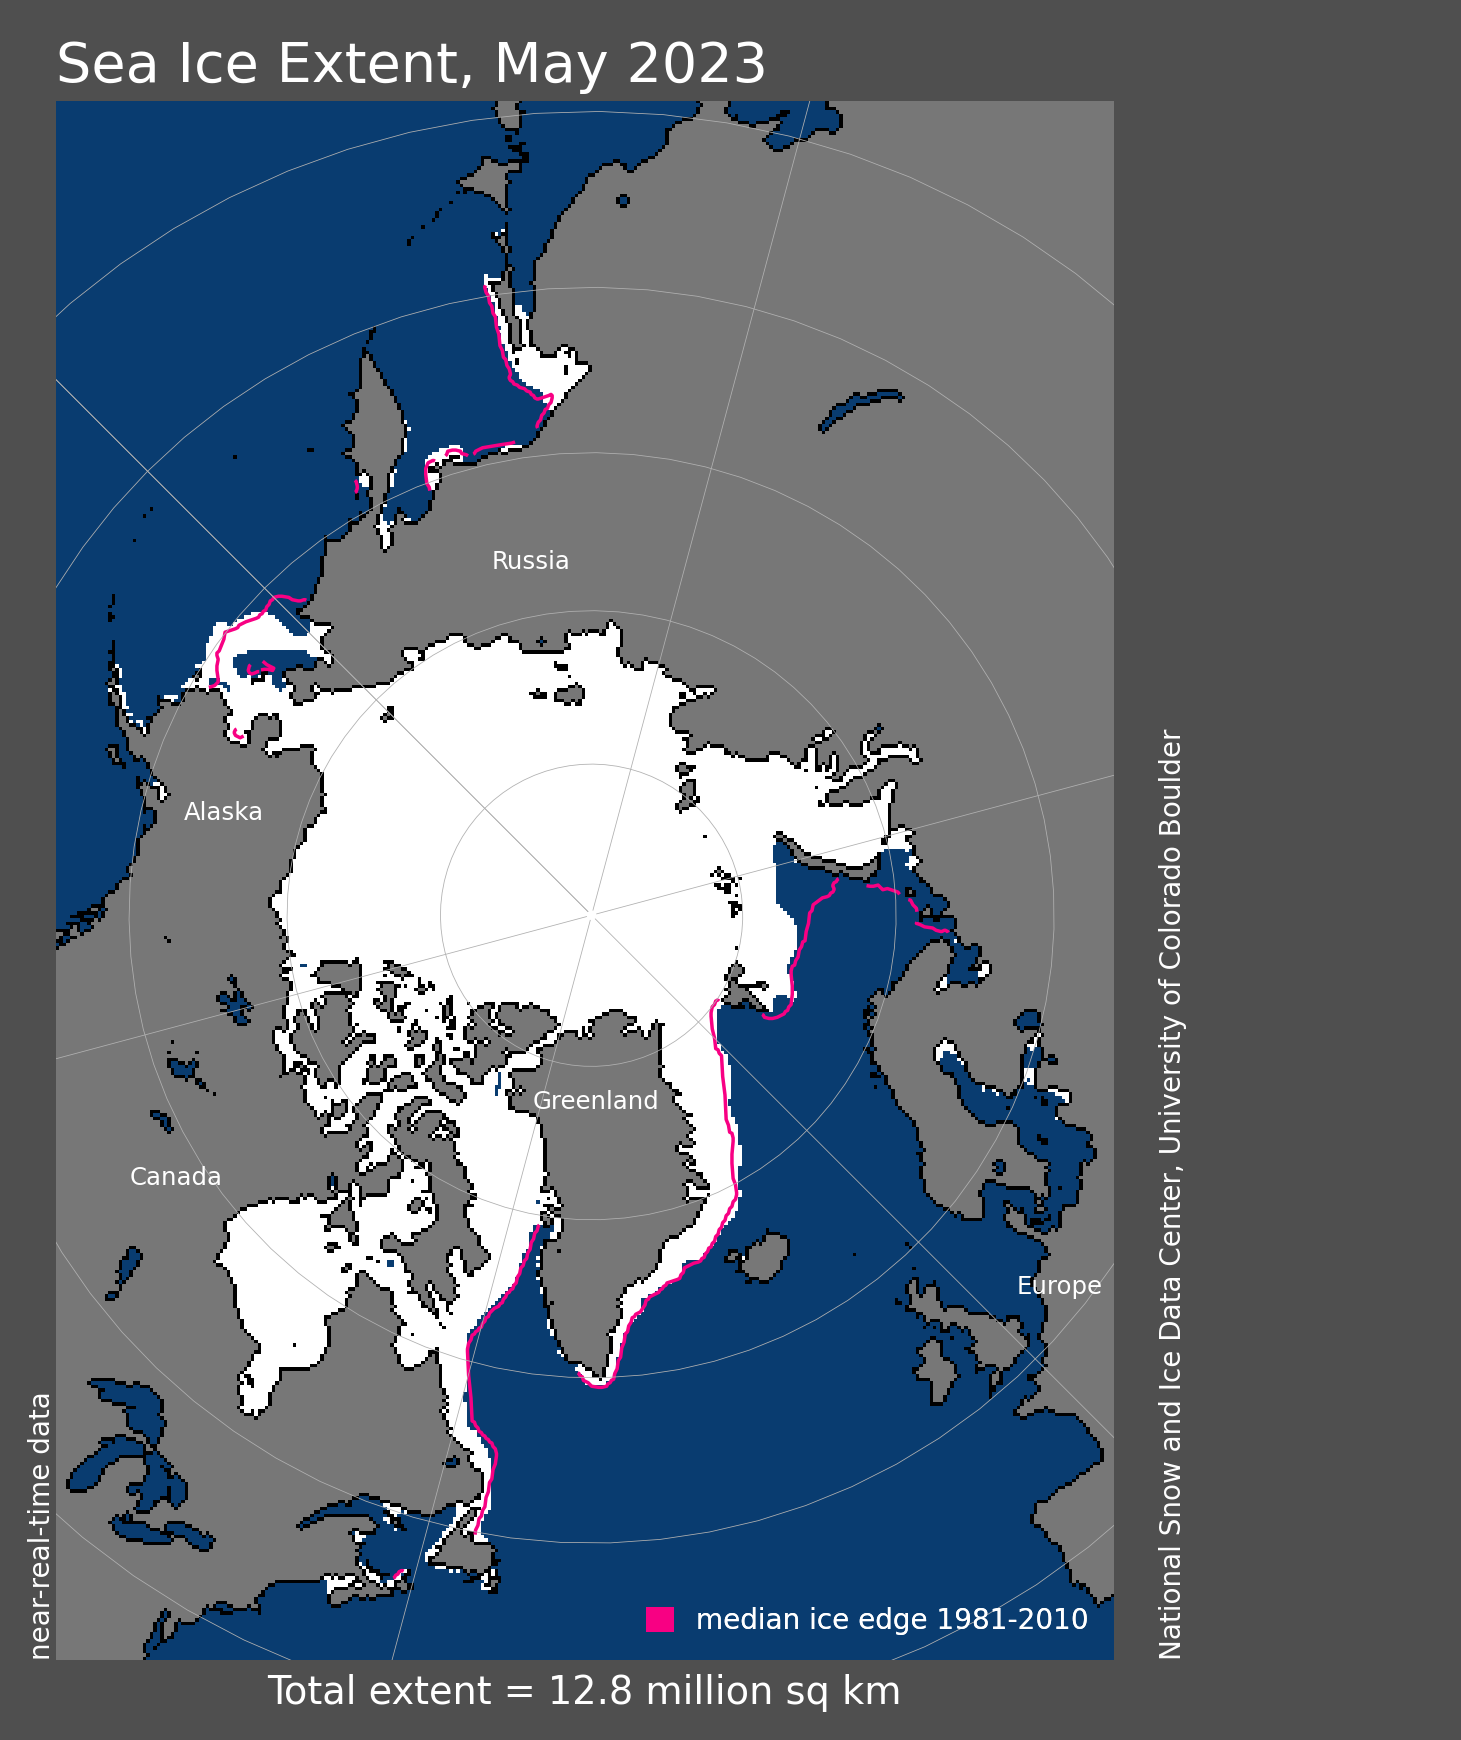
Figure 1a. Arctic sea ice extent for May 2023 was 12.83 million square kilometers (4.95 million square miles). The magenta line shows the 1981 to 2010 average extent for that month. Sea Ice Index data. About the data
Credit: National Snow and Ice Data Center
High-resolution image
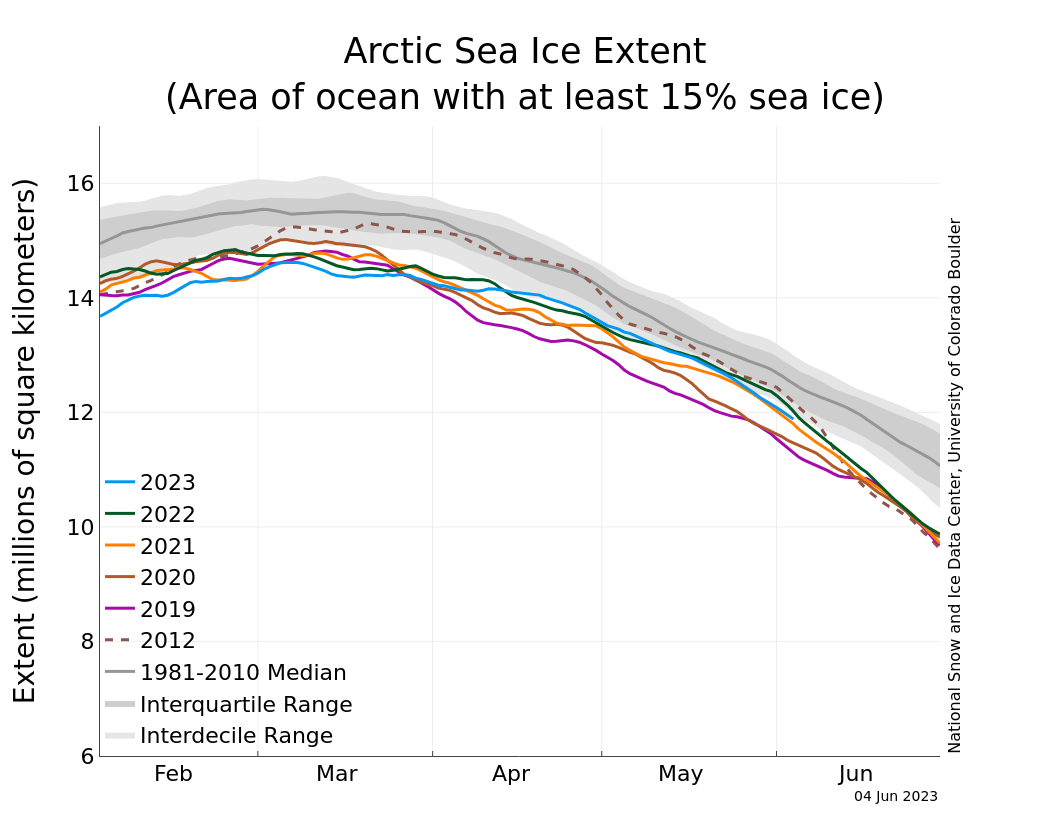
Figure 1b. The graph above shows Arctic sea ice extent as of June 4, 2023, along with daily ice extent data for four previous years and the record low year. 2023 is shown in blue, 2022 in green, 2021 in orange, 2020 in brown, 2019 in magenta, and 2012 in dashed brown. The 1981 to 2010 median is in dark gray. The gray areas around the median line show the interquartile and interdecile ranges of the data. Sea Ice Index data.
Credit: National Snow and Ice Data Center
High-resolution image
Average Arctic sea ice extent during May 2023 was 12.83 million square kilometers (4.95 million square miles) (Figure 1a), the thirteenth lowest May in the satellite record. The average extent was 460,000 square kilometers (178,000 square miles) below the 1981 to 2010 average and 910,000 square kilometers (351,000 square miles) above the record low May extent, which occurred in 2016.
Through much of May, extent declined slightly slower than the 1981 to 2010 average (Figure 1b). From May 1 to May 24, extent dropped 963,000 square kilometers (372,000 square miles), compared to 1.12 million square kilometers (432,000 square miles) over the same interval in the 1981 to 2010 average. However, during the last week of the month, the rate of ice loss increased. Overall, the Arctic lost 452,000 square kilometers (175,000 square miles) of ice from May 24 to May 31, compared the 1981 to 2010 average of 279,000 square kilometers (108,000 square miles) during the same interval. The late increase in extent loss dropped the extent below the interdecile range after spending most of the month just above the lower part of the interdecile range.
Conditions in context

Figure 2a. This plot shows the departure from average air temperature in the Arctic at the 925 hPa level, in degrees Celsius, for May 2023. Yellows and reds indicate higher than average temperatures; blues and purples indicate lower than average temperatures.
Credit: NSIDC courtesy NOAA Earth System Research Laboratory Physical Sciences Laboratory
High-resolution image

Figure 2b. This plot shows average sea level pressure in the Arctic in millibars for May 2023. Yellows and reds indicate high air pressure; blues and purples indicate low pressure.
Credit: NSIDC courtesy NOAA Earth System Research Laboratory Physical Sciences Laboratory
High-resolution image
Air temperatures at the 925 millibar level (approximately 2,500 feet above the surface) were 1 to 4 degrees Celsius (2 to 7 degrees Fahrenheit) below average over much of the Arctic Ocean for the month as a whole, except the Barents, Kara, and Beaufort Seas, where temperatures were 2 to 6 degrees Celsius (4 to 11 degrees Fahrenheit) above average (Figure 2a). Hudson Bay was also warmer than average, especially in the northwest part of the bay where temperatures were up to 8 degrees Celsius (14 degrees Fahrenheit) above average. Most of the Arctic Ocean in May was dominated by below average sea level pressure, as much as 10 millibars below average north of the Laptev Sea (Figure 2b). This type of pattern is known to be generally associated with below average air temperatures over the Arctic Ocean. By contrast, the unusually warm conditions over Hudson Bay can be linked to high sea level pressure (an anticyclonic circulation).
May 2023 compared to previous years
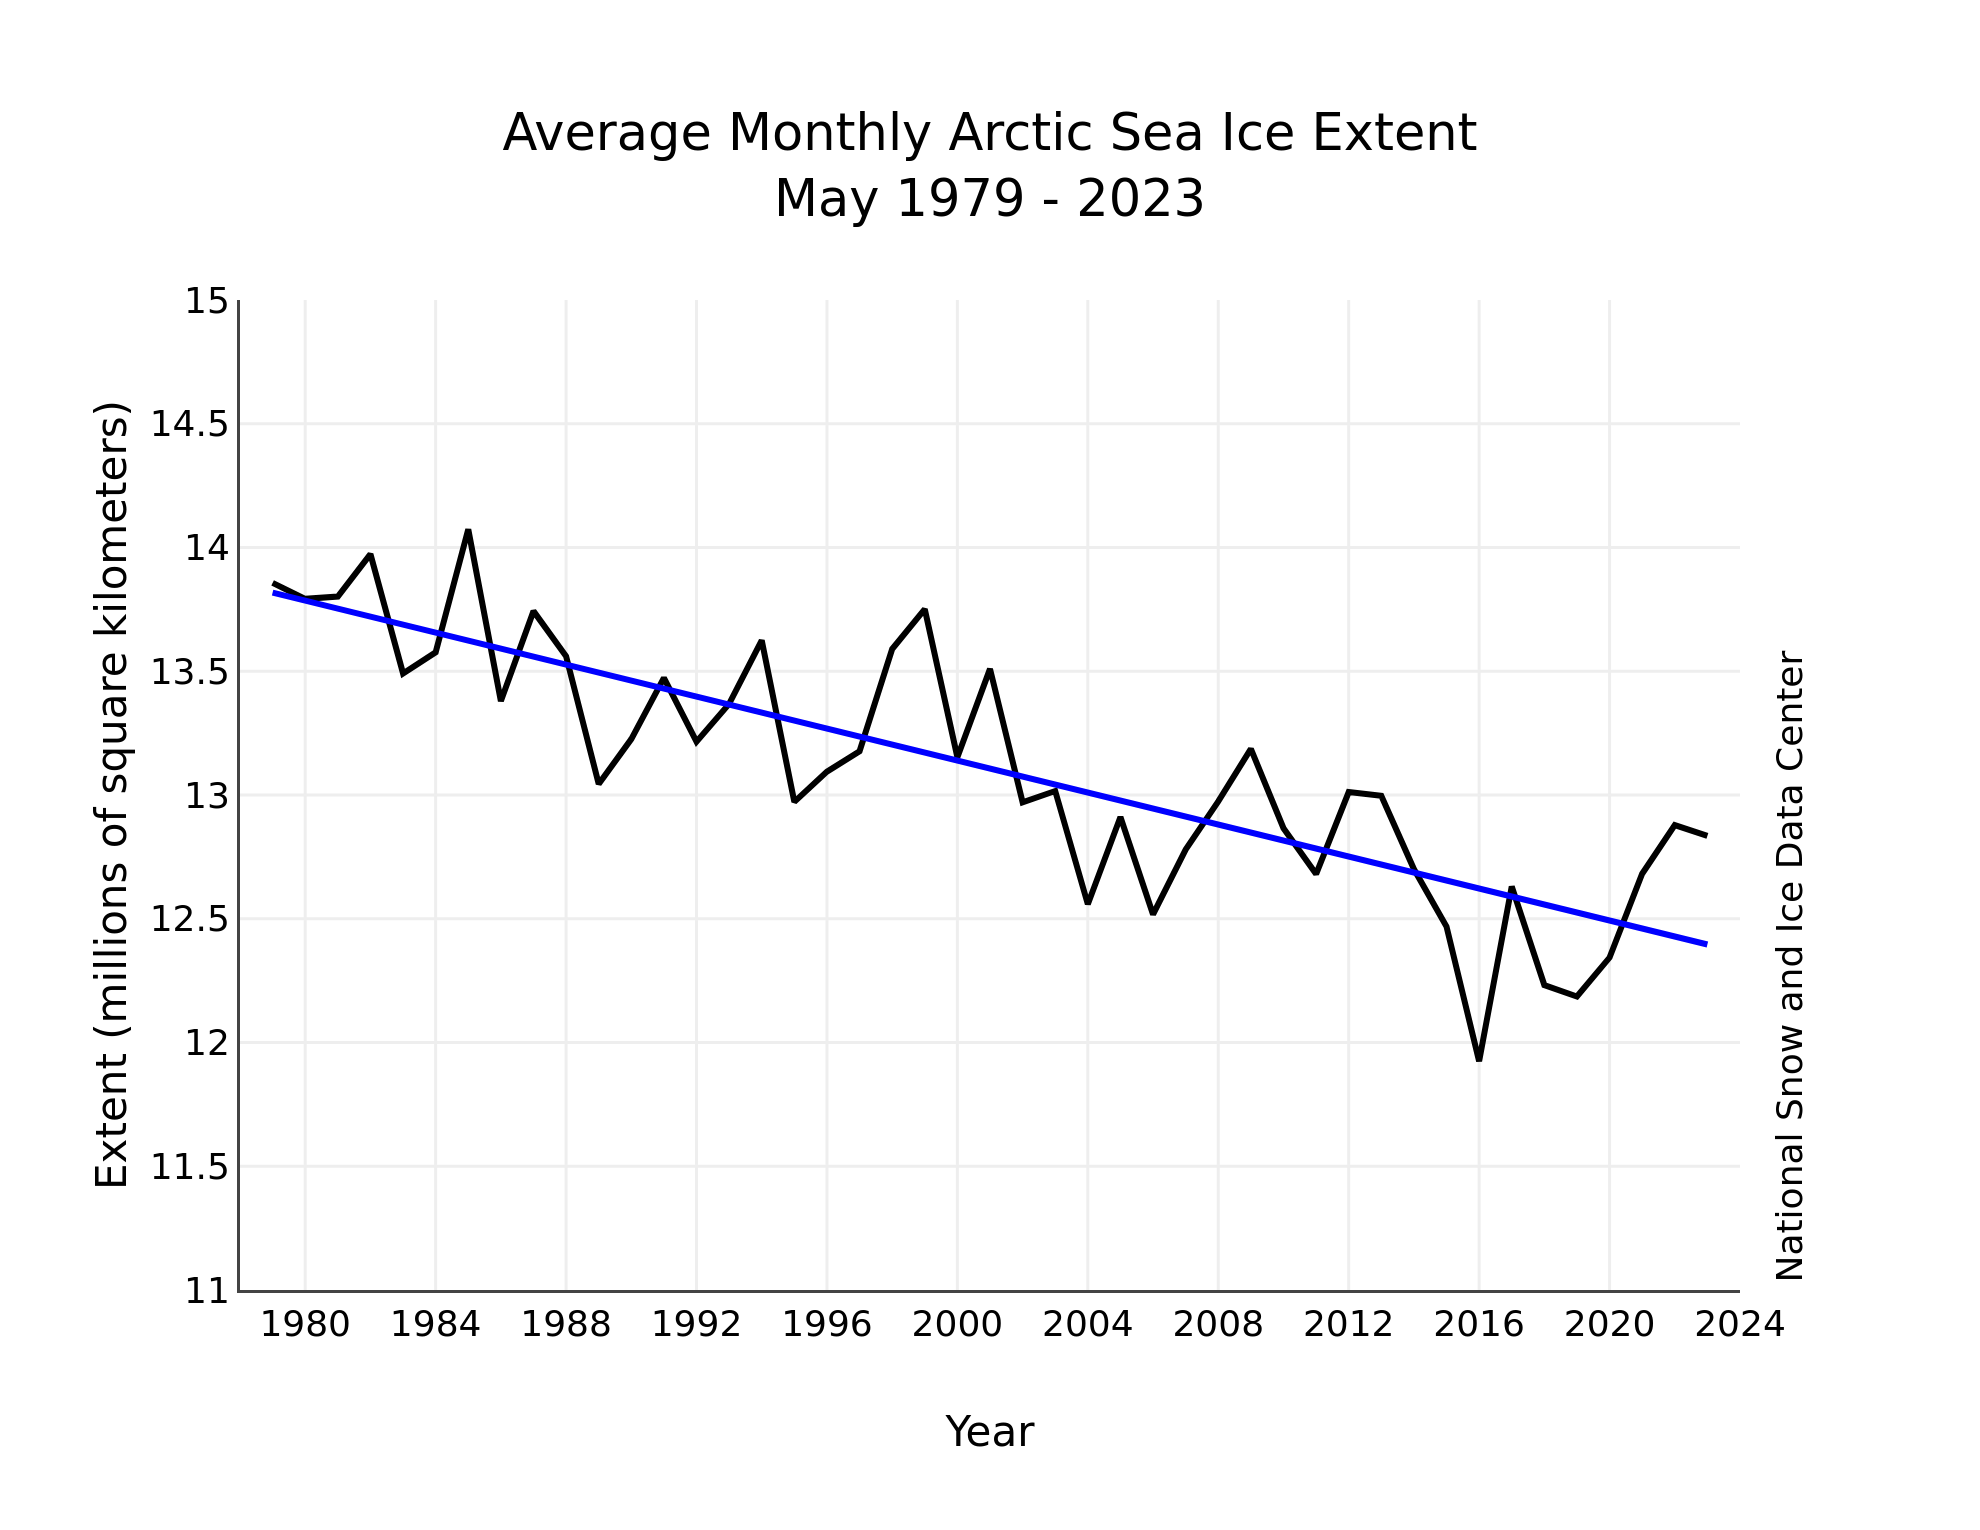
Figure 3. Monthly May sea ice extent for 1979 to 2023 shows a decline of 2.4 percent per decade.
Credit: National Snow and Ice Data Center
High-resolution image
The downward linear trend in Arctic sea ice extent in May over the 45-year satellite record is 32,300 square kilometers (12,500 square miles) per year, or 2.4 percent per decade relative to the 1981 to 2010 average (Figure 3). Based on the linear trend, since 1979, May has lost 1.42 million square kilometers (548,000 square miles) of ice. This is roughly equivalent to four times the size of Germany.
Antarctic extent remains low
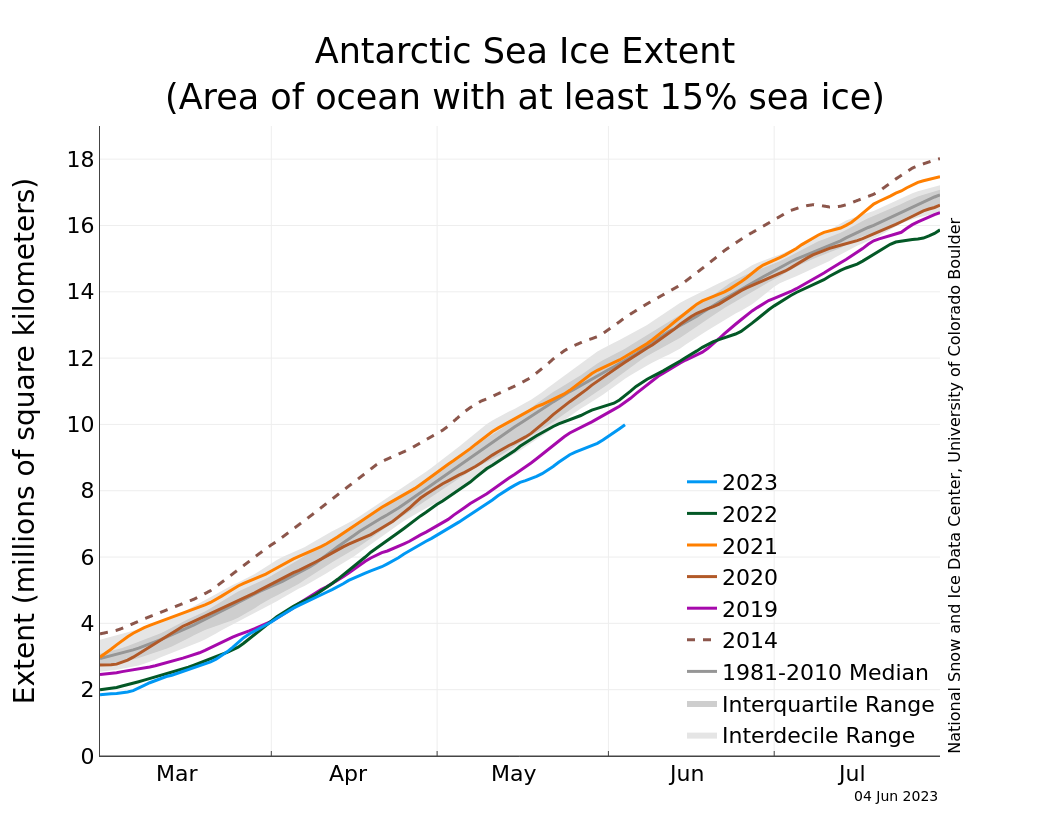
Figure 4a. The graph above shows Antarctic sea ice extent as of June 4, 2023, along with daily ice extent data for four previous years and the record high year. 2023 is shown in blue, 2022 in green, 2021 in orange, 2020 in brown, 2019 in magenta, and 2014 in dashed brown. The 1981 to 2010 median is in dark gray. The gray areas around the median line show the interquartile and interdecile ranges of the data. Sea Ice Index data.
Credit: National Snow and Ice Data Center
High-resolution image
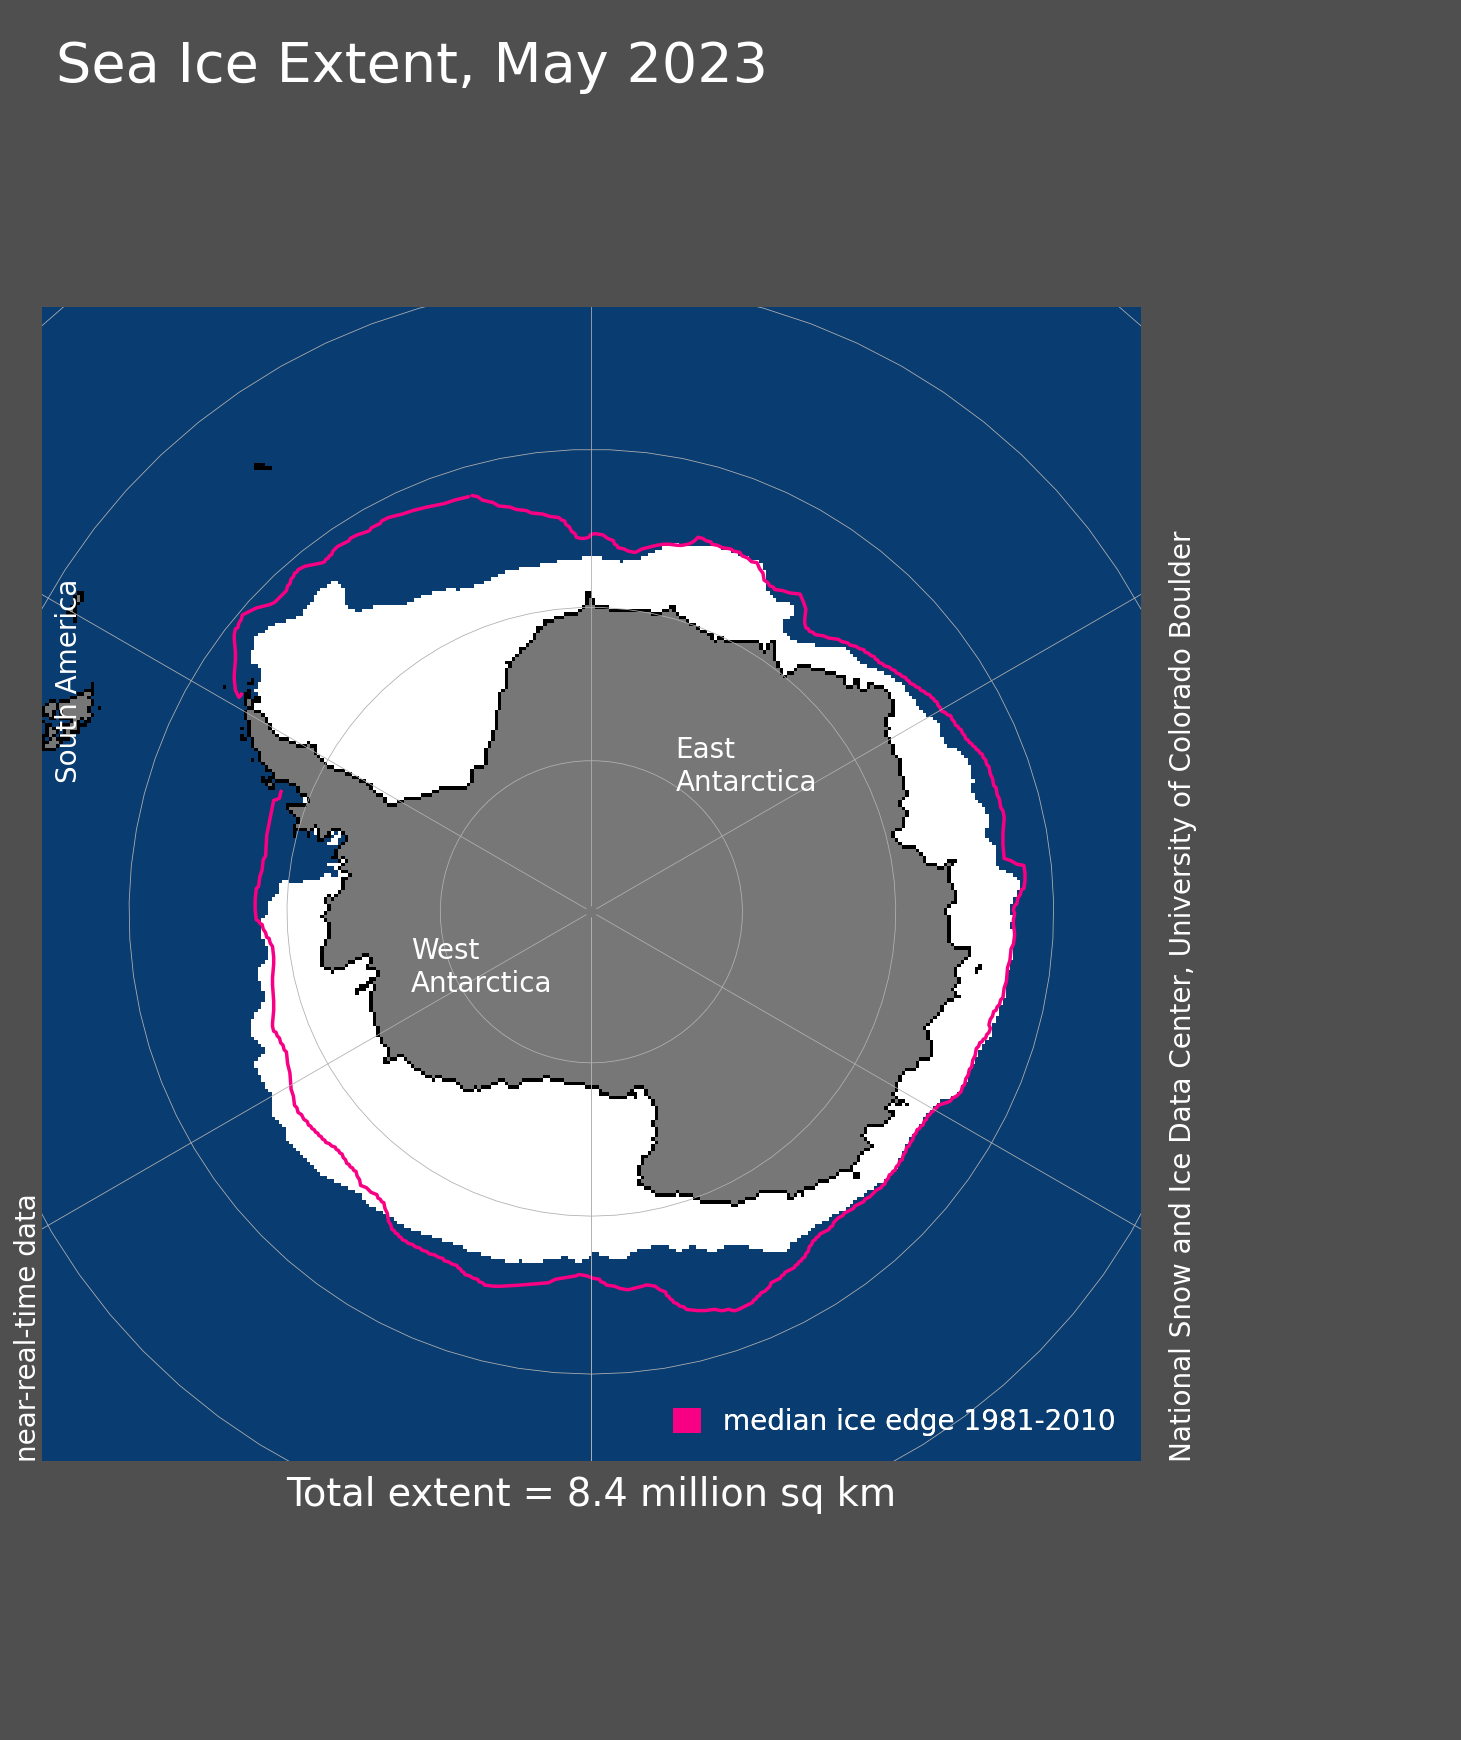
Figure 4b. Antarctic sea ice extent for May 2023 was 8.36 million square kilometers (3.23 million square miles). The magenta line shows the 1981 to 2010 average extent for that month. Sea Ice Index data. About the data
Credit: National Snow and Ice Data Center
High-resolution image
Down south, Antarctic sea ice extent is at record low levels as assessed over the satellite record since 1978. The Antarctic winter is approaching, so May and June are months of large increases in extent, but this year, extent is far lower than average for May (Figure 4a). Sea ice extent was particularly low in the Bellingshausen Sea, Weddell Sea, and western Ross Sea regions; only the central Amundsen and Eastern Ross Seas were above the typical late May ice extent (Figure 4b).
In an average (1981 to 2010) May, Antarctic extent increases by 3.25 million square kilometers (1.25 million square miles). This May, the increase was only 2.87 million square kilometers (1.11 million square miles). As of May 31, sea ice extent is approximately 700,000 square kilometers (270,000 square miles) below the previous daily record lows, which occurred in in 1980, 2017, and 2019. (Please note that 1986 values are affected by a no-data period from the satellites we use).
The May 2023 sea ice extent continues the very low ice extent conditions seen throughout most of 2022, and generally low ice extents since 2016. For May 2023, weather conditions have been marked by above average air temperatures at the 925-millibar level of up to 4 degrees Celsius (7 degrees Fahrenheit) over the Weddell Sea extending over the Peninsula, and additionally a region north of Wilkes Land. Cool conditions prevailed over the Amundsen Sea, around 4 degrees Celsius below average (7 degrees Fahrenheit). Air pressure patterns for May indicate an especially strong Amundsen Sea Low (12 millibars below the 1991 to 2020 average), shifted somewhat eastward of its typical location. For 2023 to date, the conditions are much the same over the five months so far, with air temperatures up to 2 degrees Celsius above average (4 degrees Fahrenheit) over the Weddell Sea and the Peninsula, and a 9-millibar below-average Amundsen Sea Low centered in the far southeastern Bellingshausen Sea, well to the east of its typical location.
Sea Ice Outlook begins another year
Over the past 15 years, the Sea Ice Outlook has been a community effort to improve prediction of Arctic September sea ice extent. The Outlook submissions are due June 12. The Outlook is managed by the Arctic Consortium of the United States (ARCUS) and is currently funded by the National Science Foundation.

