The sun is about to set for the winter at the North Pole, and so the 2022 sea ice melt season is coming to an end. As of September 19, 2022, Arctic sea ice extent stood at 4.68 million square kilometers (1.81 million square miles), placing it ninth lowest in the satellite record for the date. The high-latitude polynyas have frozen over.
Overview of conditions
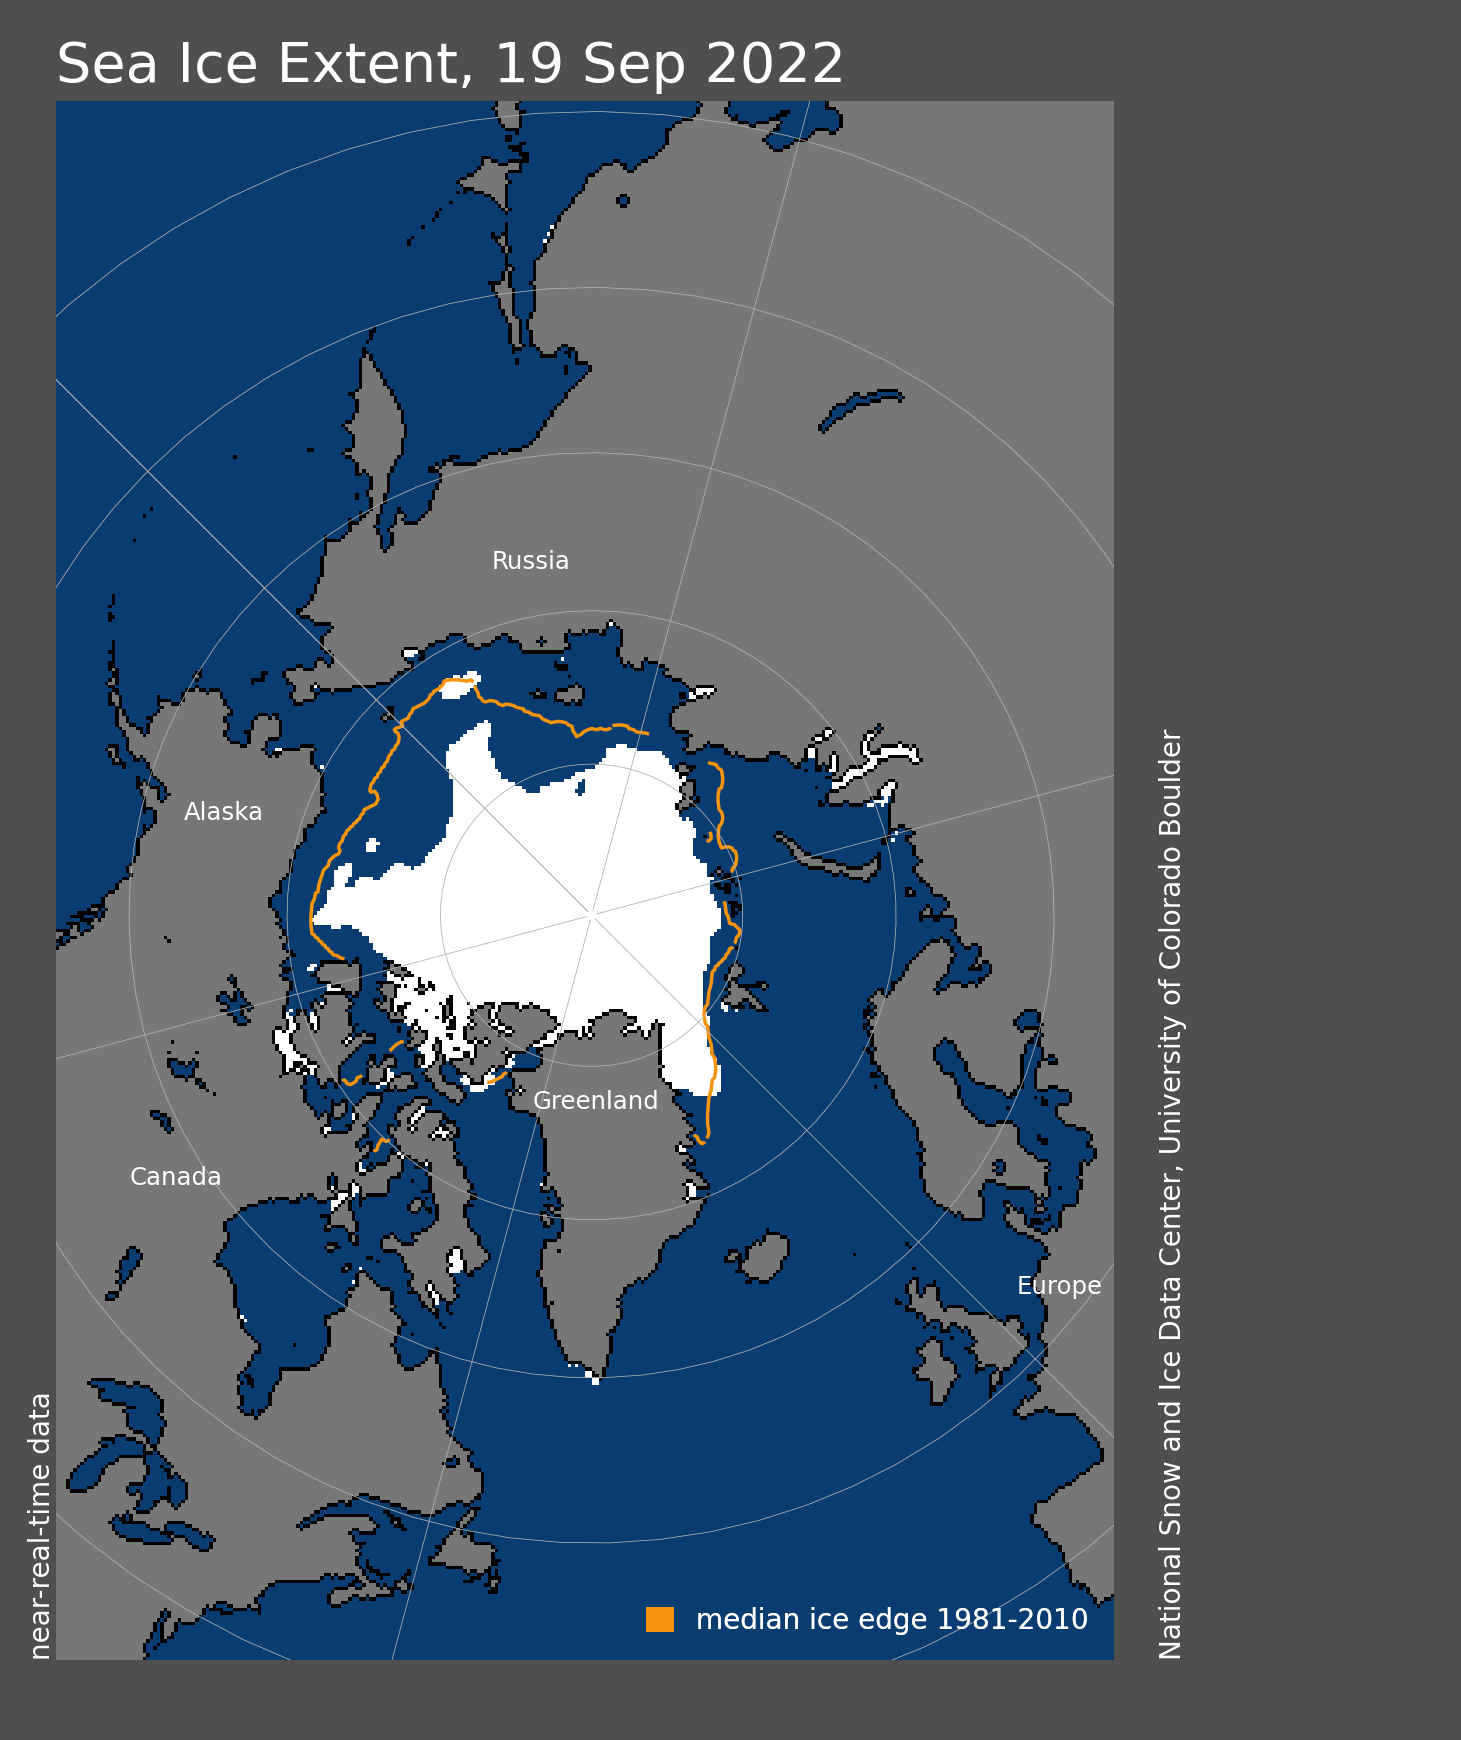
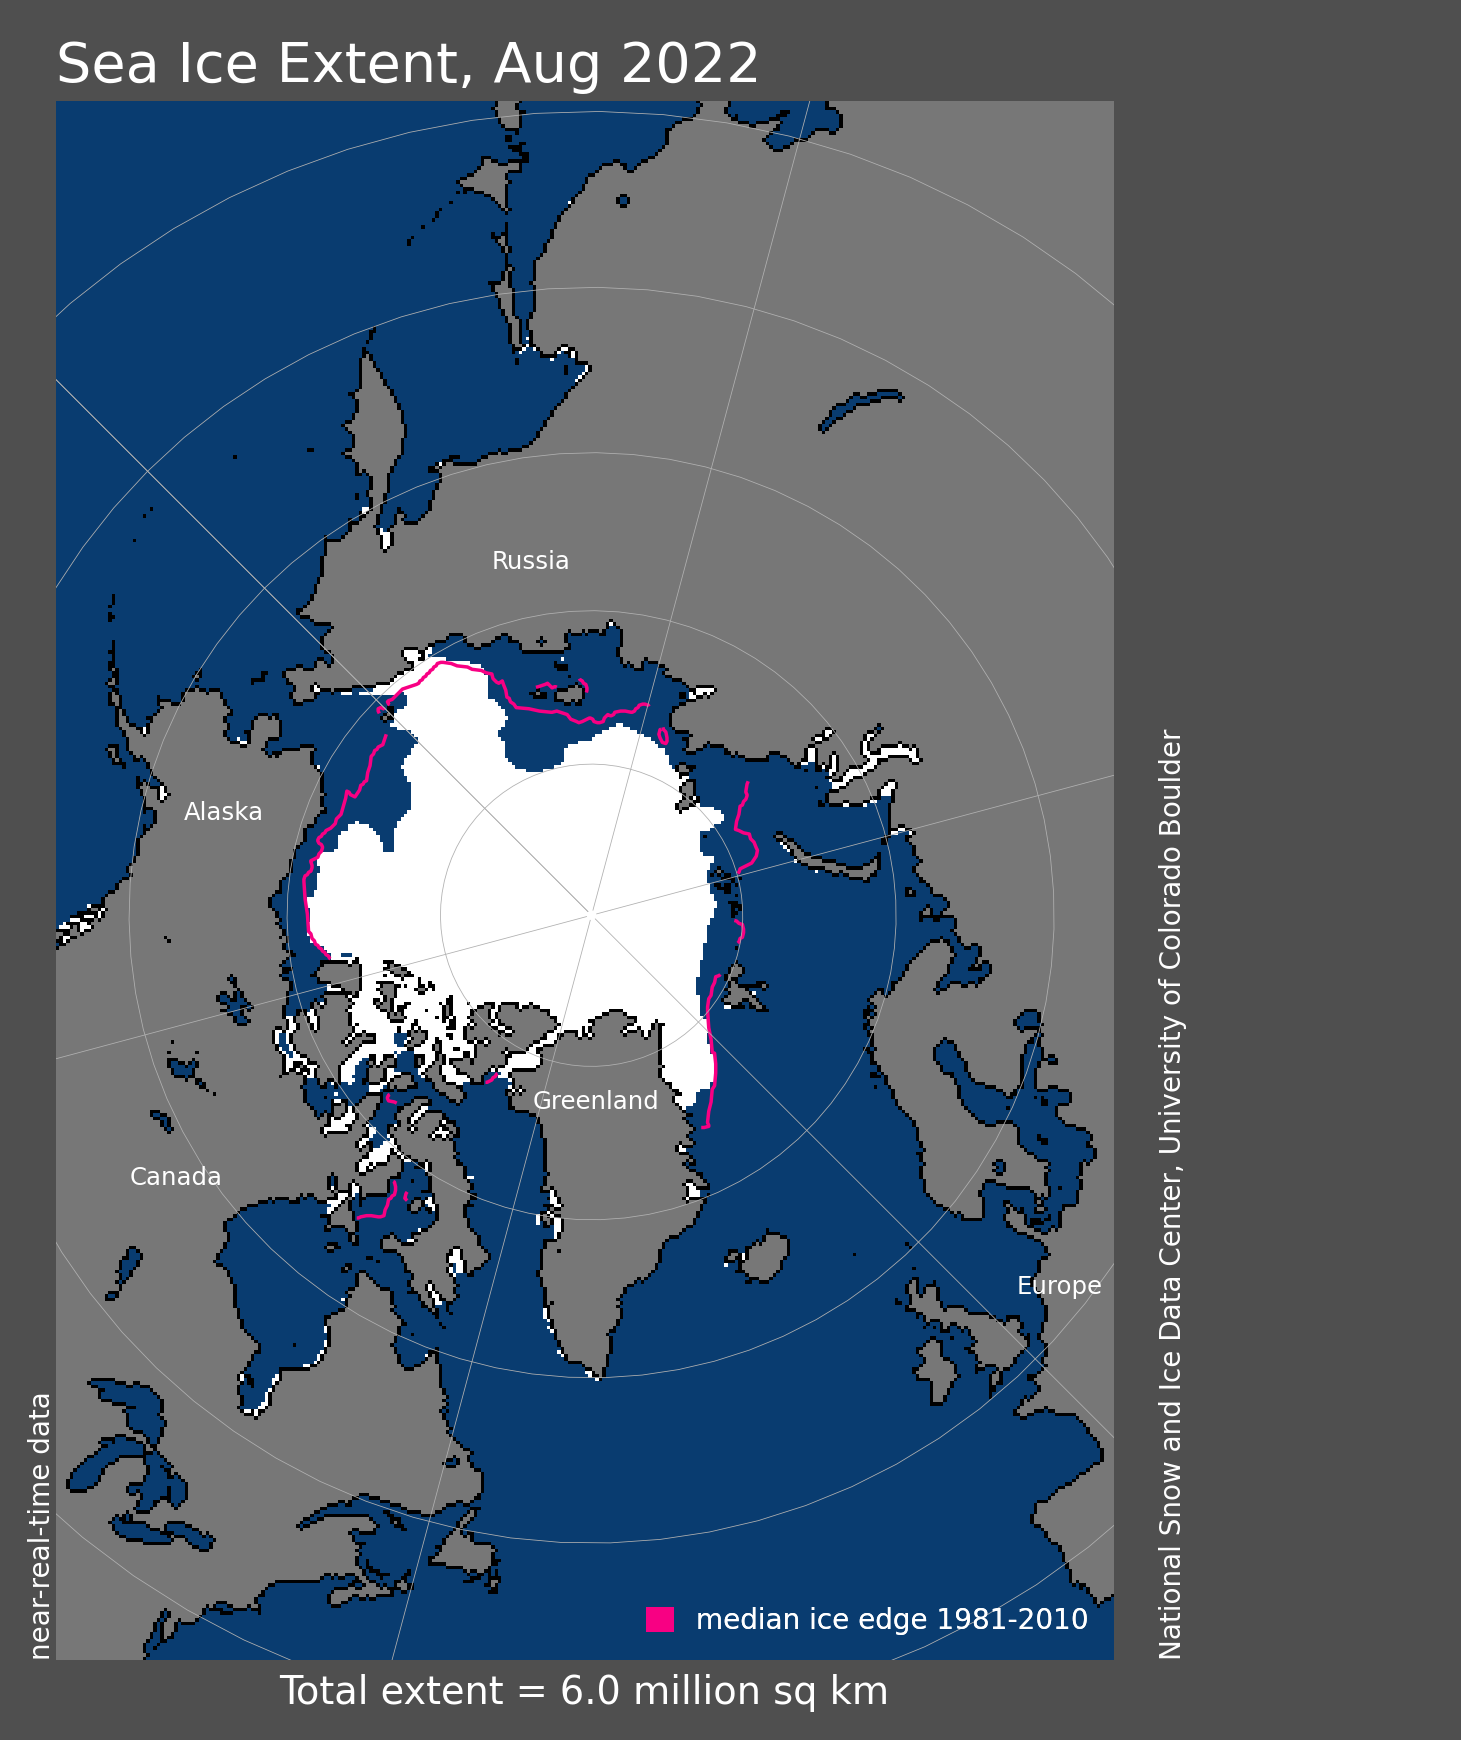
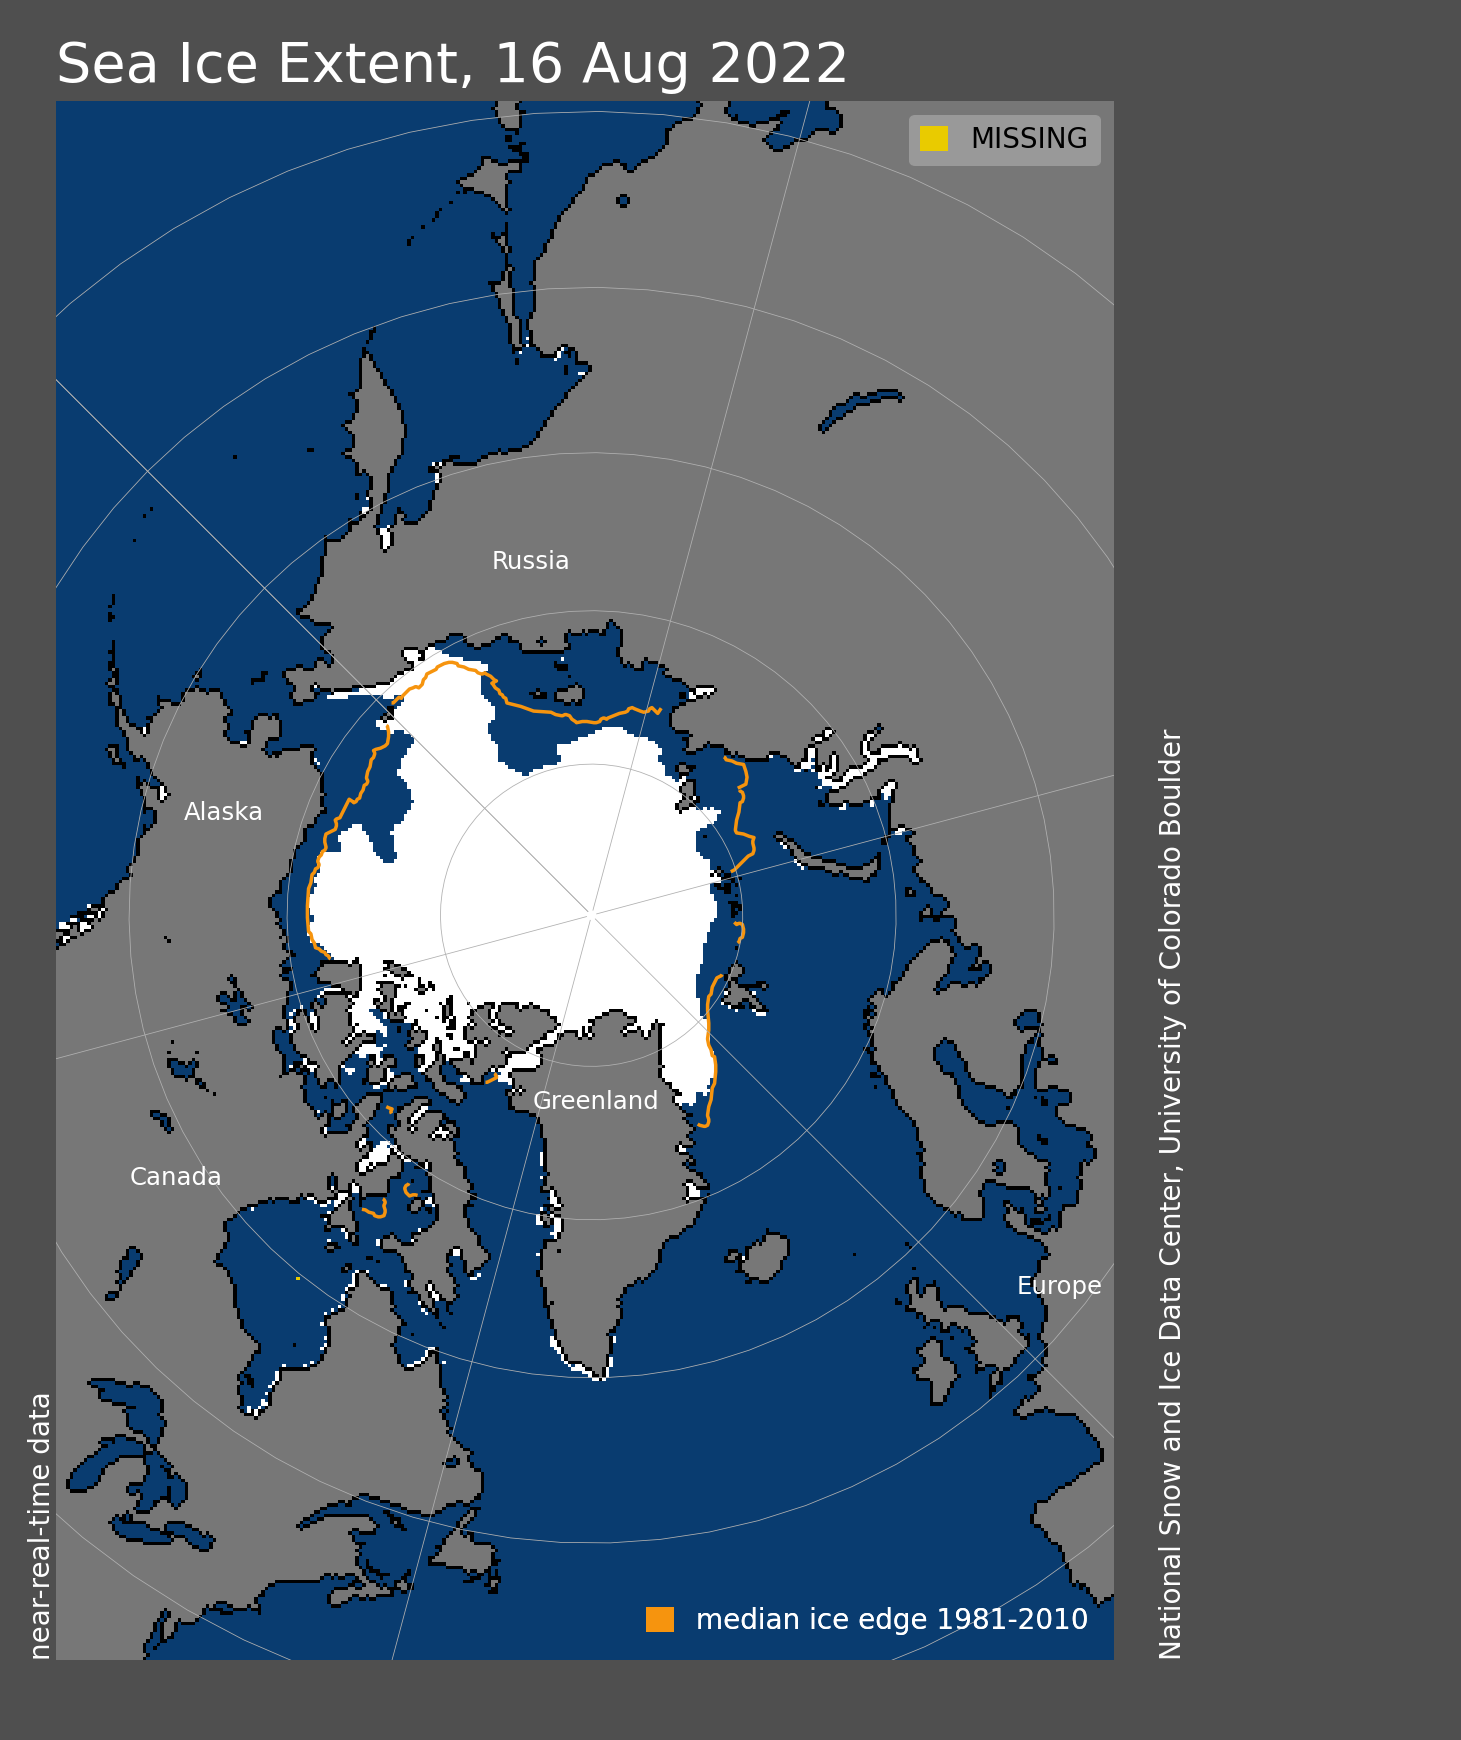
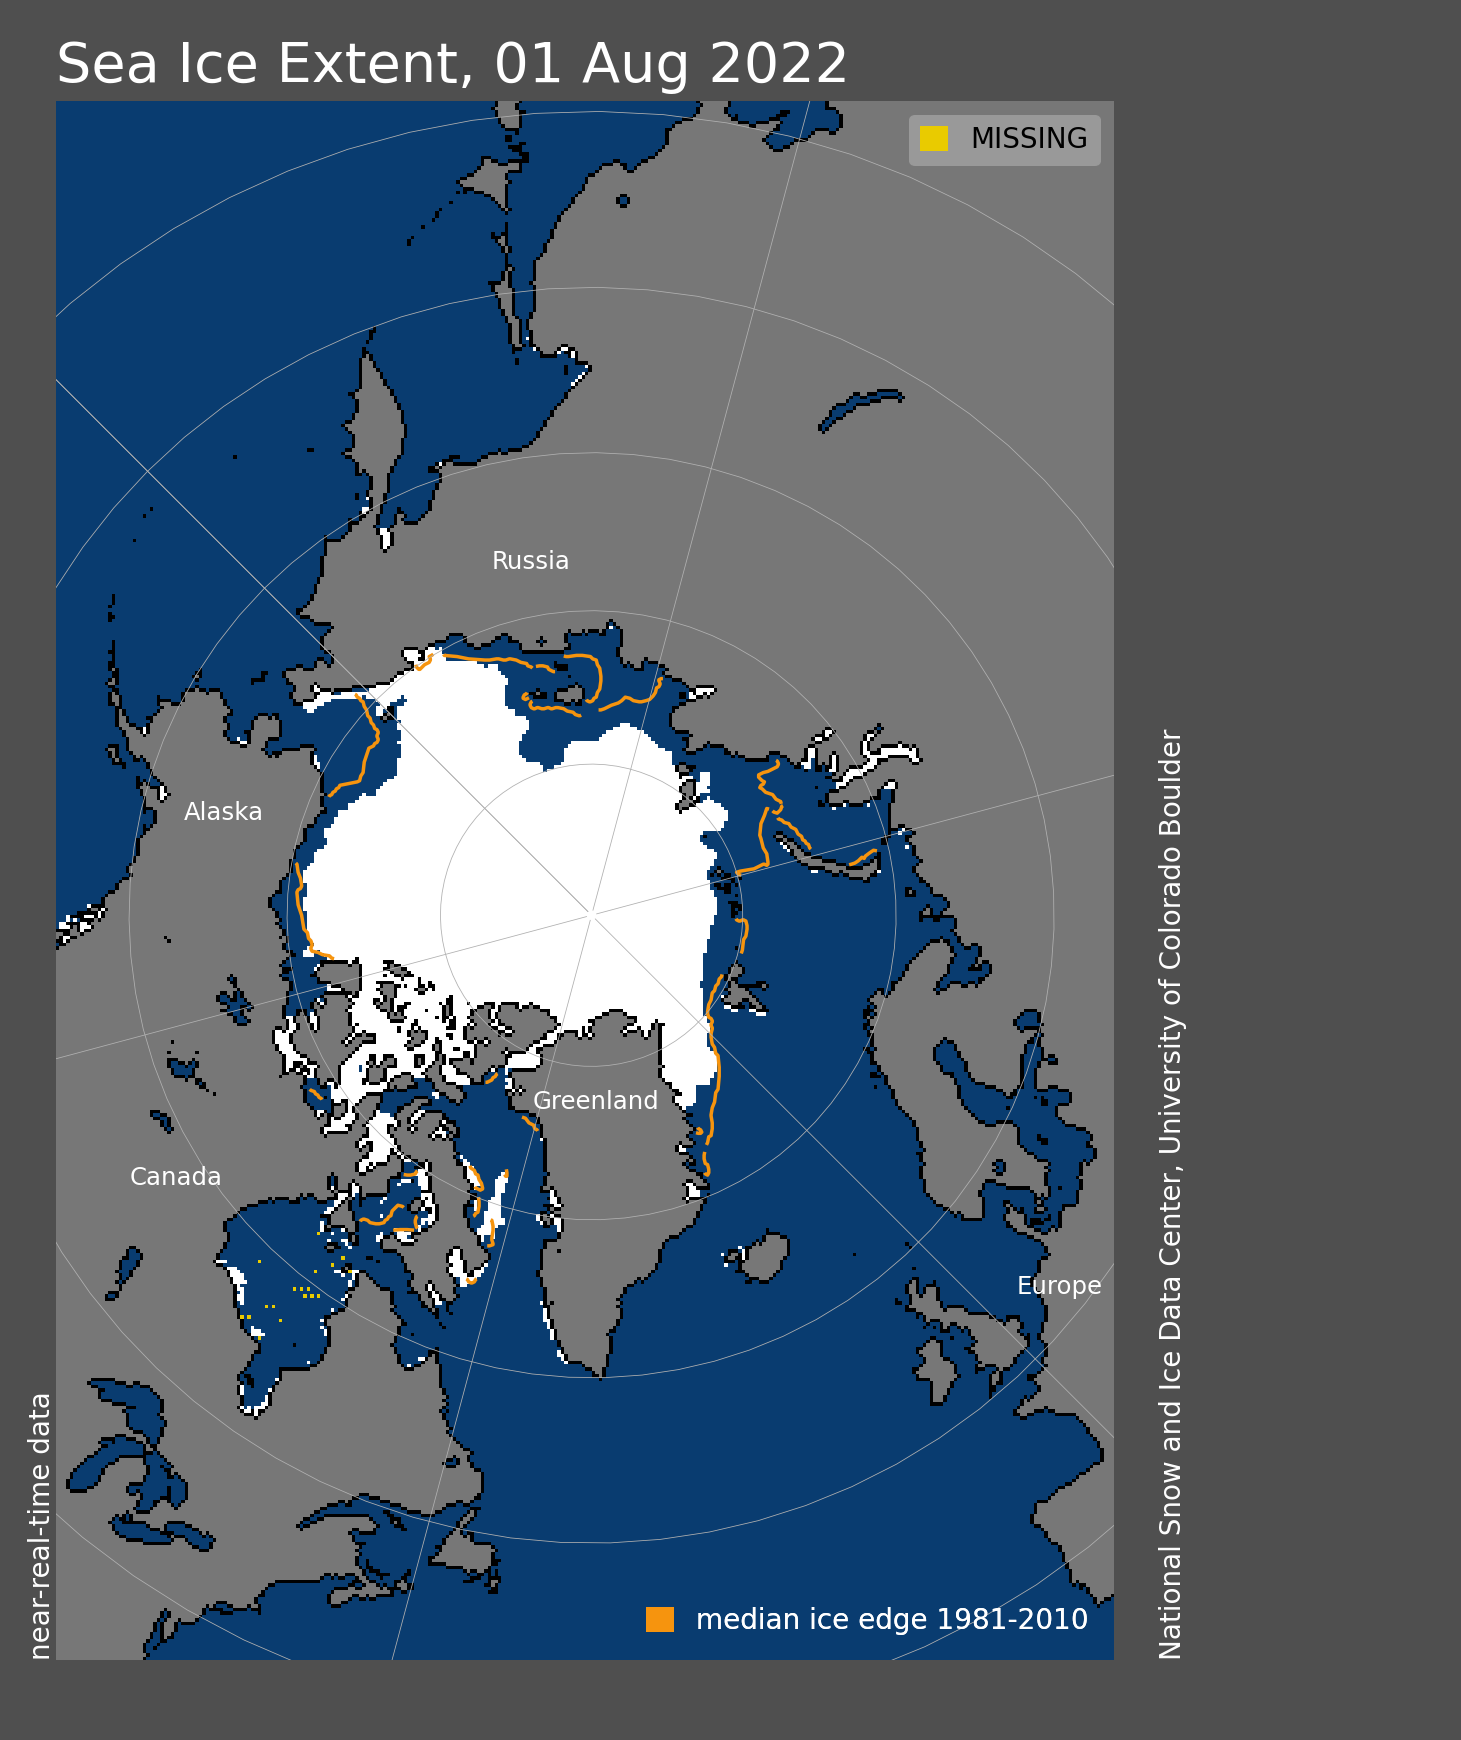
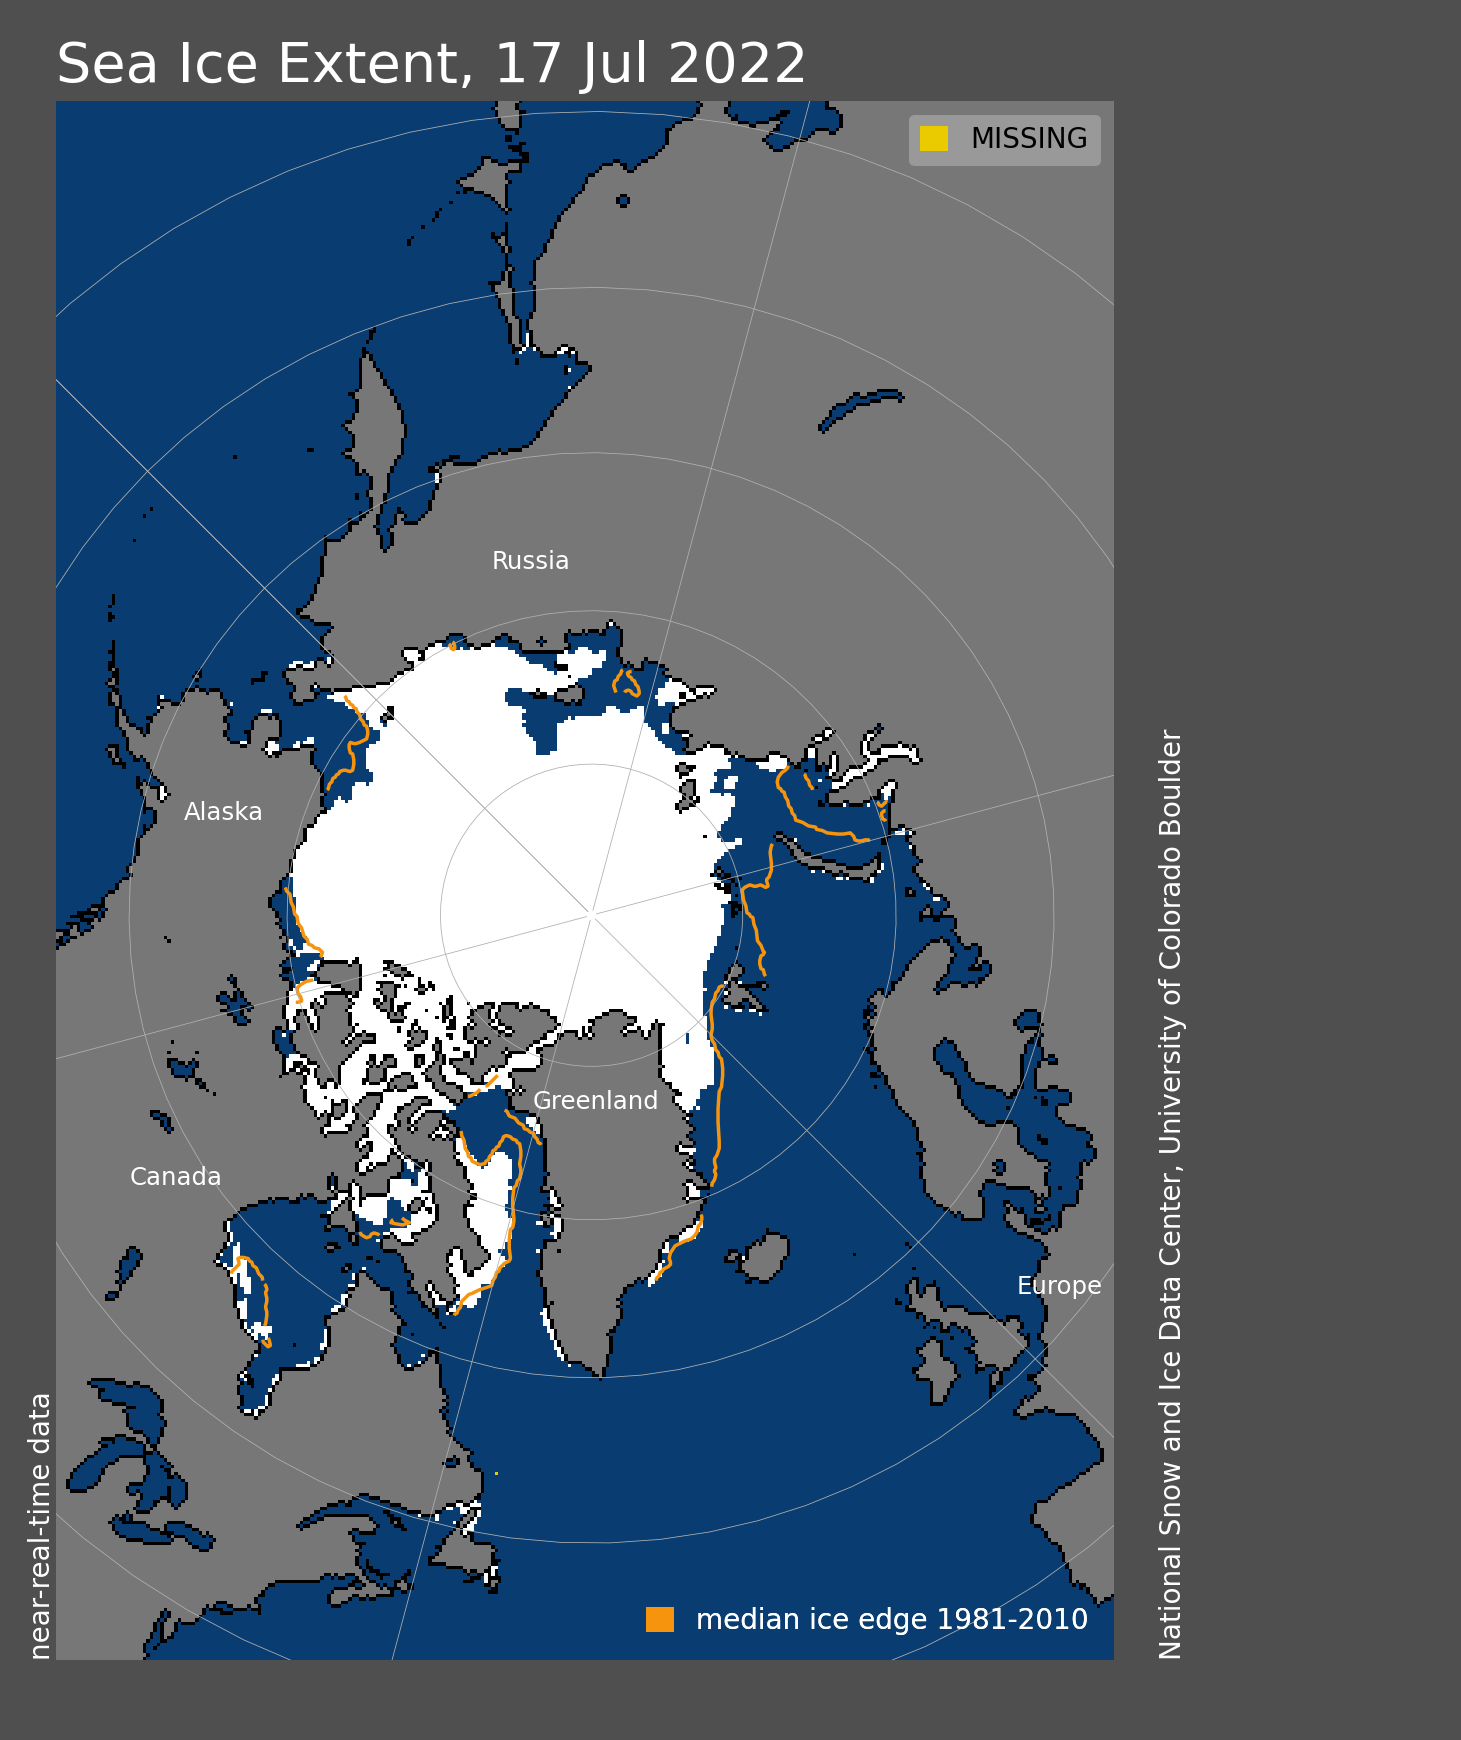
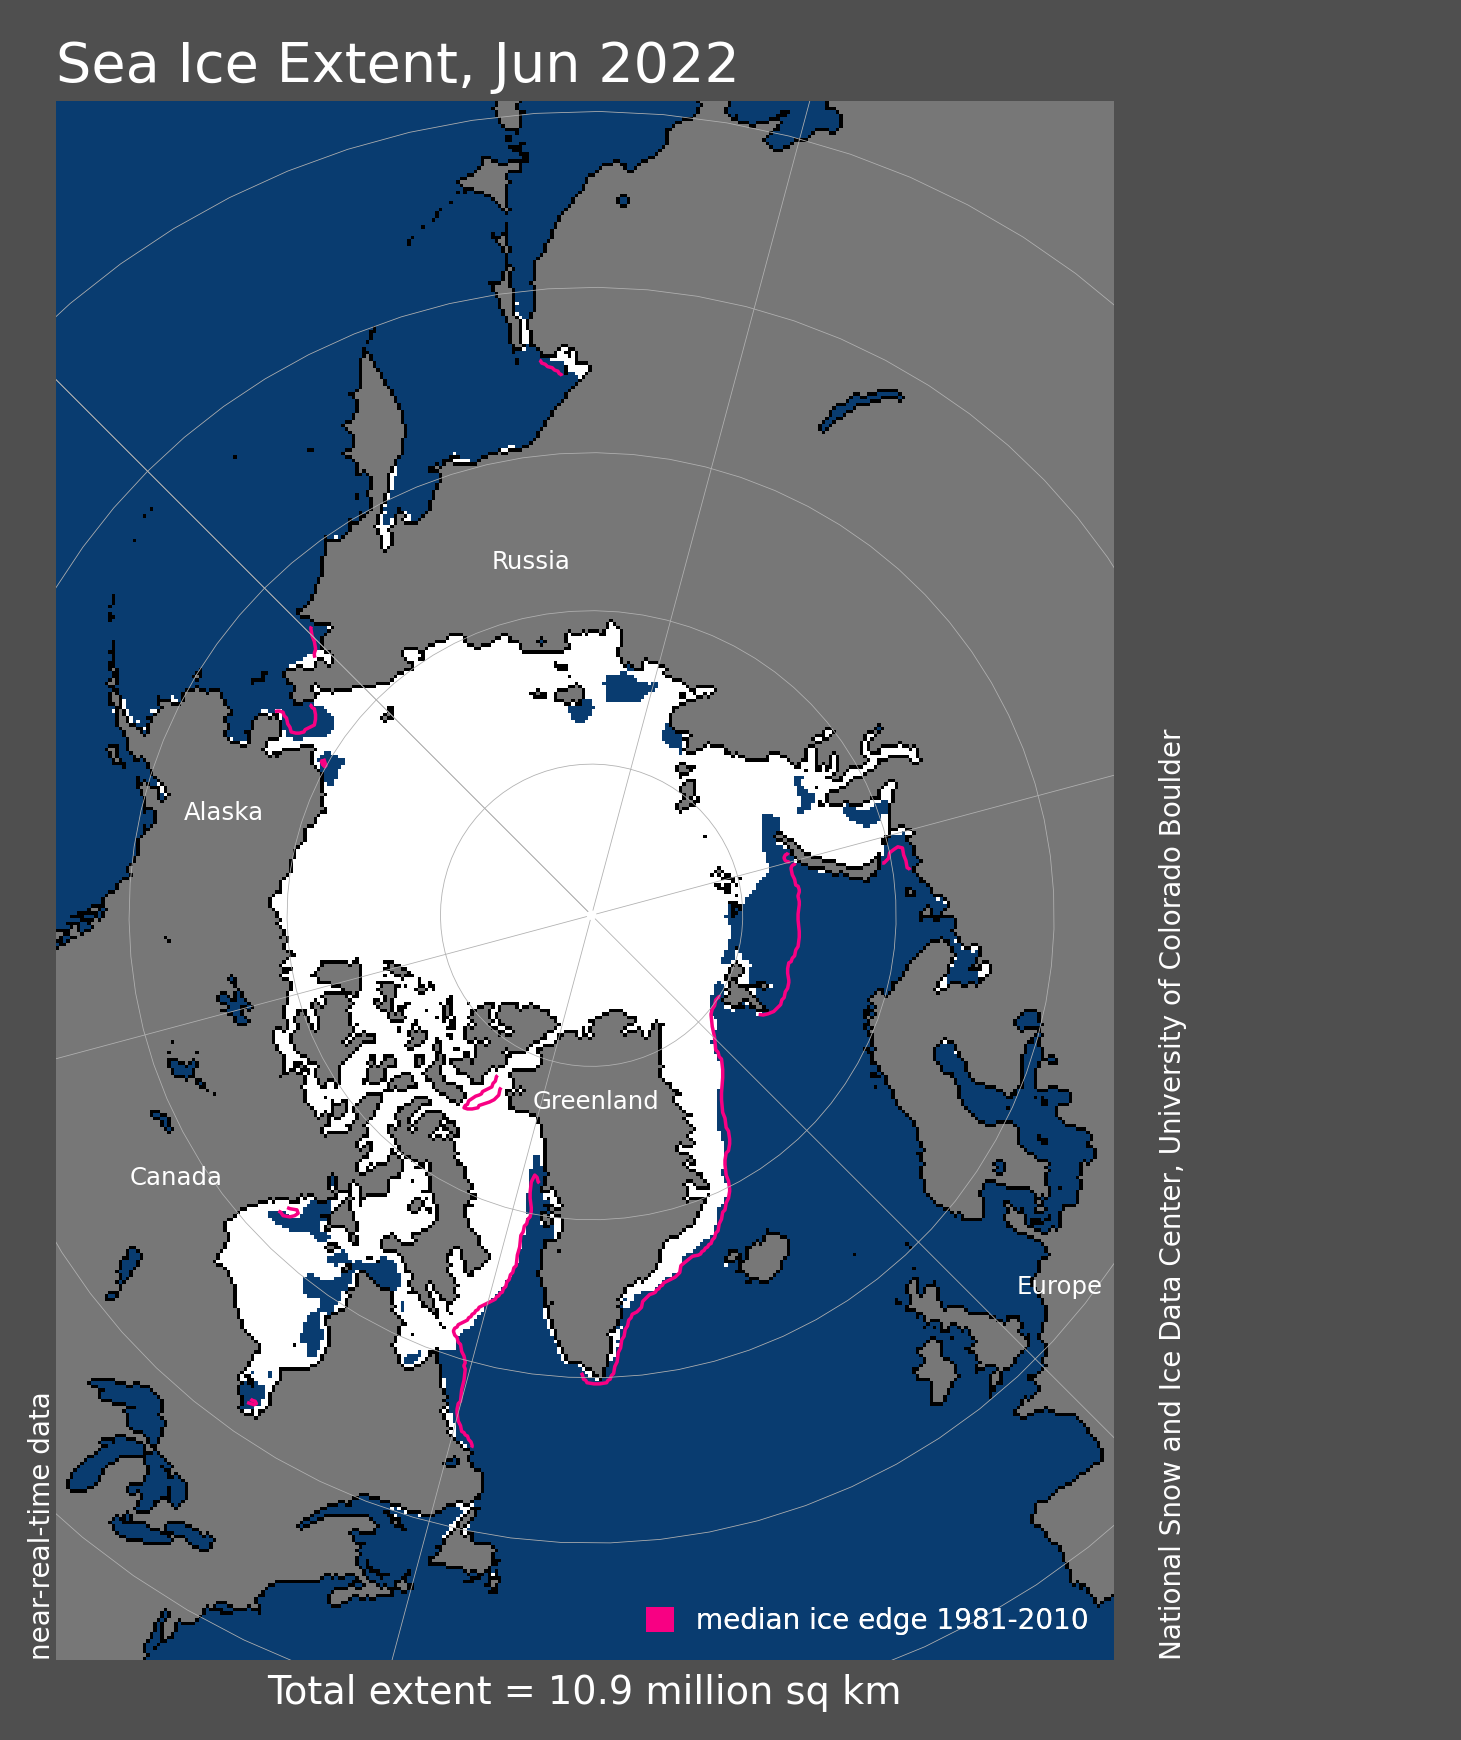
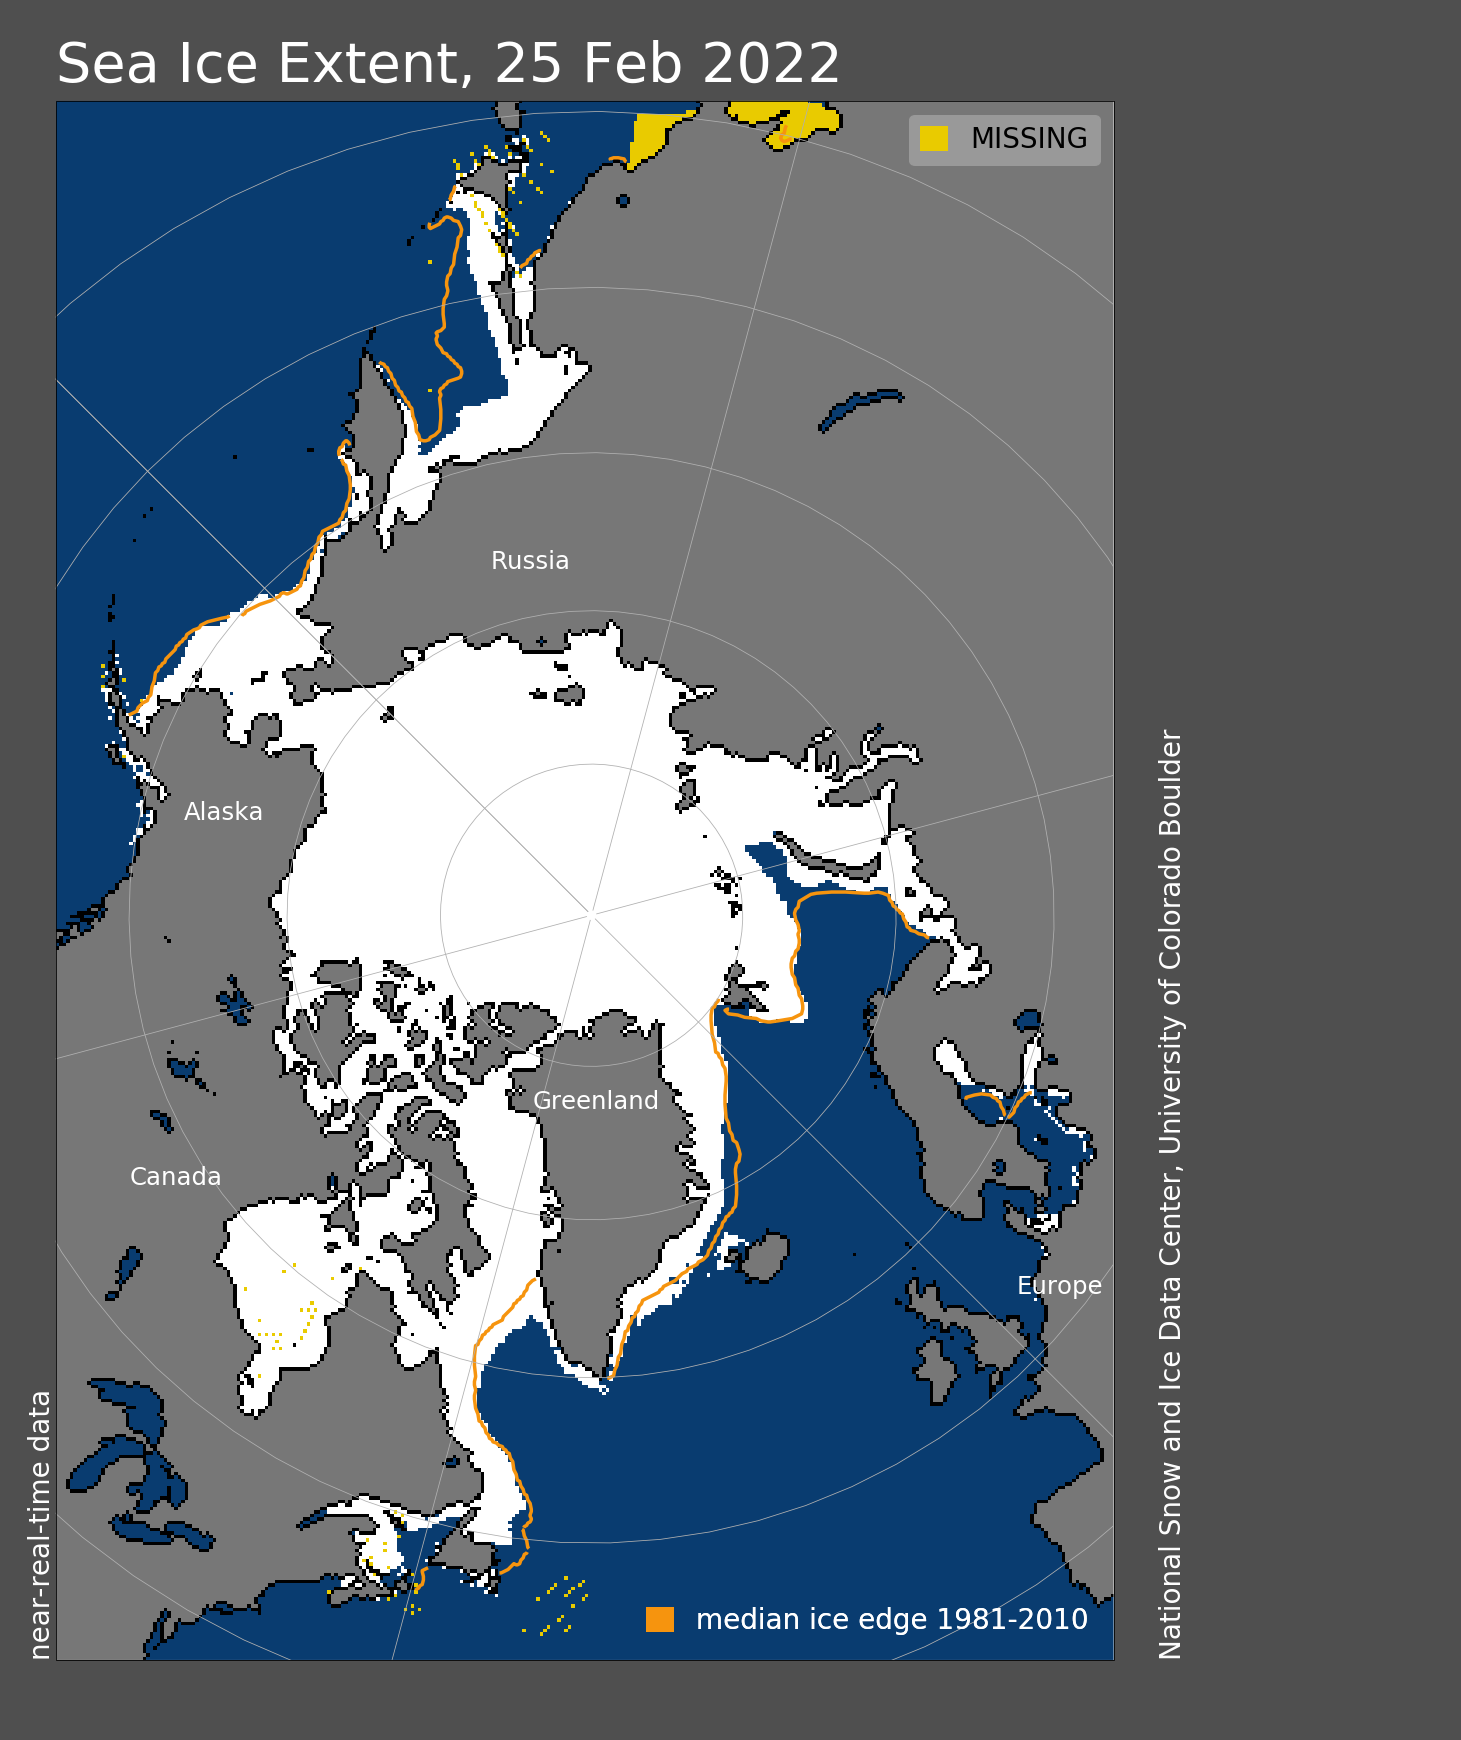
Figure 1. Arctic sea ice extent for September 19, 2022 was 4.68 million square kilometers (1.81 million square miles). The orange line shows the 1981 to 2010 average extent for that day. Sea Ice Index data. About the data
Credit: National Snow and Ice Data Center
High-resolution image
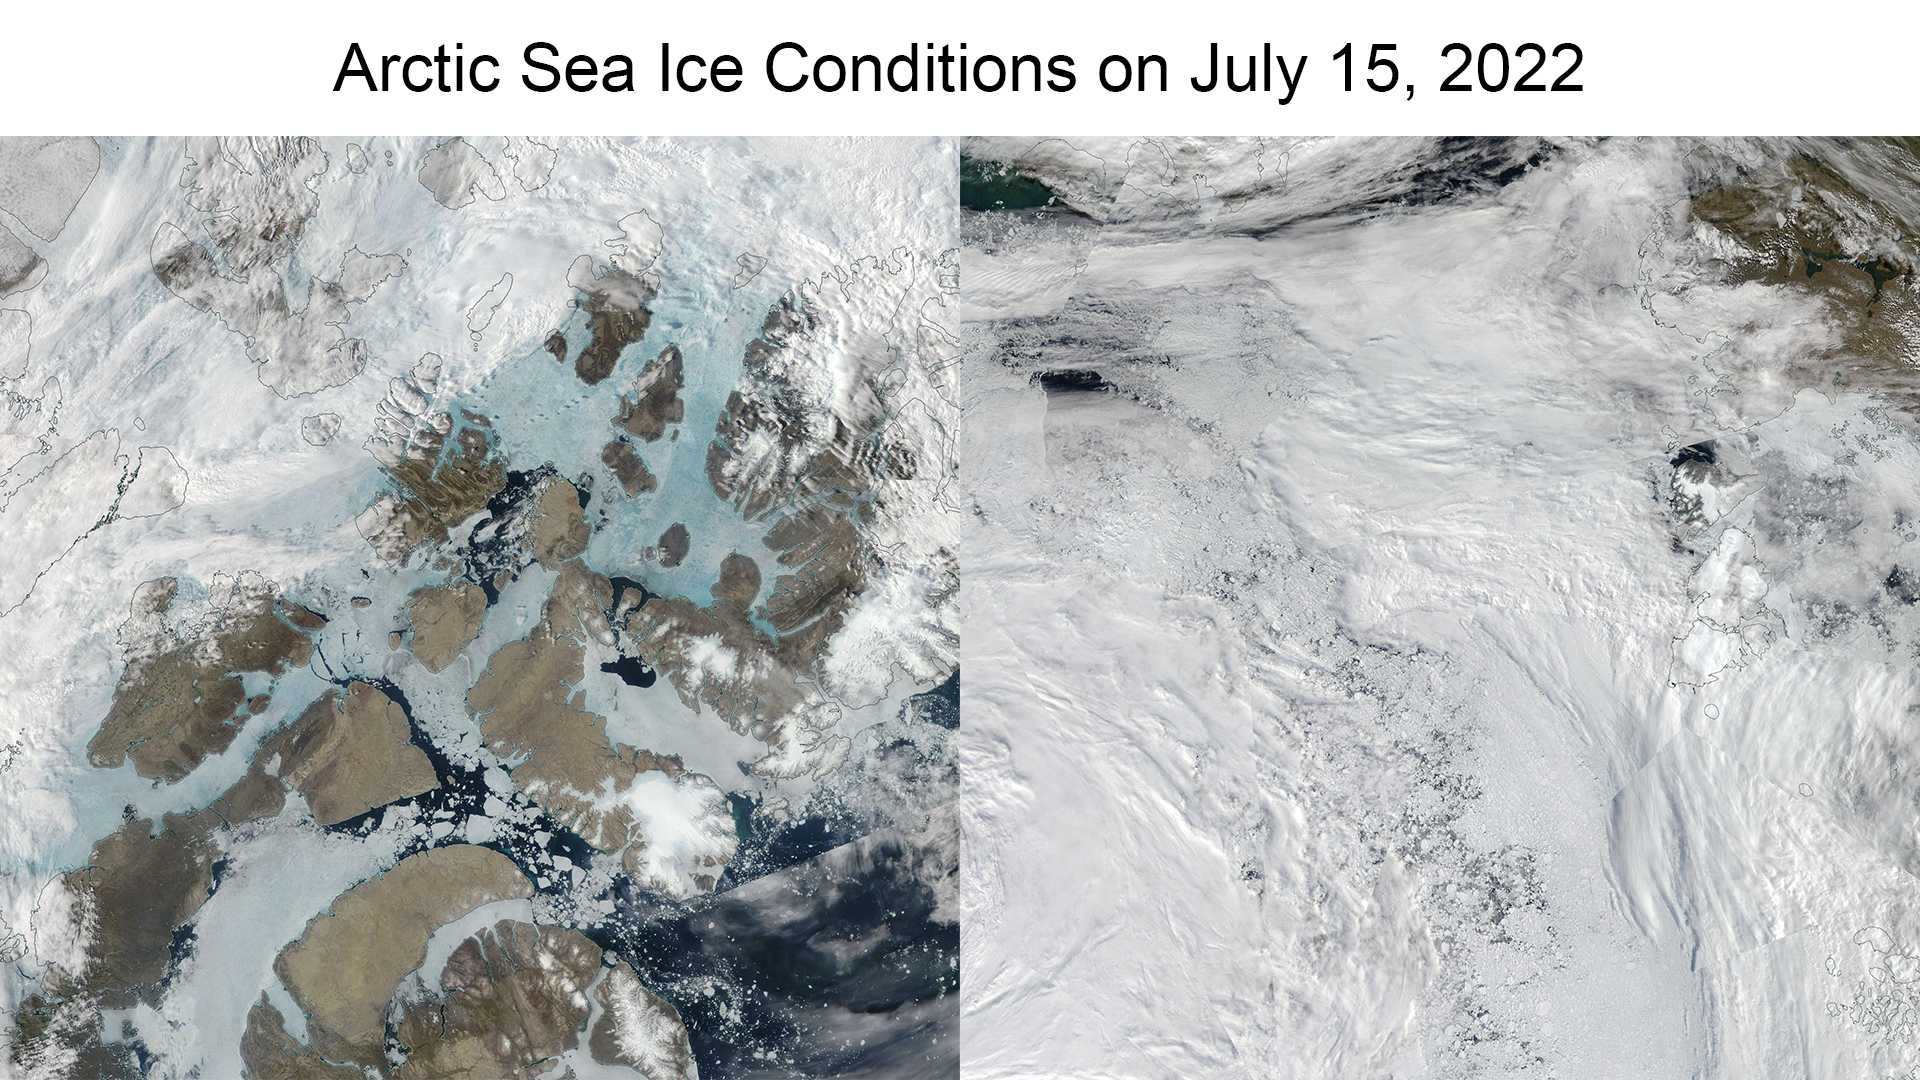
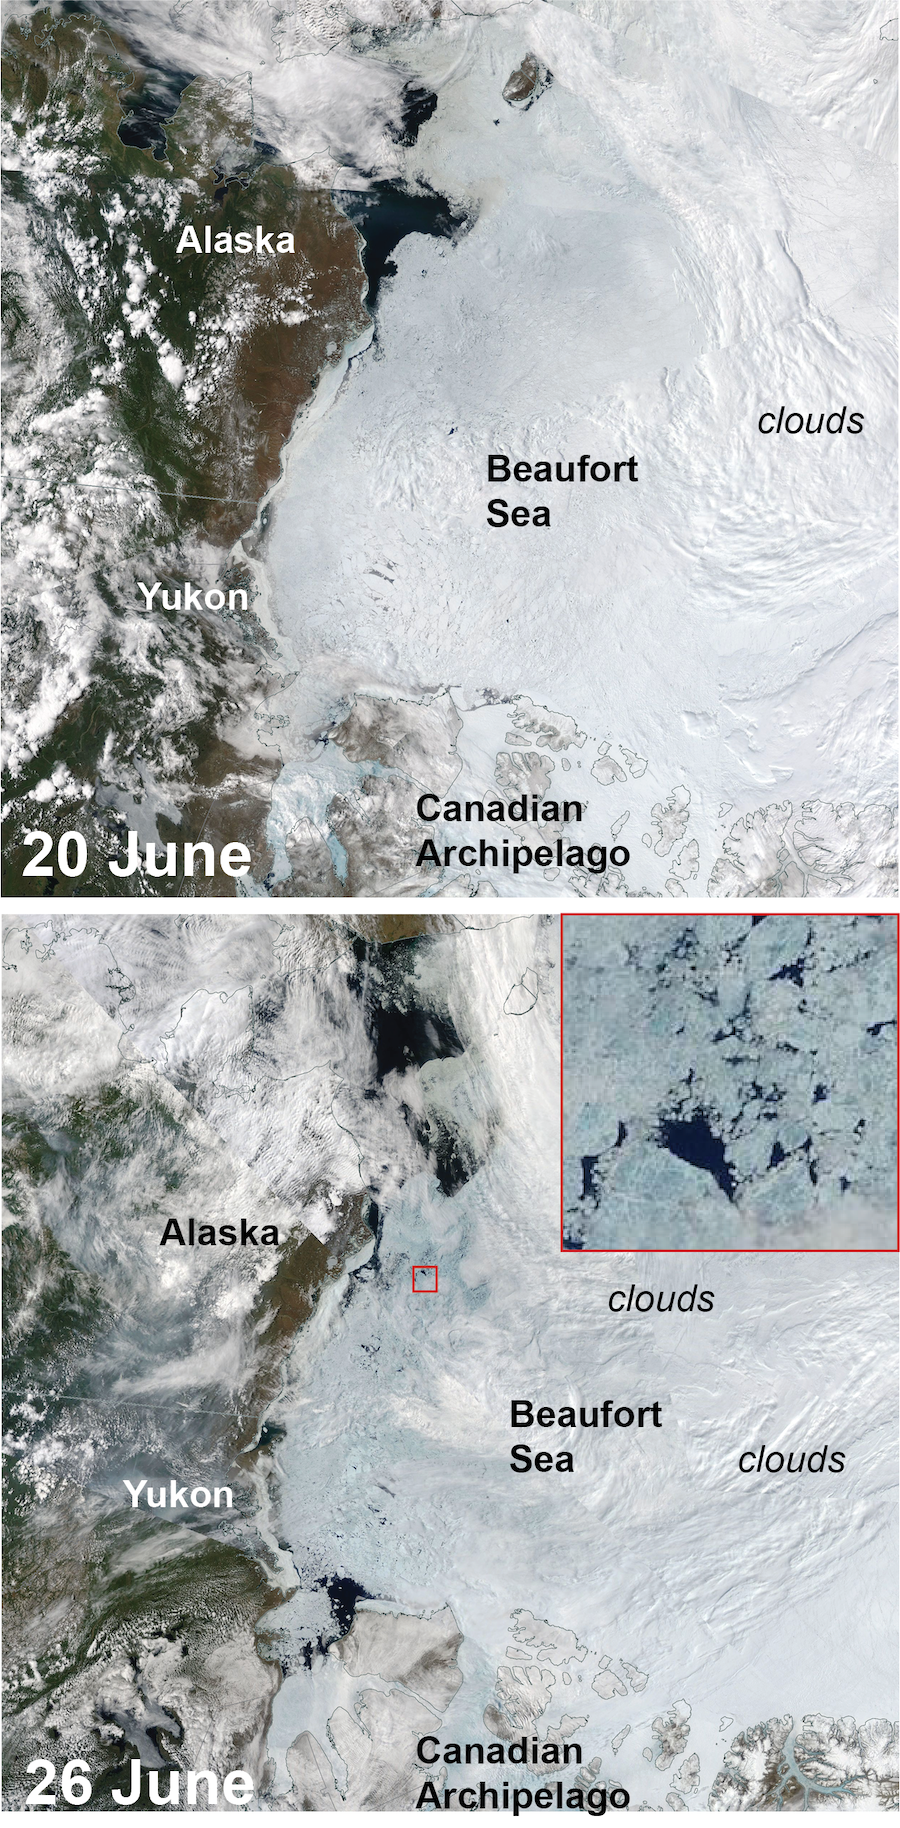
As of September 19, 2022, Arctic sea ice extent stood at 4.68 million square kilometers (1.81 million square miles), placing it ninth lowest in the satellite record for the date. Between September 1 and September 19, the Arctic lost a total of 522,000 square kilometers (202,000 square miles) of ice, at an average rate of 27,500 square kilometers (10,600 square miles) per day. This was slightly faster than the average daily loss rate over this period. As of September 19, sea ice extent was tracking close to the levels observed in 2010, and the spatial pattern of sea ice extent is similar. As seen in Advanced Microwave Scanning Radiometer 2 (AMSR2) imagery, an island, or patch, of apparently fairly thick ice has separated from the main pack in the East Siberian Sea. Another smaller isolated patch is present in the Beaufort Sea. The Northern Sea Route and the southern (Amundsen’s) route through the Northwest Passage remain open and will likely remain so for several more weeks. The northern route through the Northwest Passage still has some scattered areas of pack ice not picked up in satellite passive microwave imagery.
Conditions in context
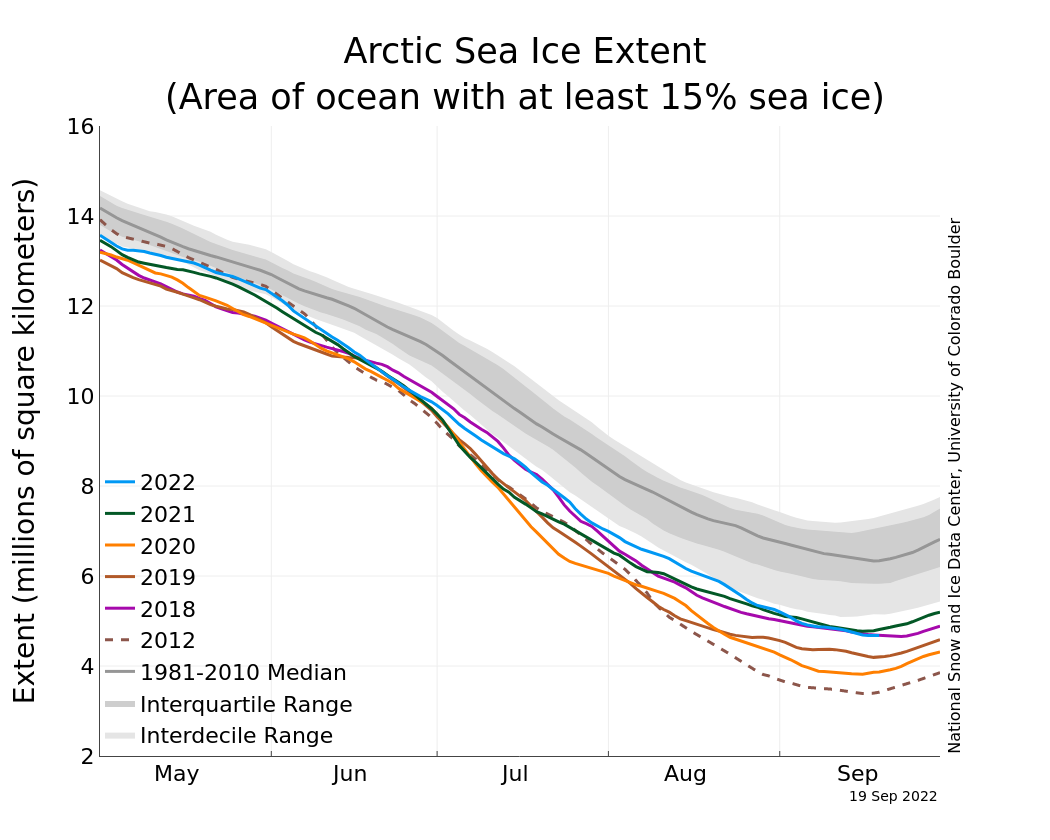
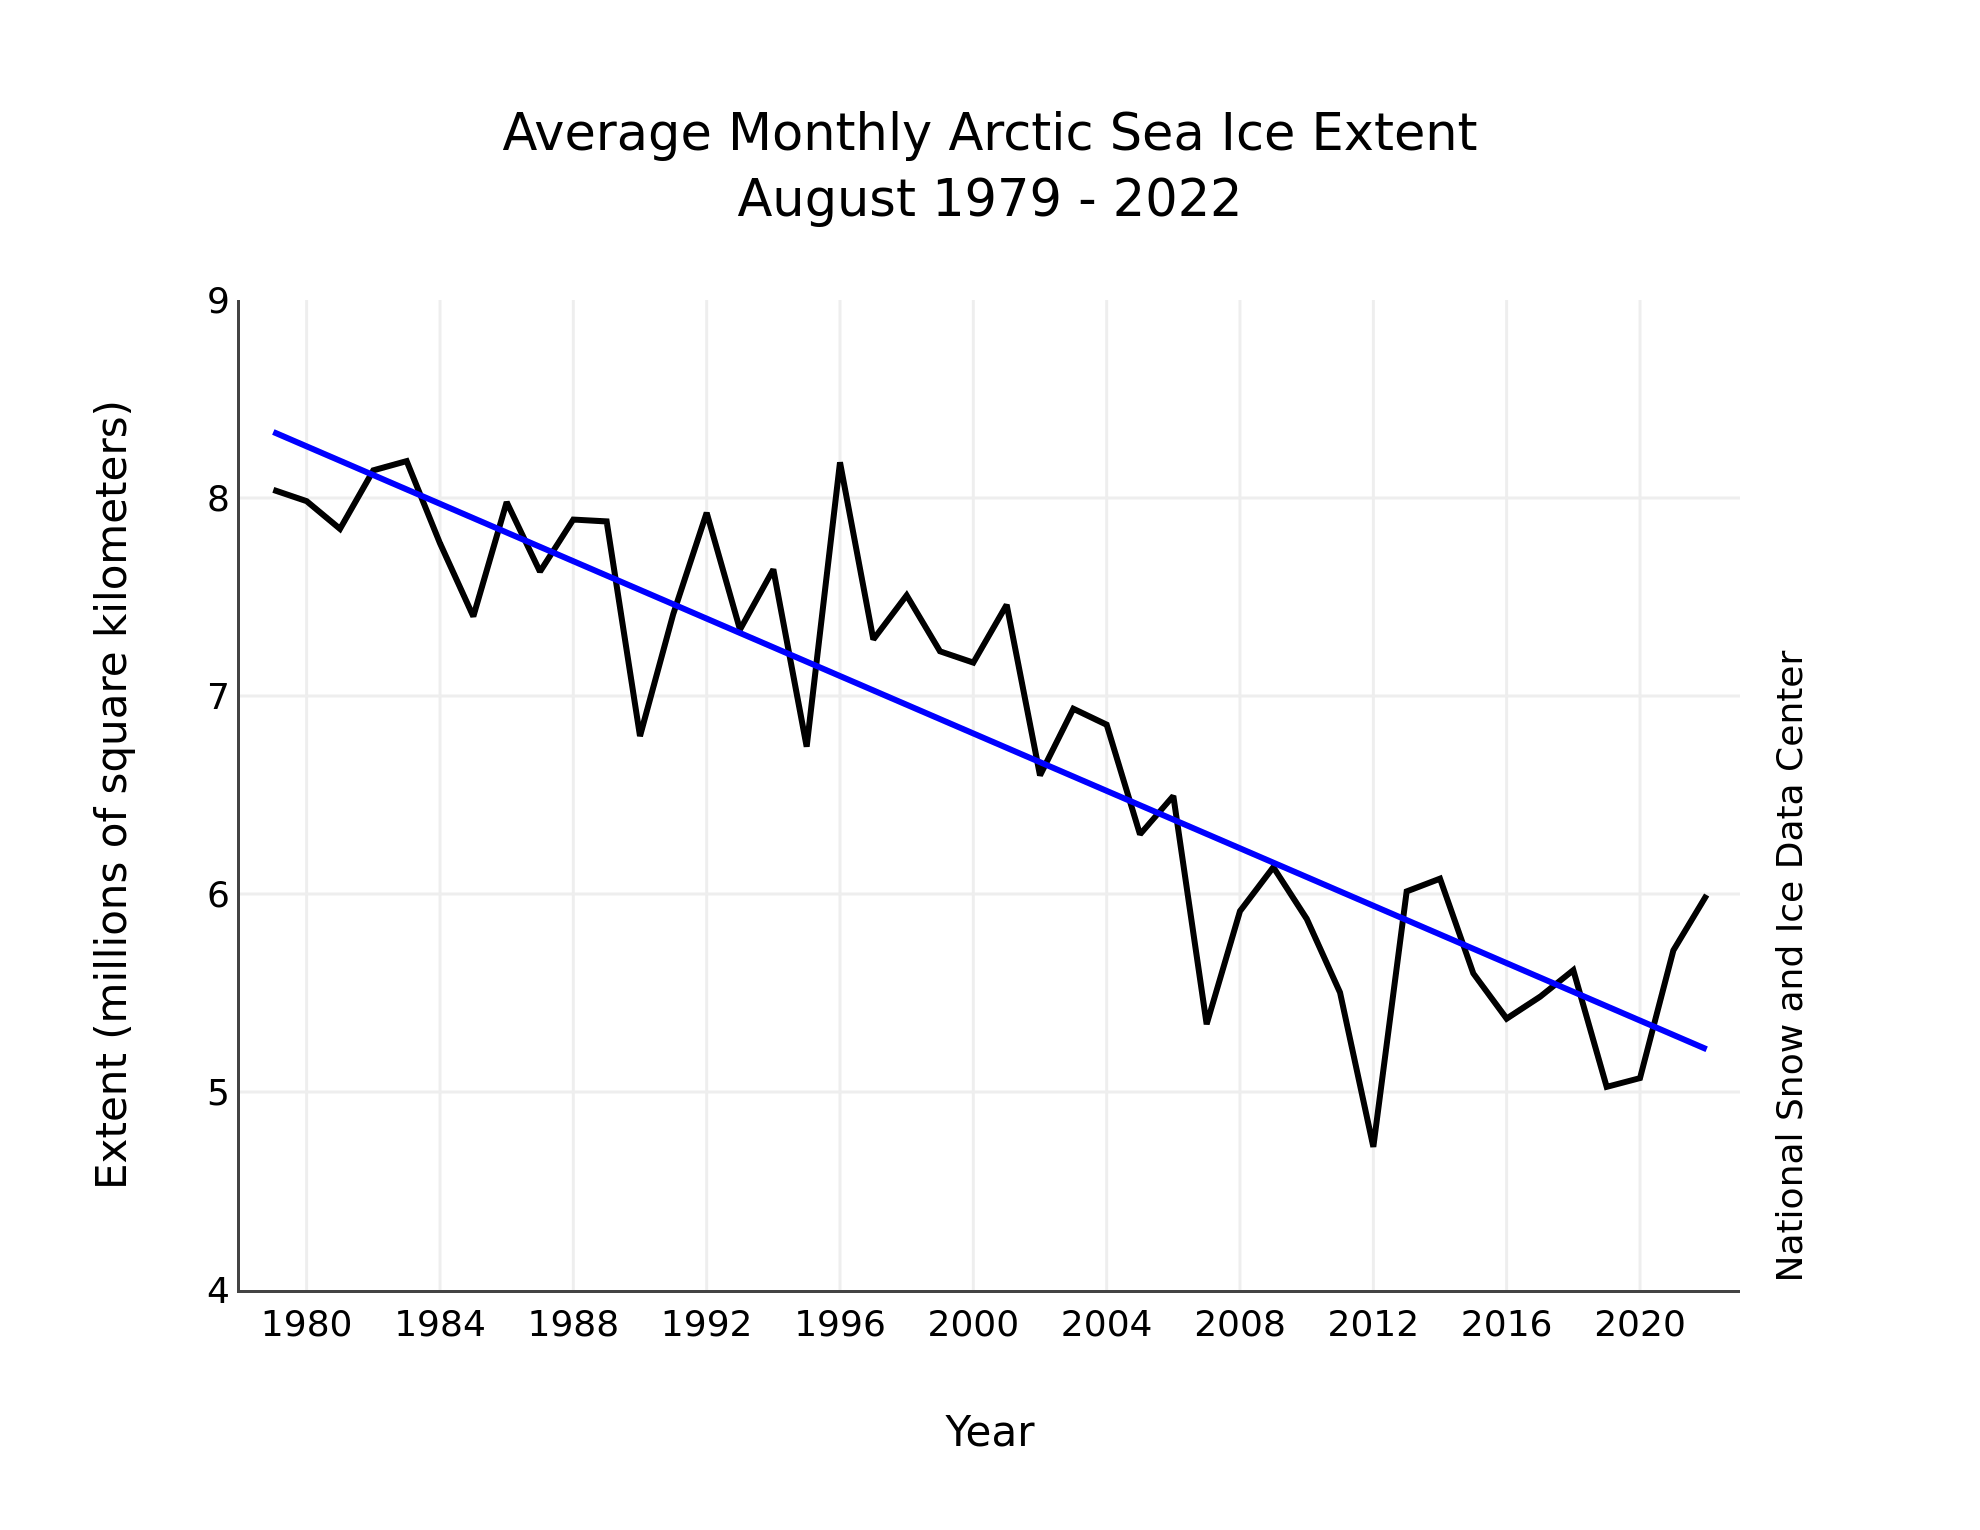
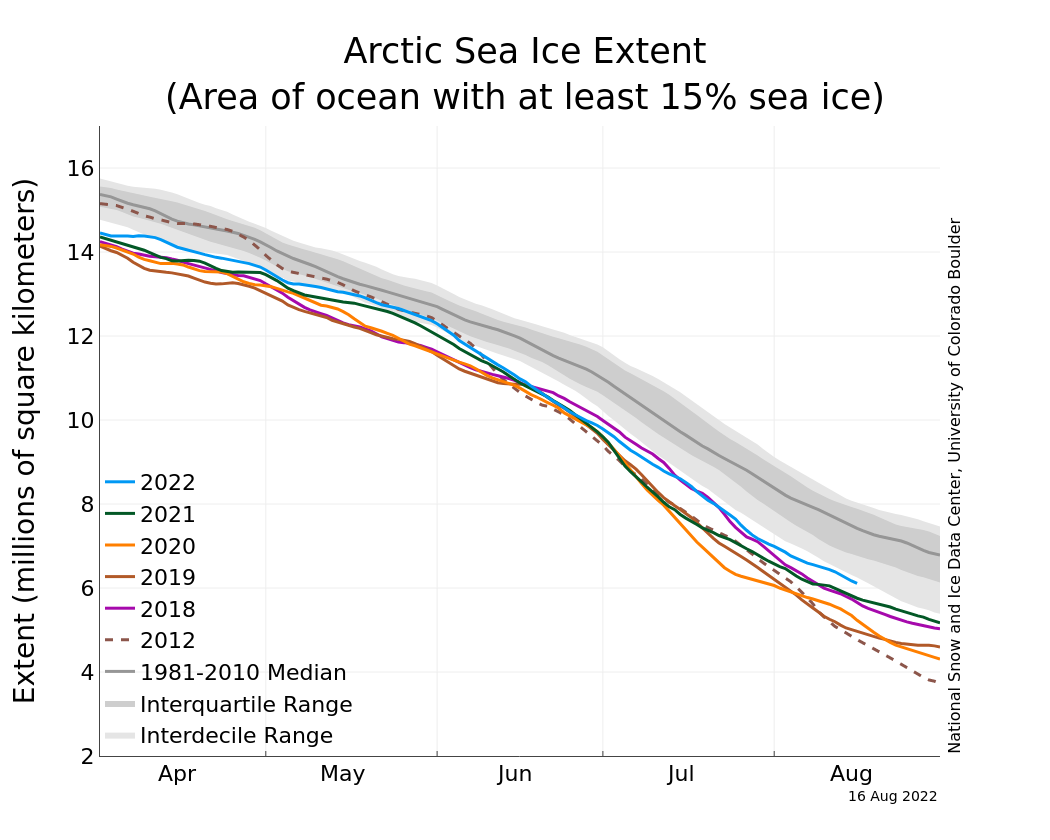
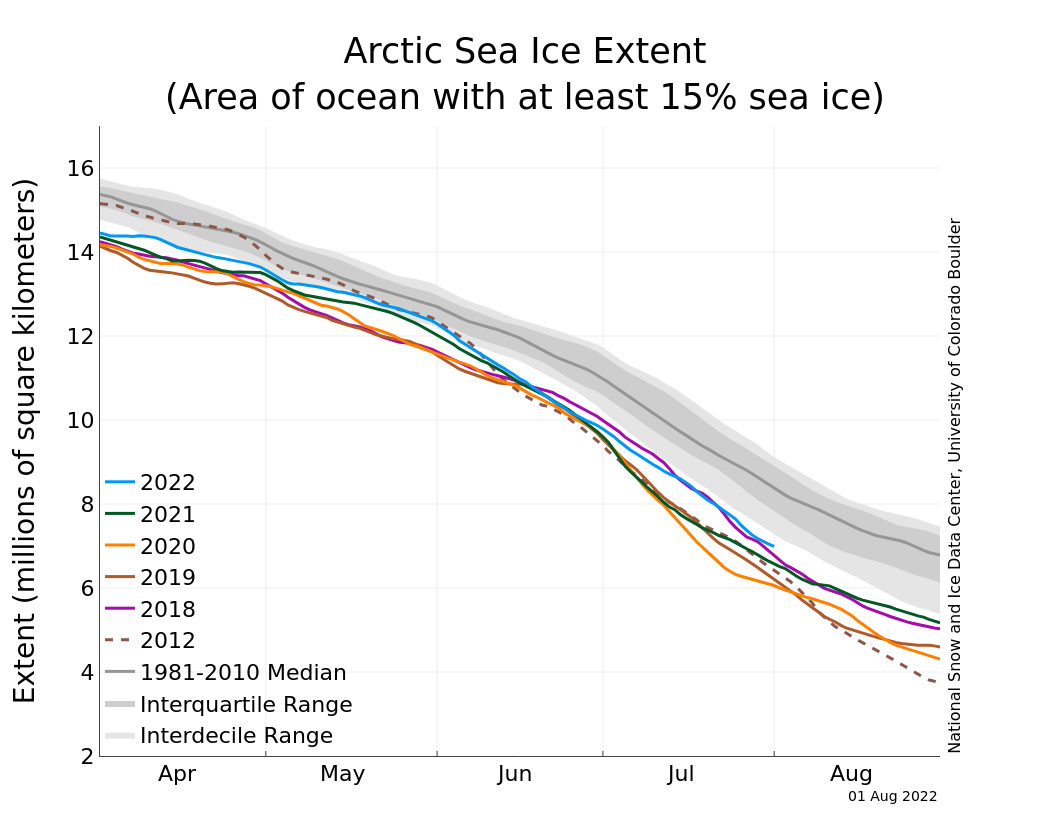
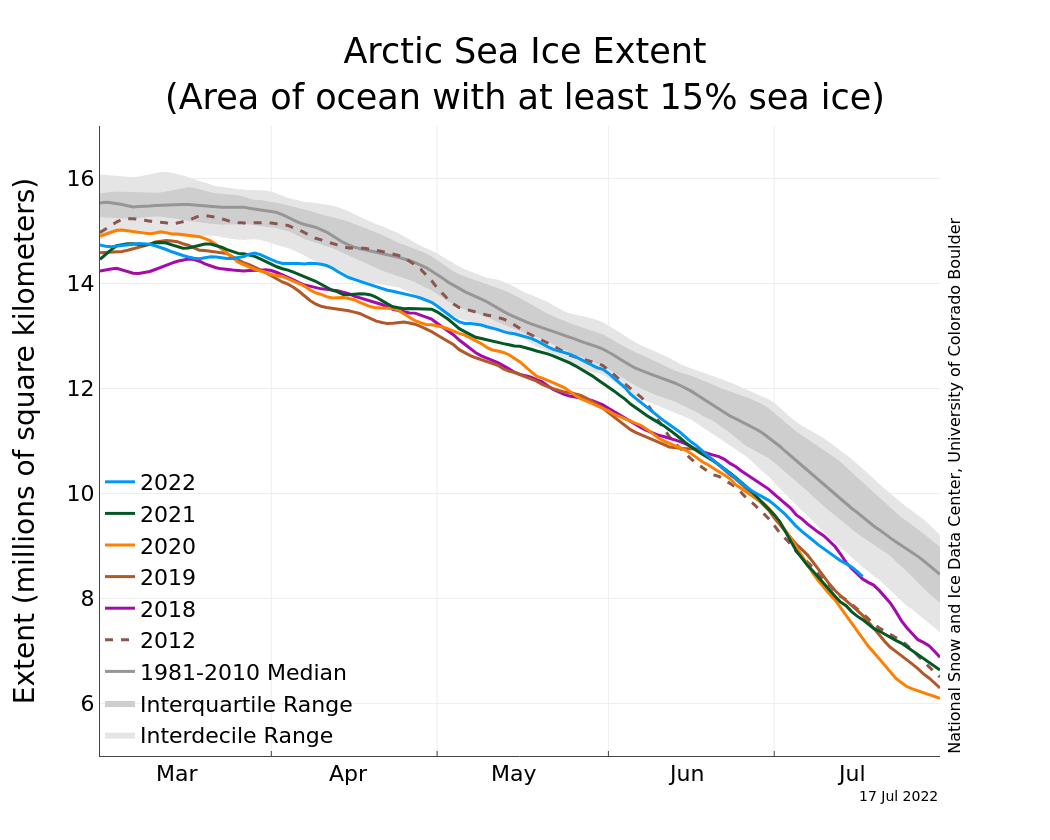
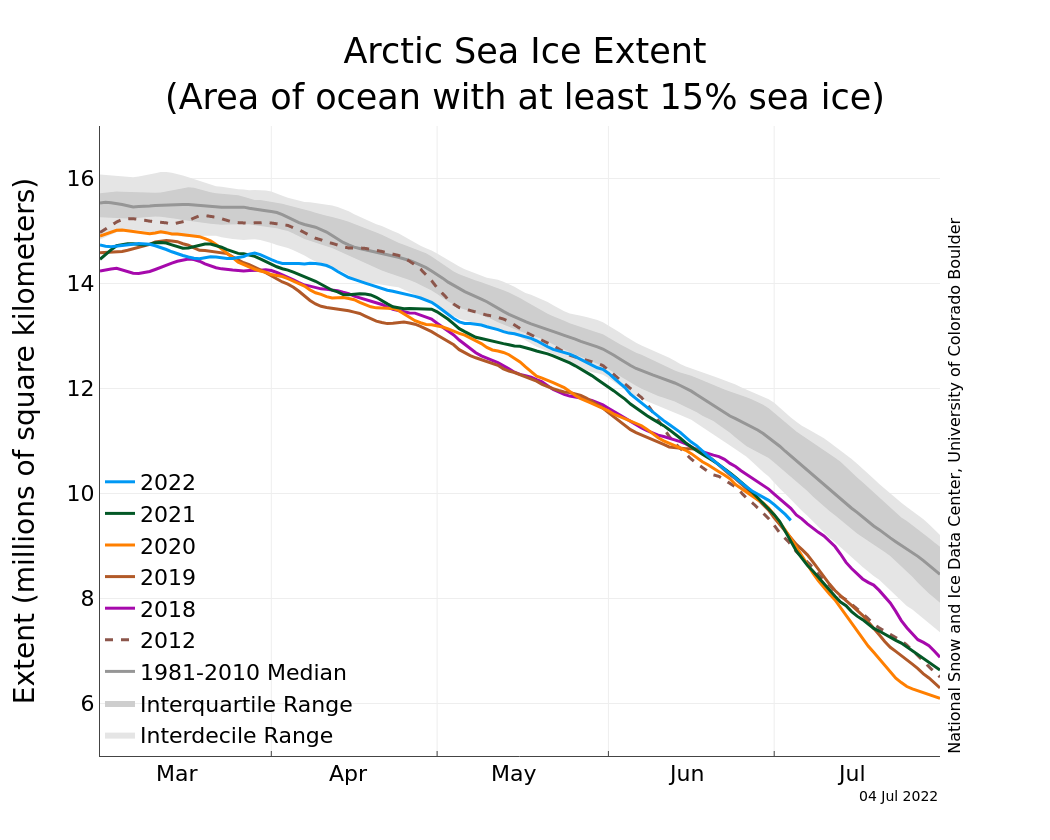
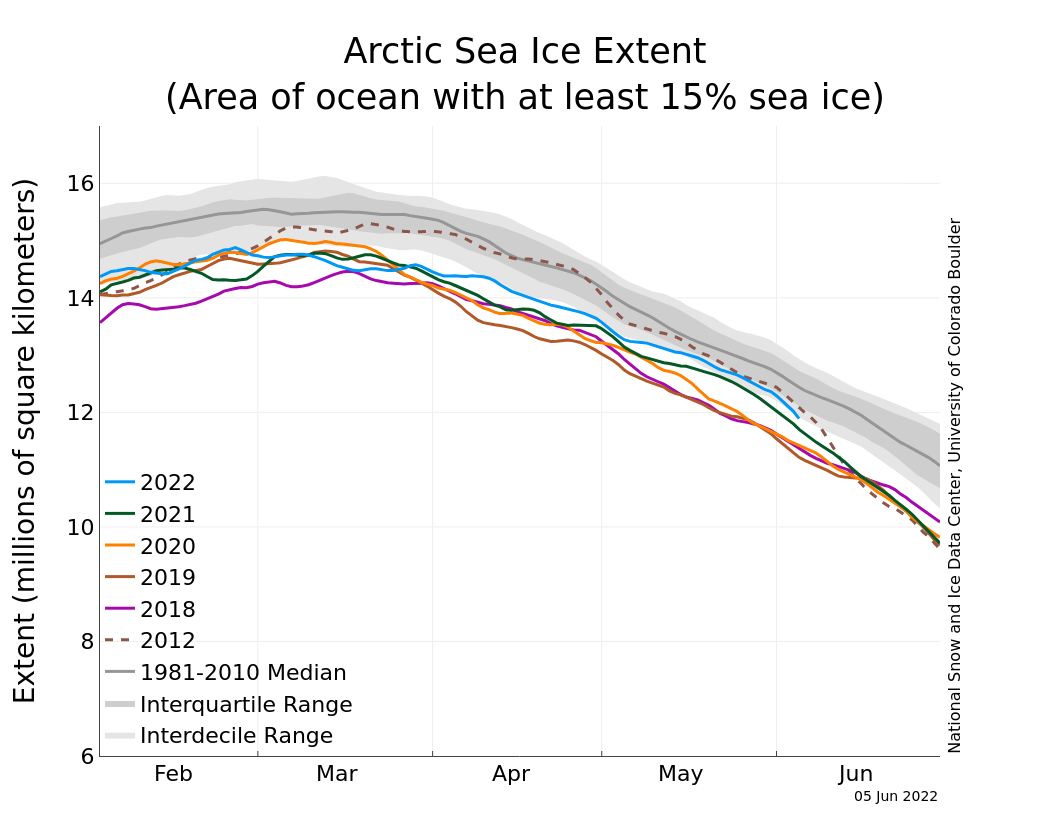
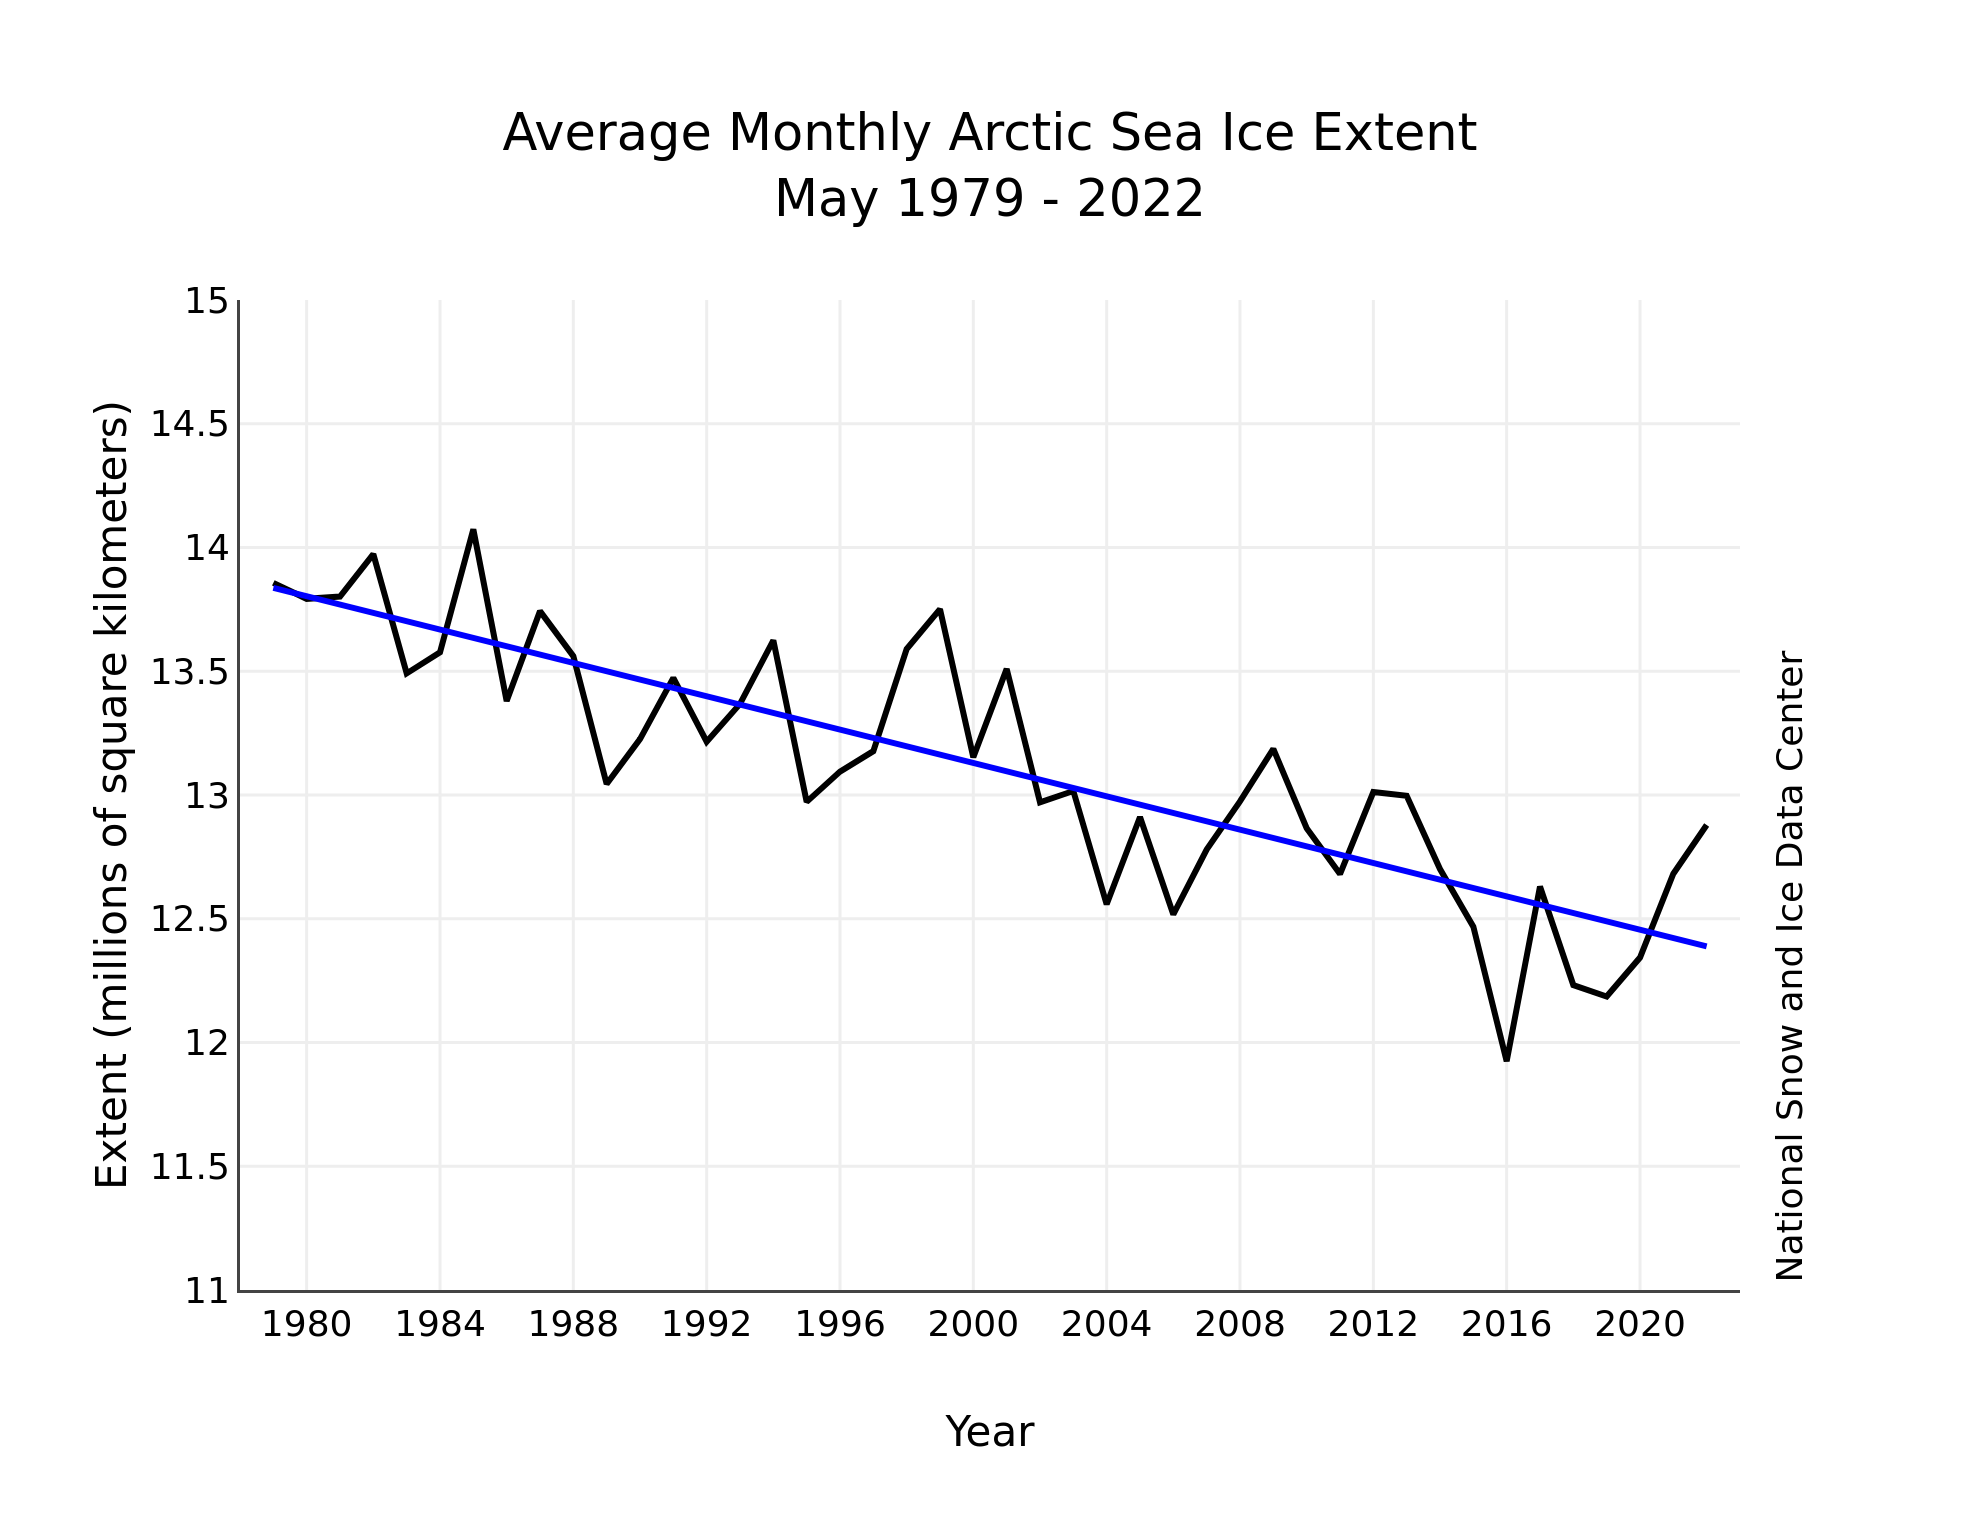
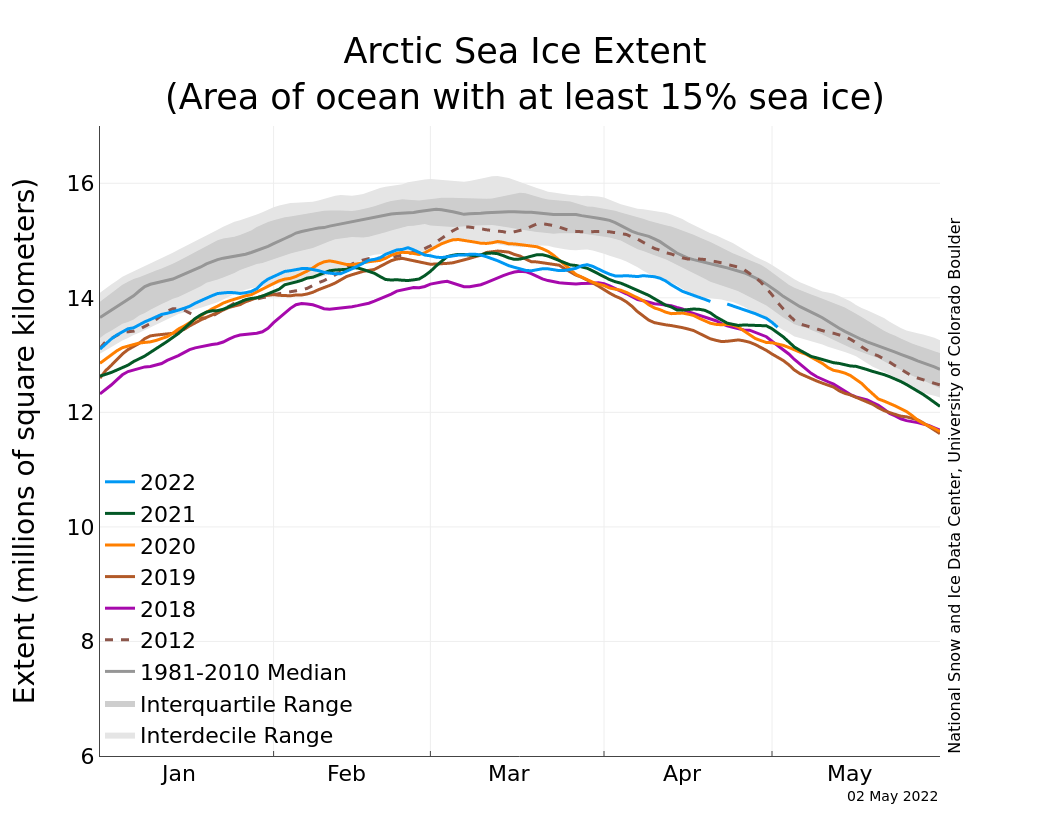
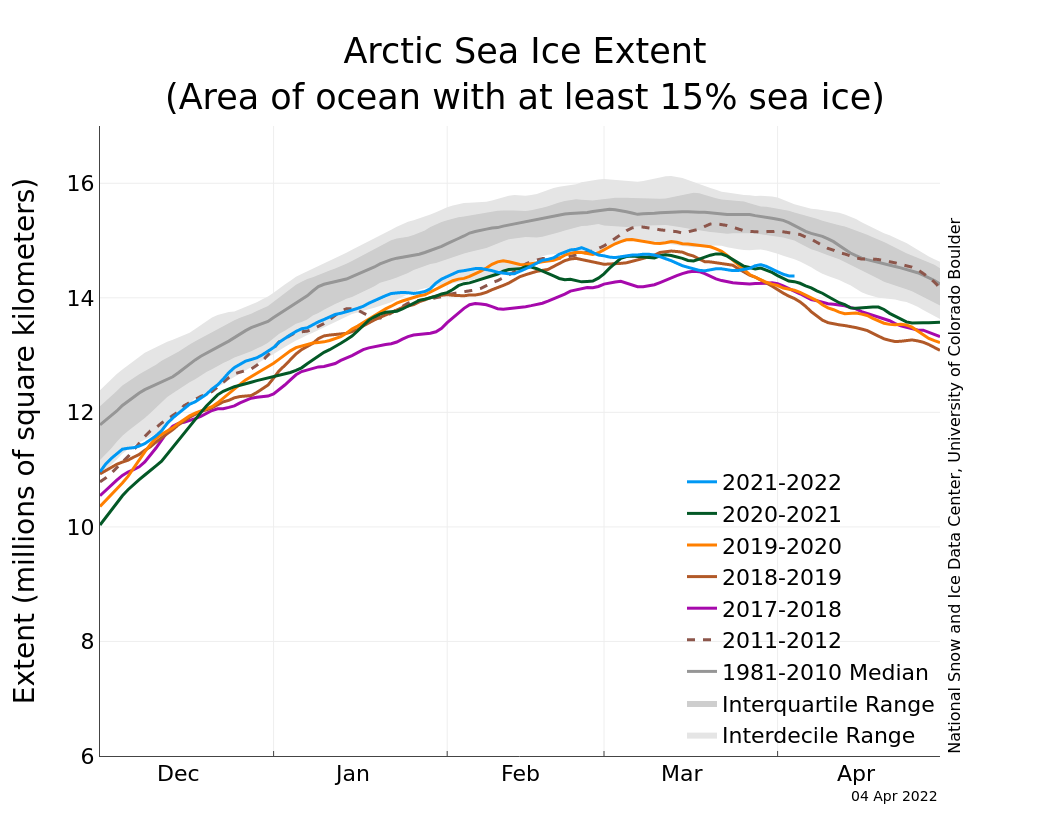
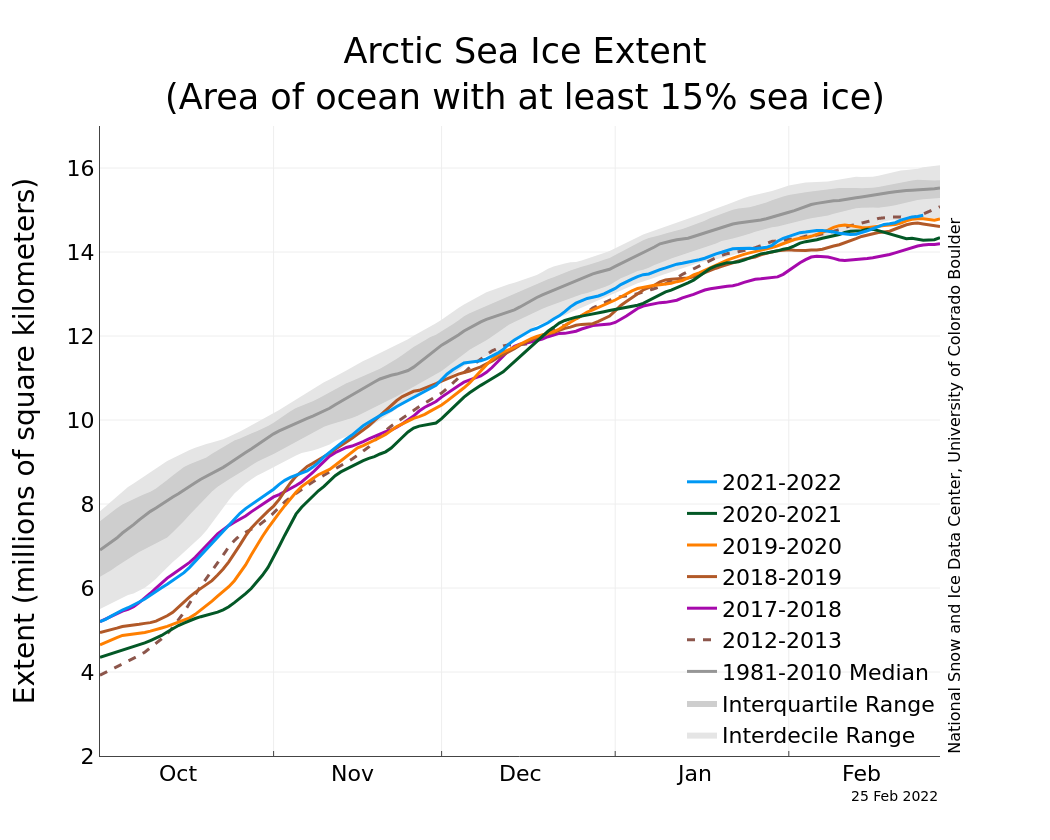
Figure 2a. The graph above shows Arctic sea ice extent as of September 19, 2022, along with daily ice extent data for four previous years and the record low year. 2022 is shown in blue, 2021 in green, 2020 in orange, 2019 in brown, 2018 in magenta, and 2012 in dashed brown. The 1981 to 2010 median is in dark gray. The gray areas around the median line show the interquartile and interdecile ranges of the data. Sea Ice Index data.
Credit: National Snow and Ice Data Center
High-resolution image
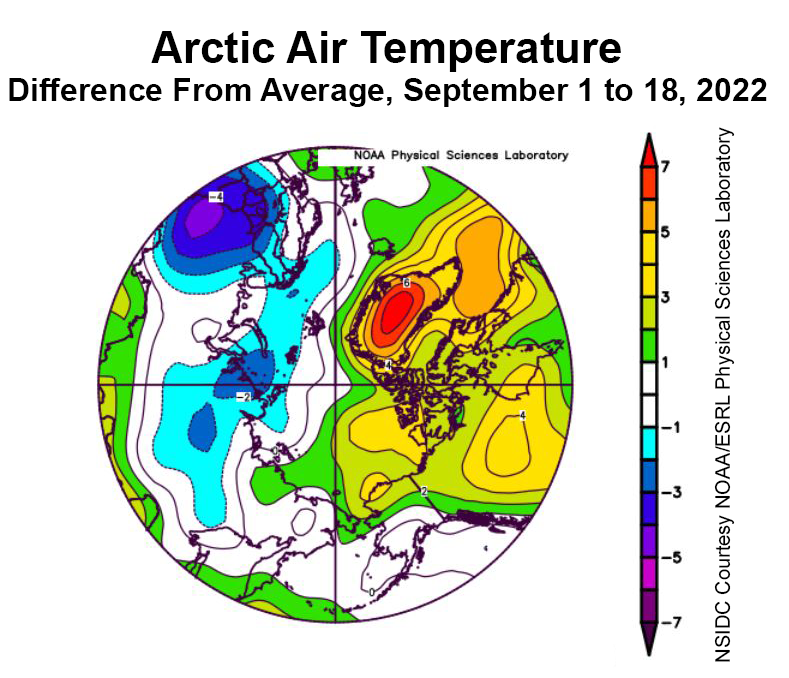
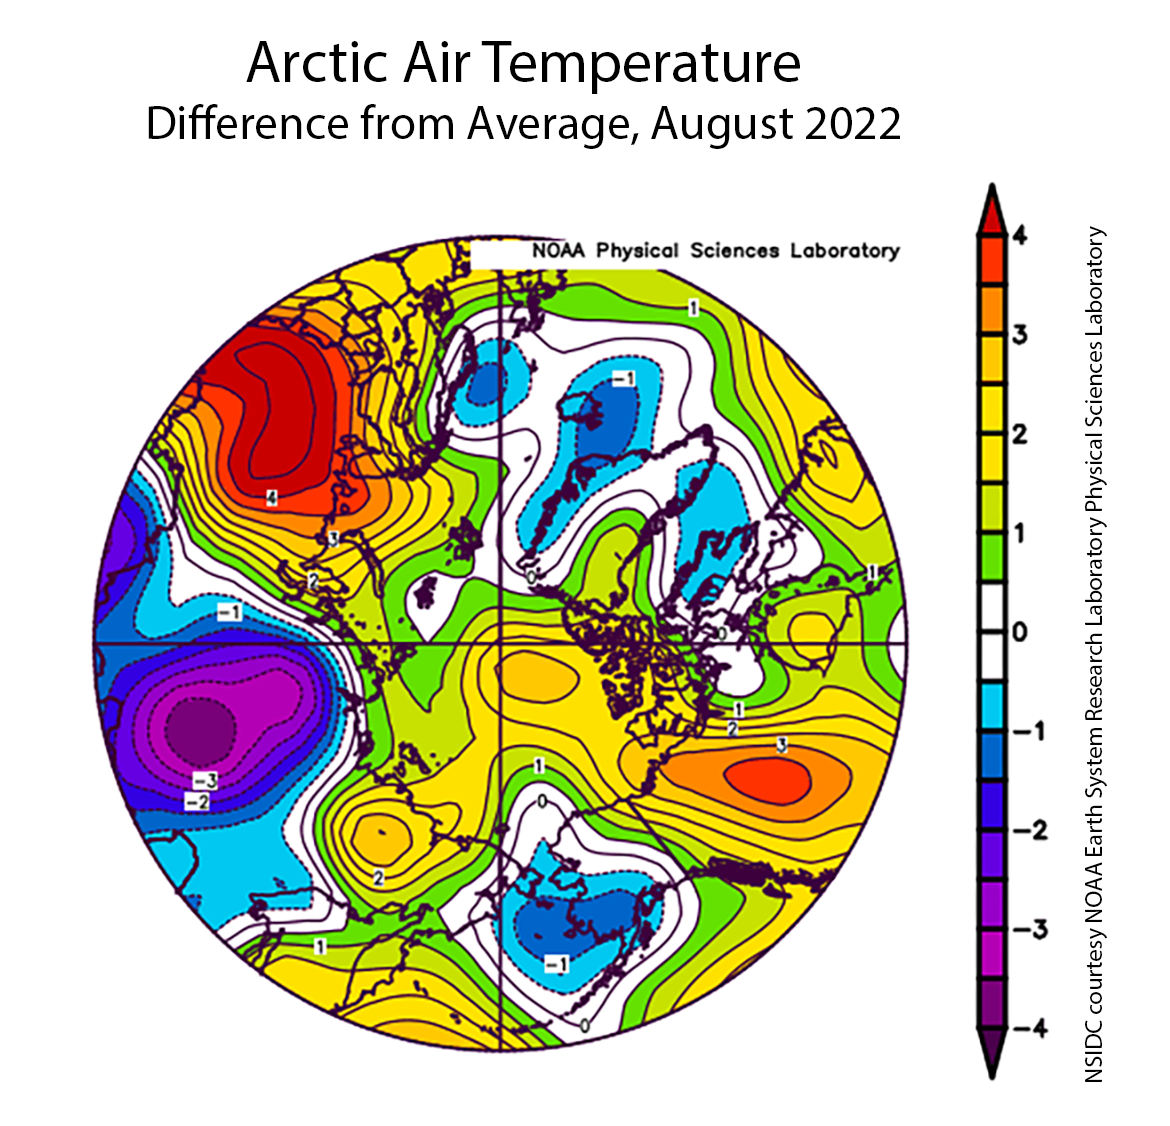
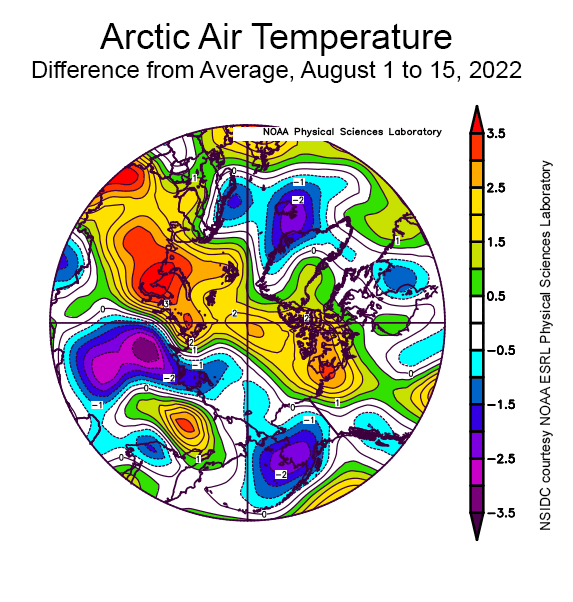
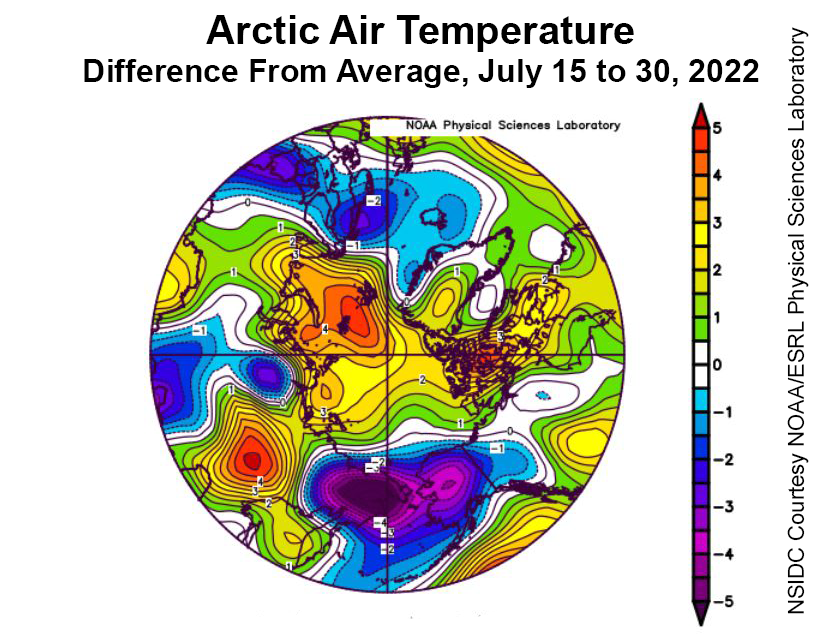
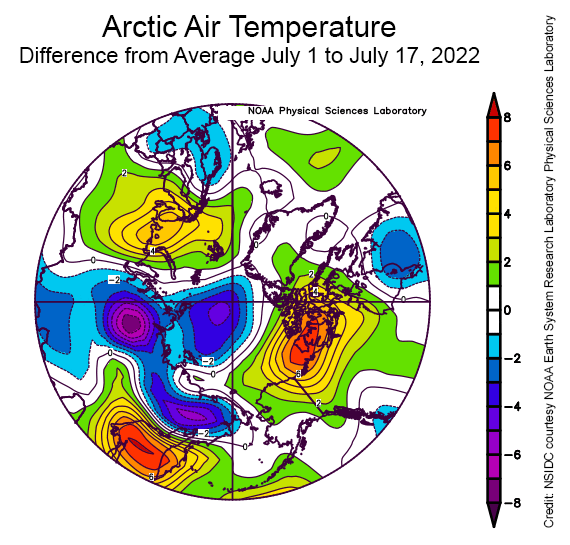
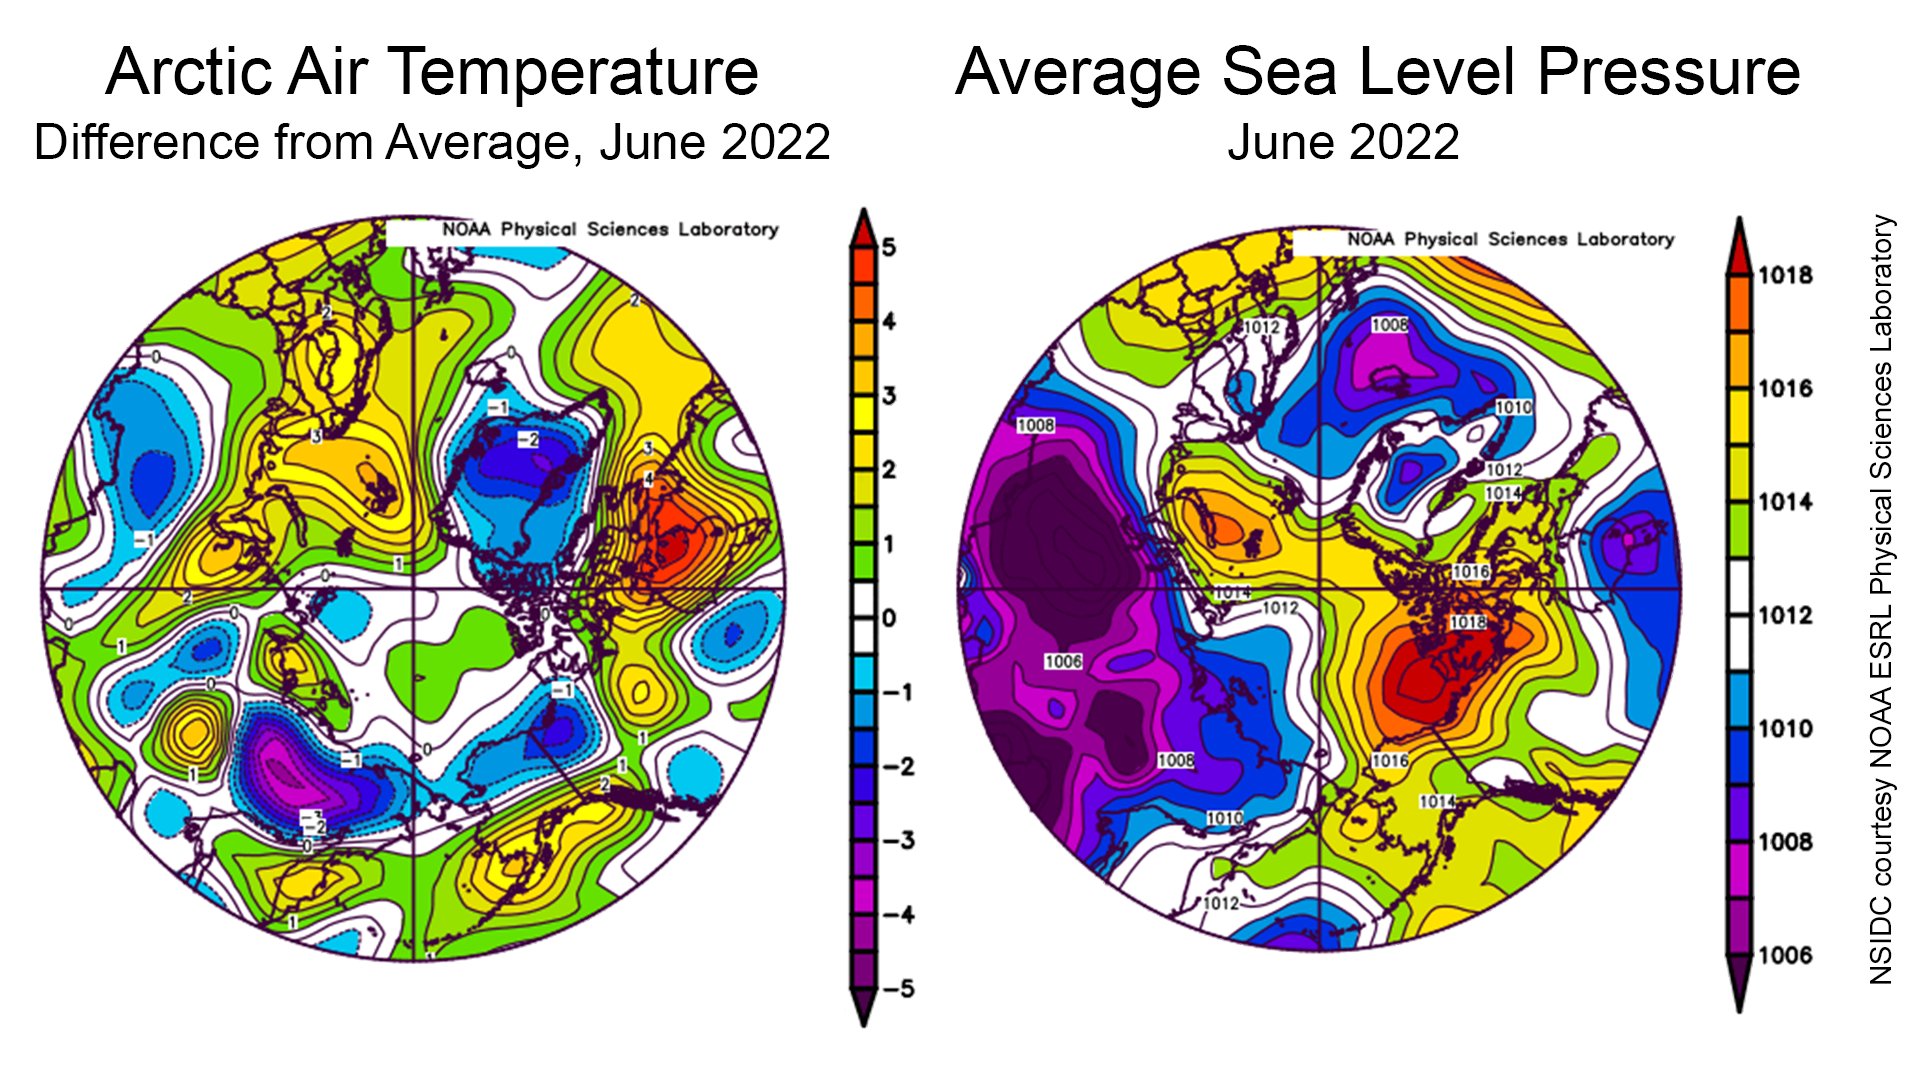
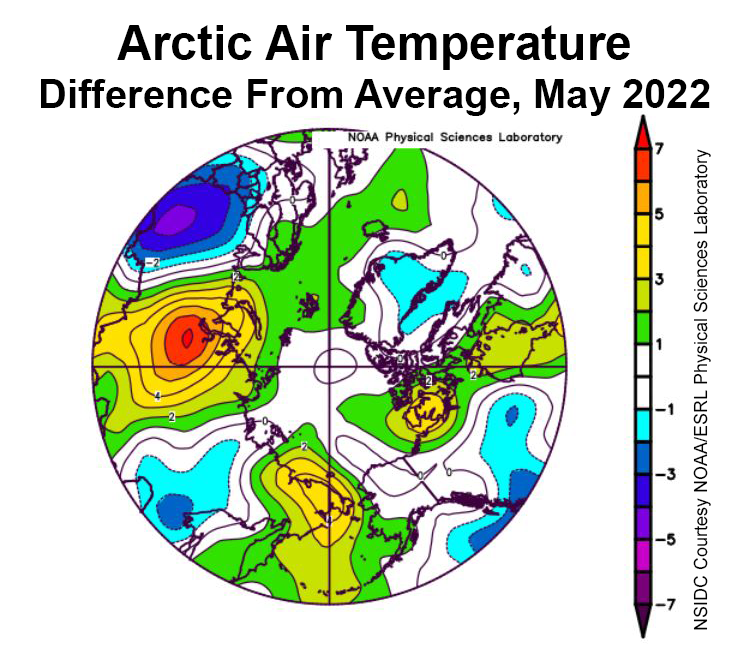
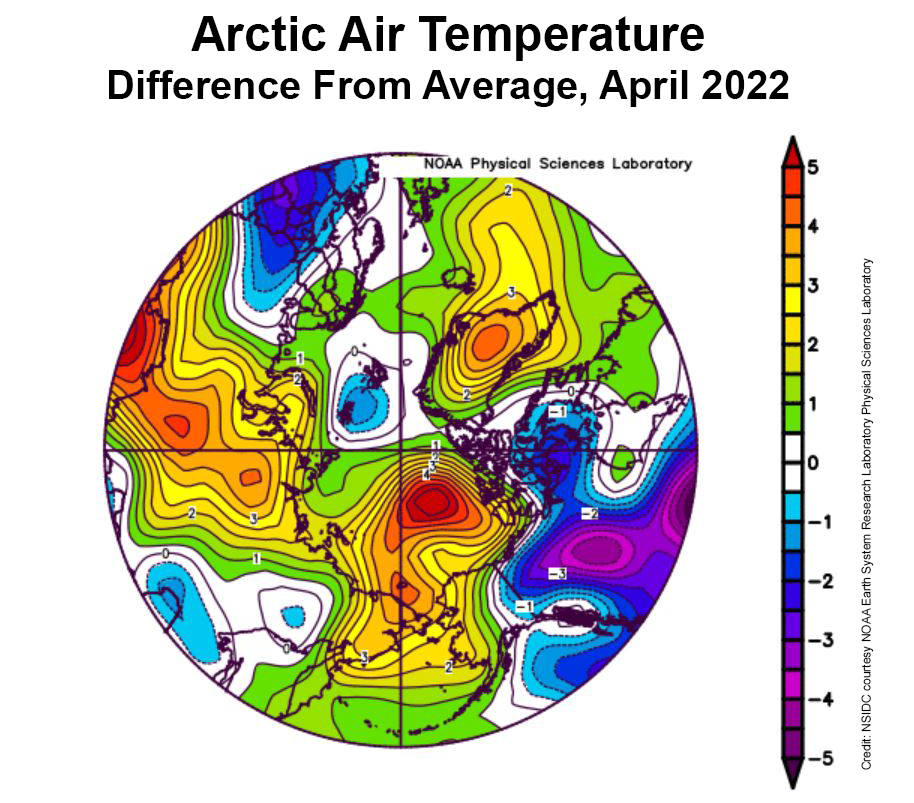
Figure 2b. This plot shows the departure from average air temperature in the Arctic at the 925 hPa level, in degrees Celsius, from September 1 to 18, 2022. Yellows and reds indicate higher than average temperatures; blues and purples indicate lower than average temperatures.
Credit: NSIDC courtesy NOAA Earth System Research Laboratory Physical Sciences Laboratory
High-resolution image
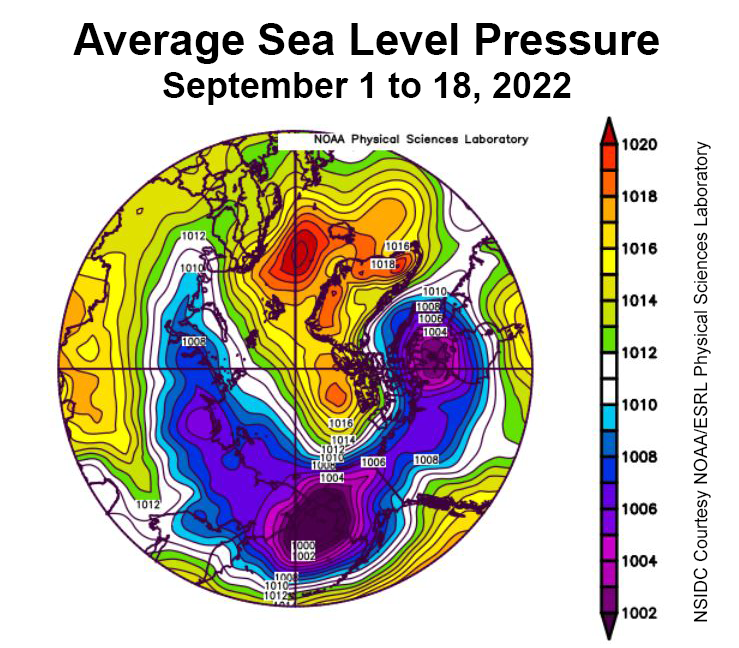
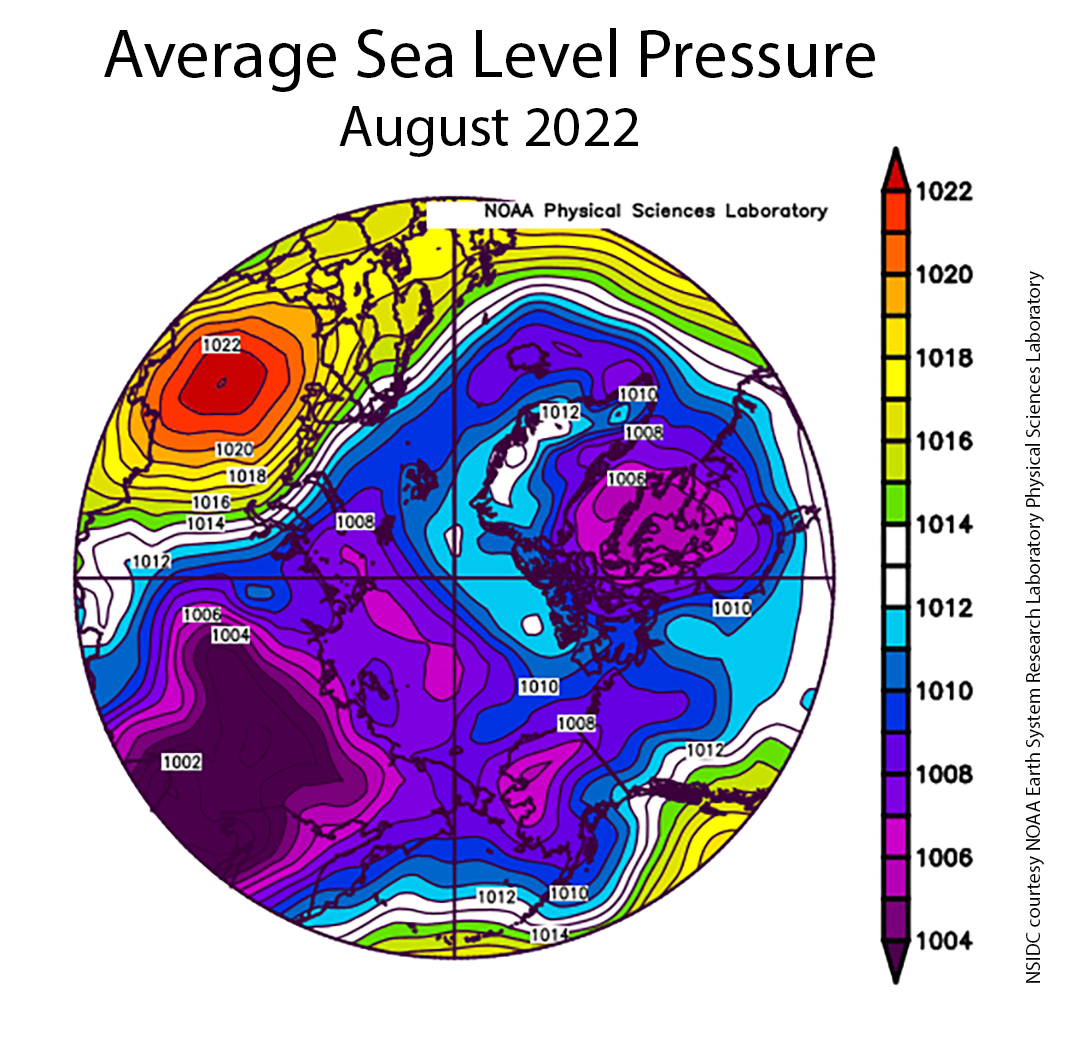
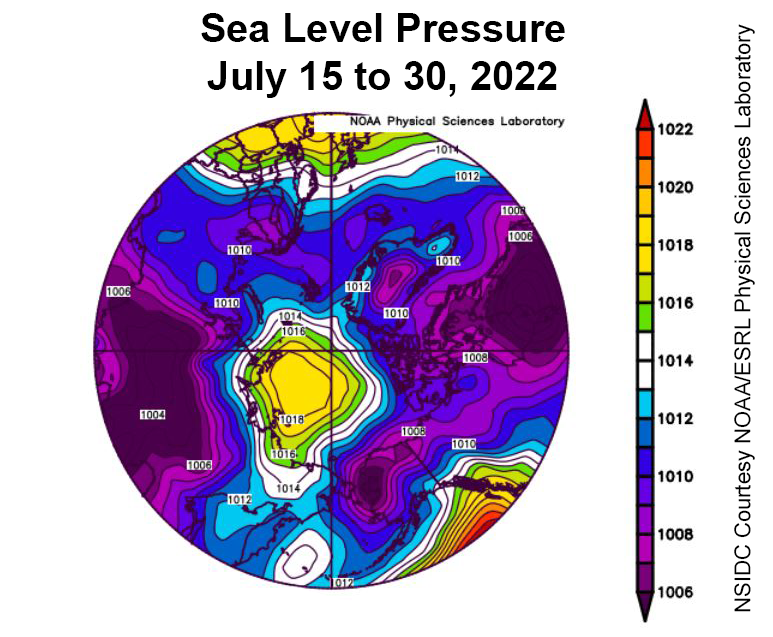
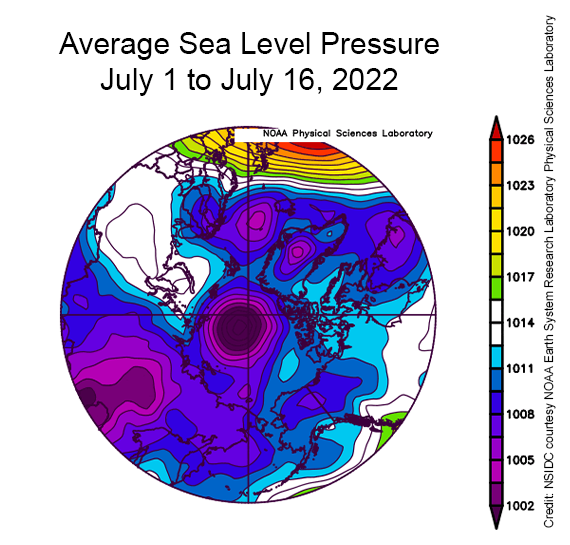
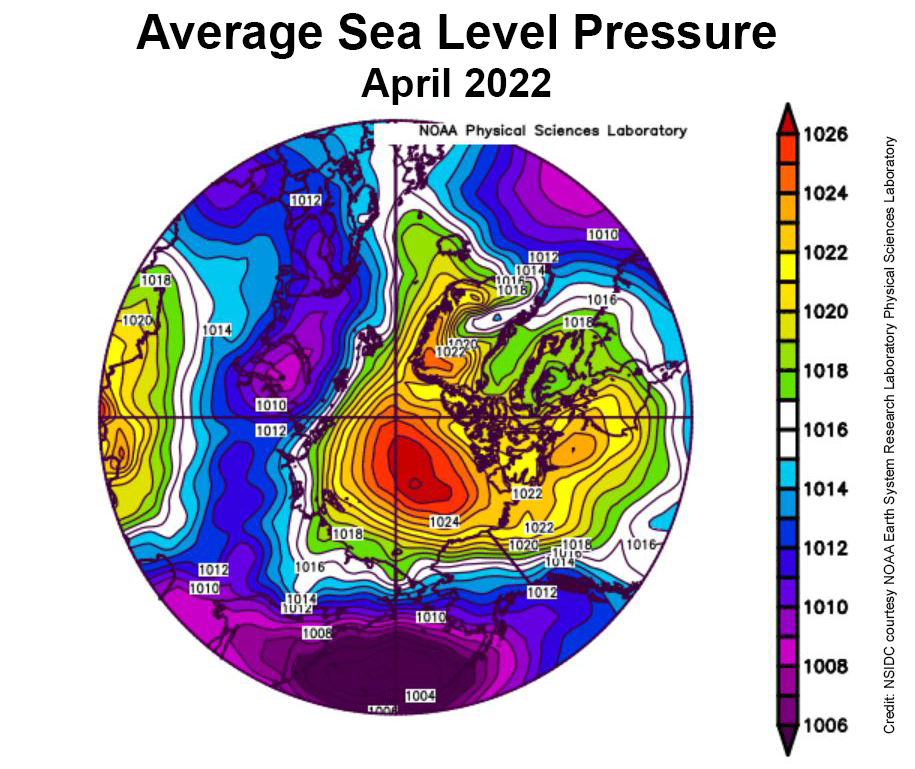
Figure 2c. This plot shows average sea level pressure in the Arctic in millibars from September 1 to 18, 2022. Yellows and reds indicate high air pressure; blues and purples indicate low pressure.
Credit: NSIDC courtesy NOAA Earth System Research Laboratory Physical Sciences Laboratory
High-resolution image
Air temperatures over the central Arctic Ocean at the 925 hPa level (about 2,500 feet above the surface), averaged from September 1 through September 18 were from 1 to 4 degrees Celsius (2 to 7 degrees Fahrenheit) above the 1991 to 2020 reference period over most of the North American side of the Arctic, but up to 7 degrees Celsius (13 degrees Fahrenheit) above average over the Greenland Ice Sheet (Figure 2b).
The sea level pressure pattern averaged over the same time period (Figure 2c) was dominated by low pressure extending eastward across Eurasia, Alaska, and into eastern Canada, contrasting with high pressure over the remainder of the Arctic, especially west of Scandinavia and over southern Greenland. The low pressure center over eastern Canada, paired with the high pressure over southern Greenland, has been a somewhat persistent pattern in the first half of September. Winds from the south between the pressure centers and the high average temperature over northern Greenland can be related to the prominent early September melt event over the ice sheet (see Greenland Ice Sheet Today).
A surprising observation
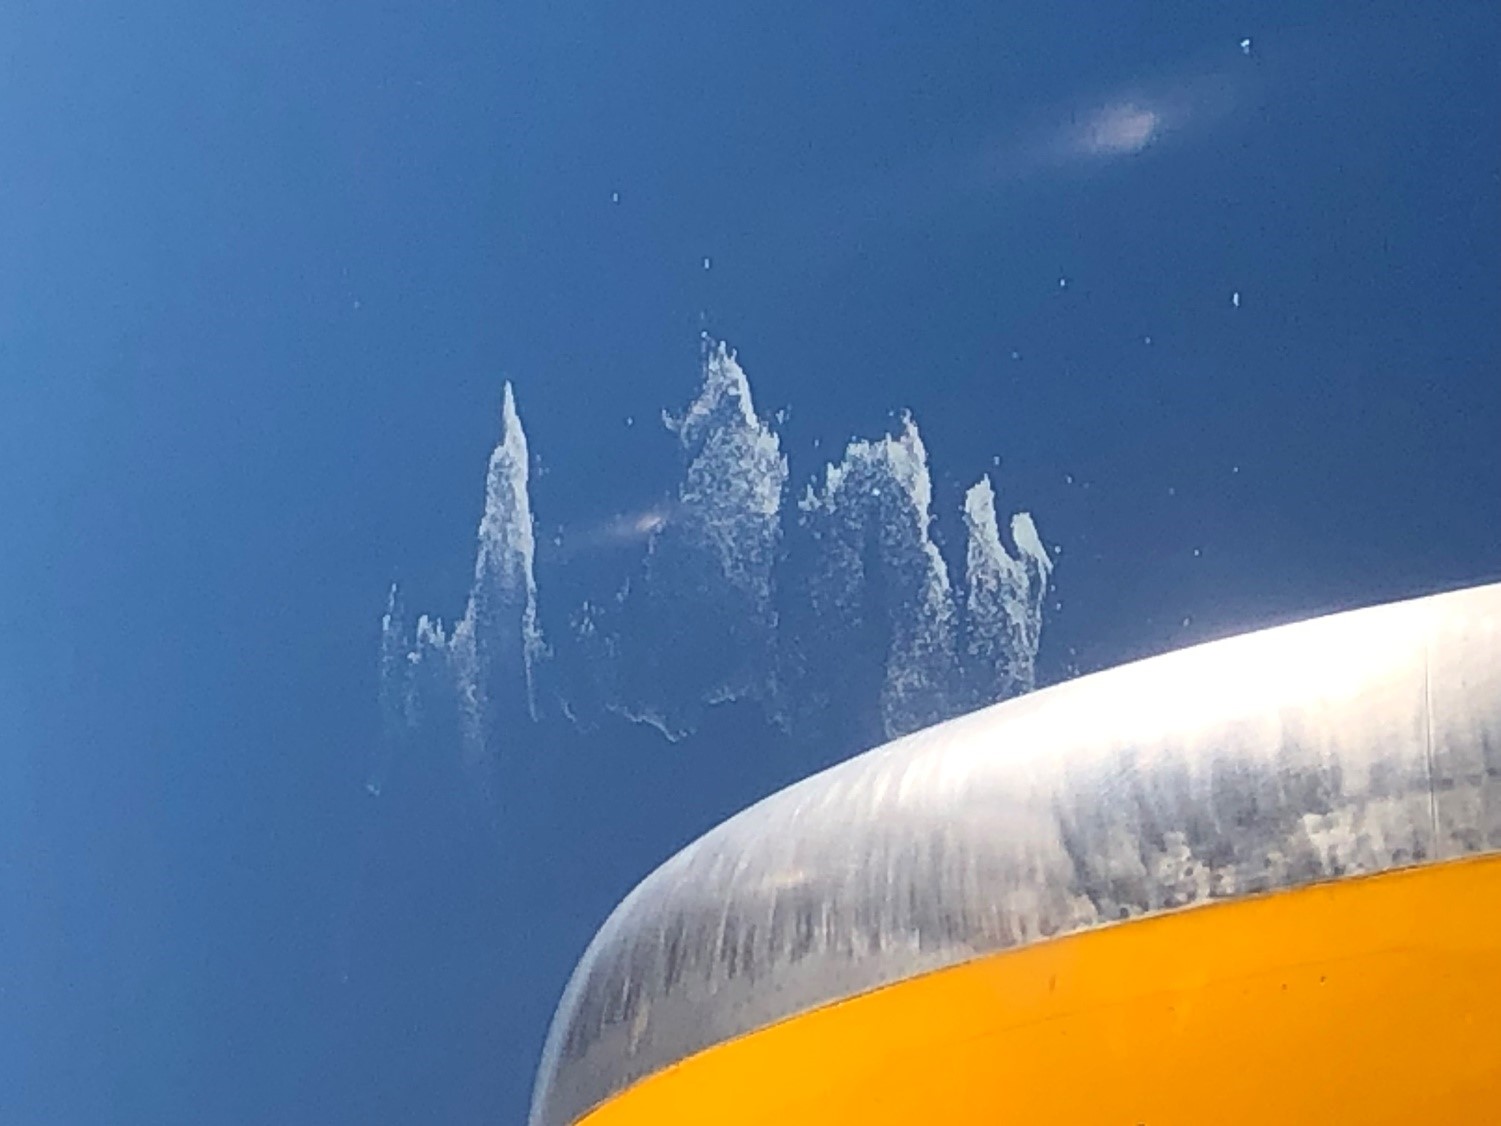
Figure 3. While traveling back from Reykjavik, Iceland, in late August, Arctic Sea Ice News & Analysis contributor Mark Serreze observed a patch of sea ice just off the eastern coast of southern Baffin Island. Small, diffuse patches of sea ice can linger through the summer if conditions are favorable, but they are difficult to detect in satellite imagery.
Credit: Mark Serreze, NSIDC
High-resolution image
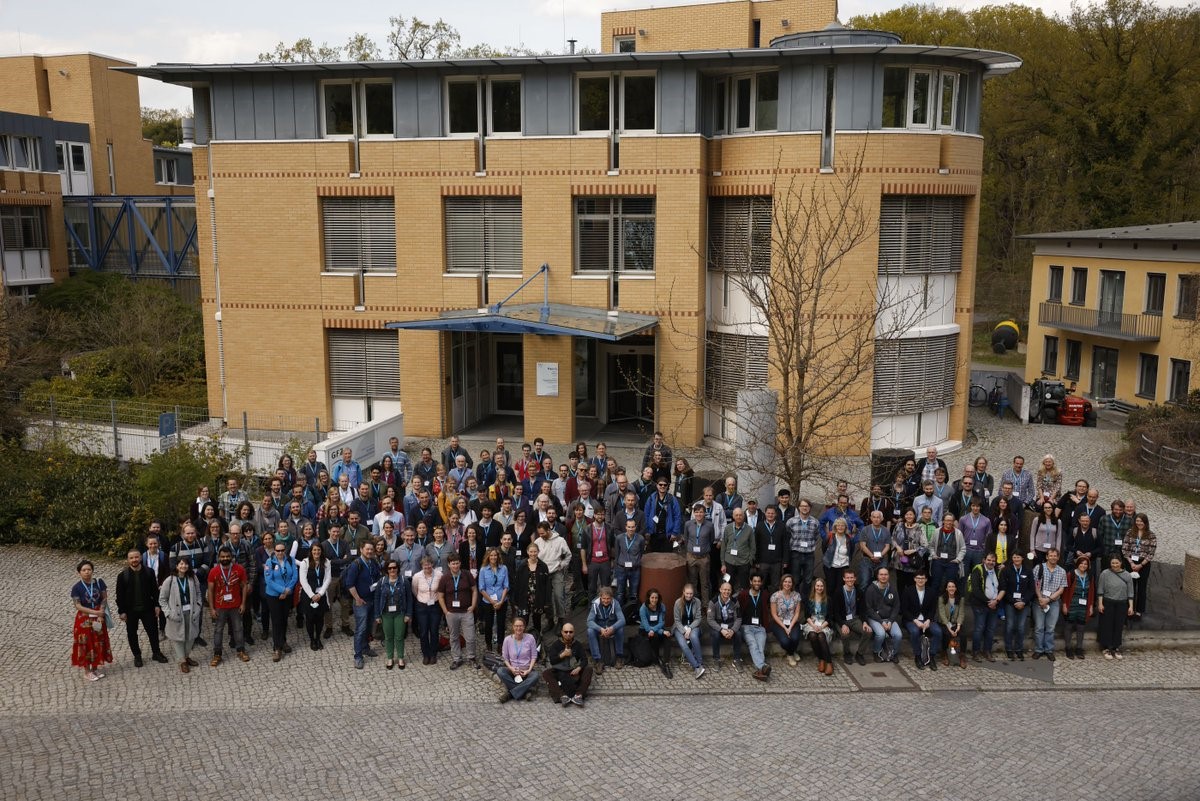
While traveling back from the International Glaciological Society International Symposium on Ice, Snow and Water in a Warming World in Reykjavik, Iceland, in late August, Arctic Sea Ice News & Analysis contributor Mark Serreze, while looking for icebergs on the blue ocean out the window of the Iceland Air 757, observed a rather surprising patch of sea ice just off the eastern coast of southern Baffin Island. Such small, diffuse patches—the last remnants of the winter ice pack—can linger through the summer if conditions are favorable, but they are very difficult to detect in satellite imagery.
Arctic sea ice thickness study
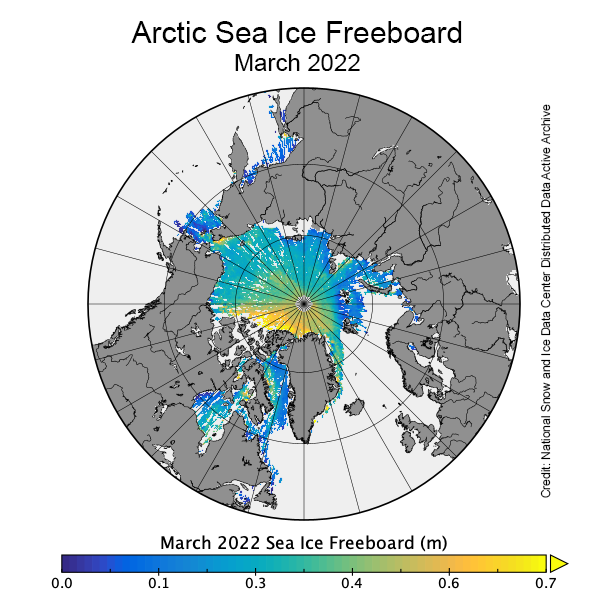
Figure 4. This animation shows Arctic sea ice thickness from October 2010 to July 2020. Images are from the European Space Agency’s CryoSat-2, which for the first time include summer sea ice thickness.
Credit: Jack Landy
High-resolution image
A new year-round Arctic sea ice thickness dataset based on observations from the European Space Agency CryoSat-2 mission was released this week. Meltwater ponds accumulating at the ice surface previously prevented researchers from generating valid sea ice thickness data from CryoSat-2 during the summer melt season. Only estimates of sea ice thickness during the Arctic winter growth season were available.
New methods, including deep machine learning and model simulations of the satellite radar altimeter, have now enabled accurate measurements of the sea ice freeboard— the height of the ice above the ocean surface—to be obtained from the archive of CryoSat-2 Arctic summer observations dating back to 2011 (Figure 4, to animate). By accounting for snow that weighs down the sea ice, using data from a snow evolution model available at the NASA National Snow and Ice Data Center Distributed Active Archive Center, the ice freeboards for winter and summer months were converted to a 10-year gap-free sea ice thickness record.
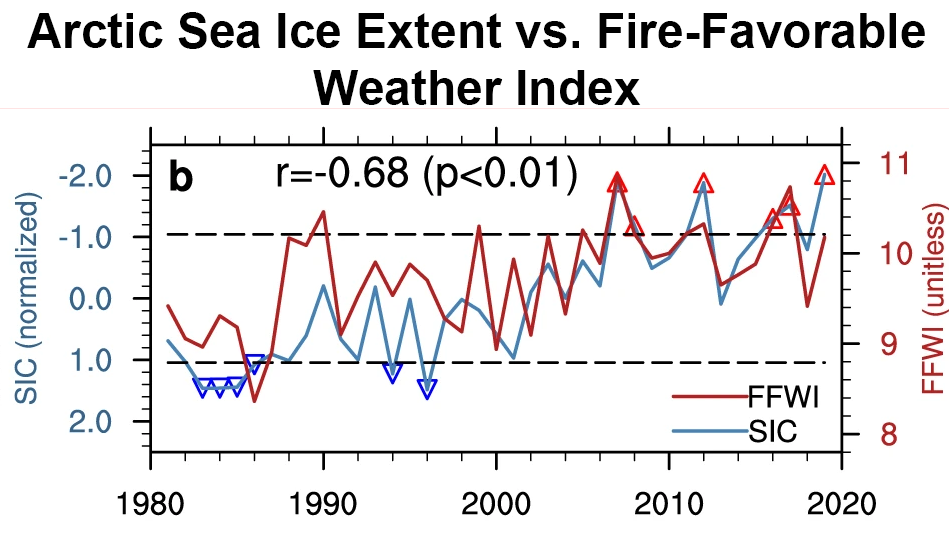
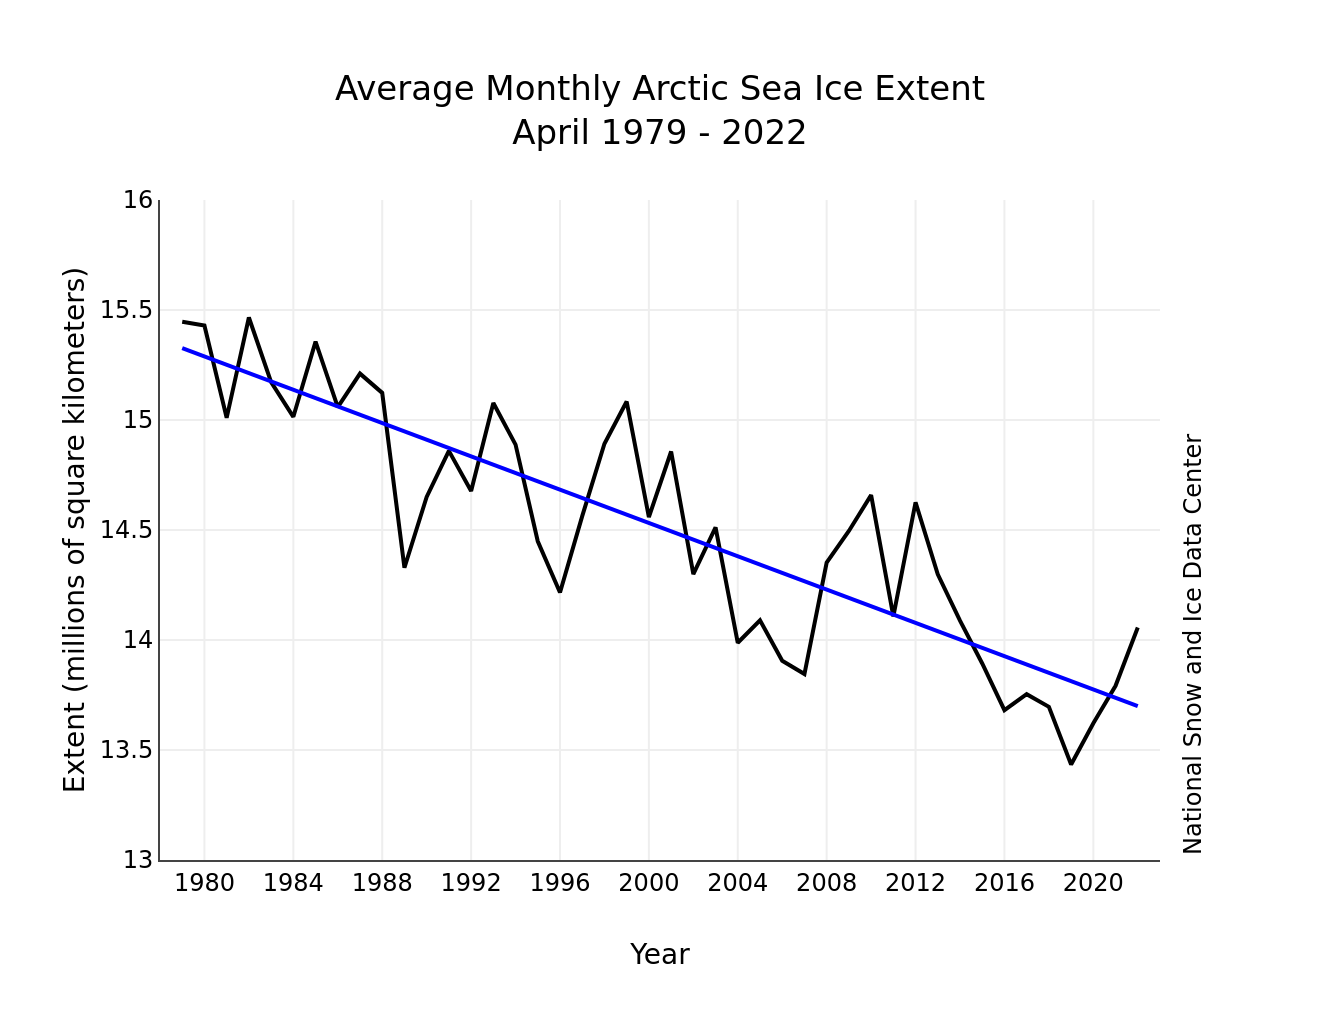
In the study, it was discovered that new CryoSat-2 sea ice thickness observations from the early summer, in May and June, correlate closely with the pan-Arctic sea ice extent in the following September. Through the ice-albedo feedback, the thickness of sea ice floes at the start of the melt season dictate how long they survive during summer. Thick ice floes melt less quickly and can survive for longer, whereas thin ice floes melt away, exposing the darker ocean and accelerating further melt. This demonstrates a strong link between spring sea ice thickness and the end-of-summer sea ice extent.
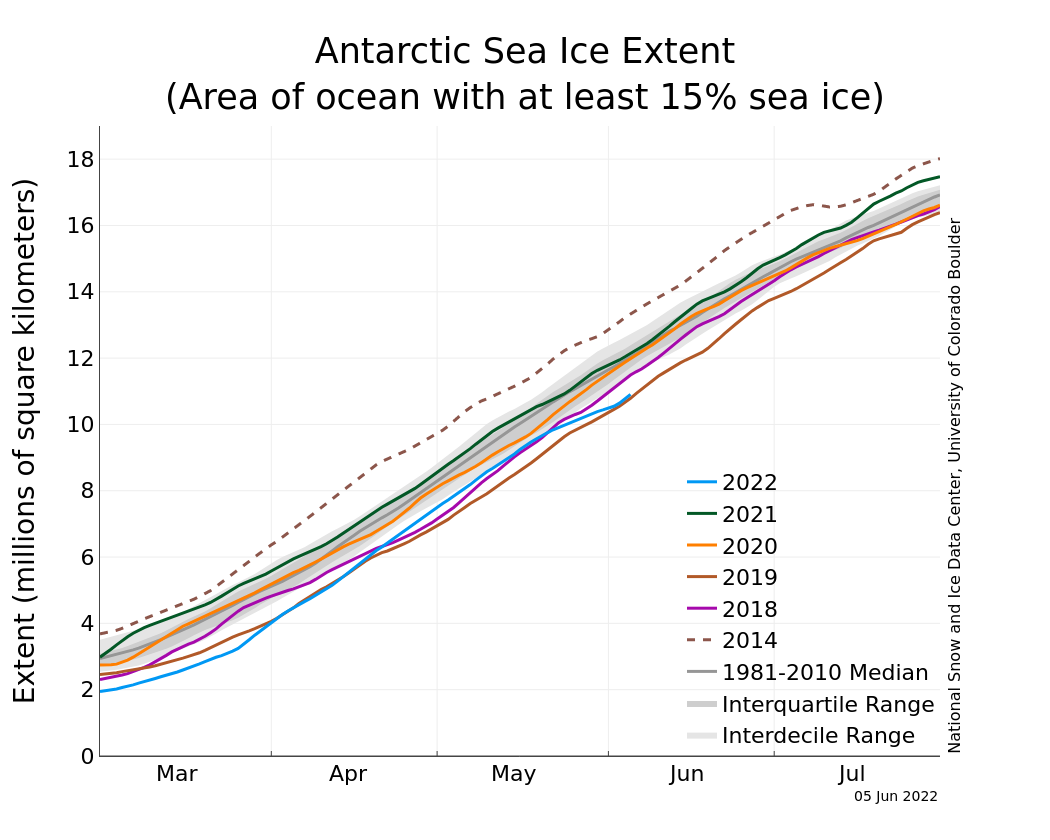
Antarctic recovery
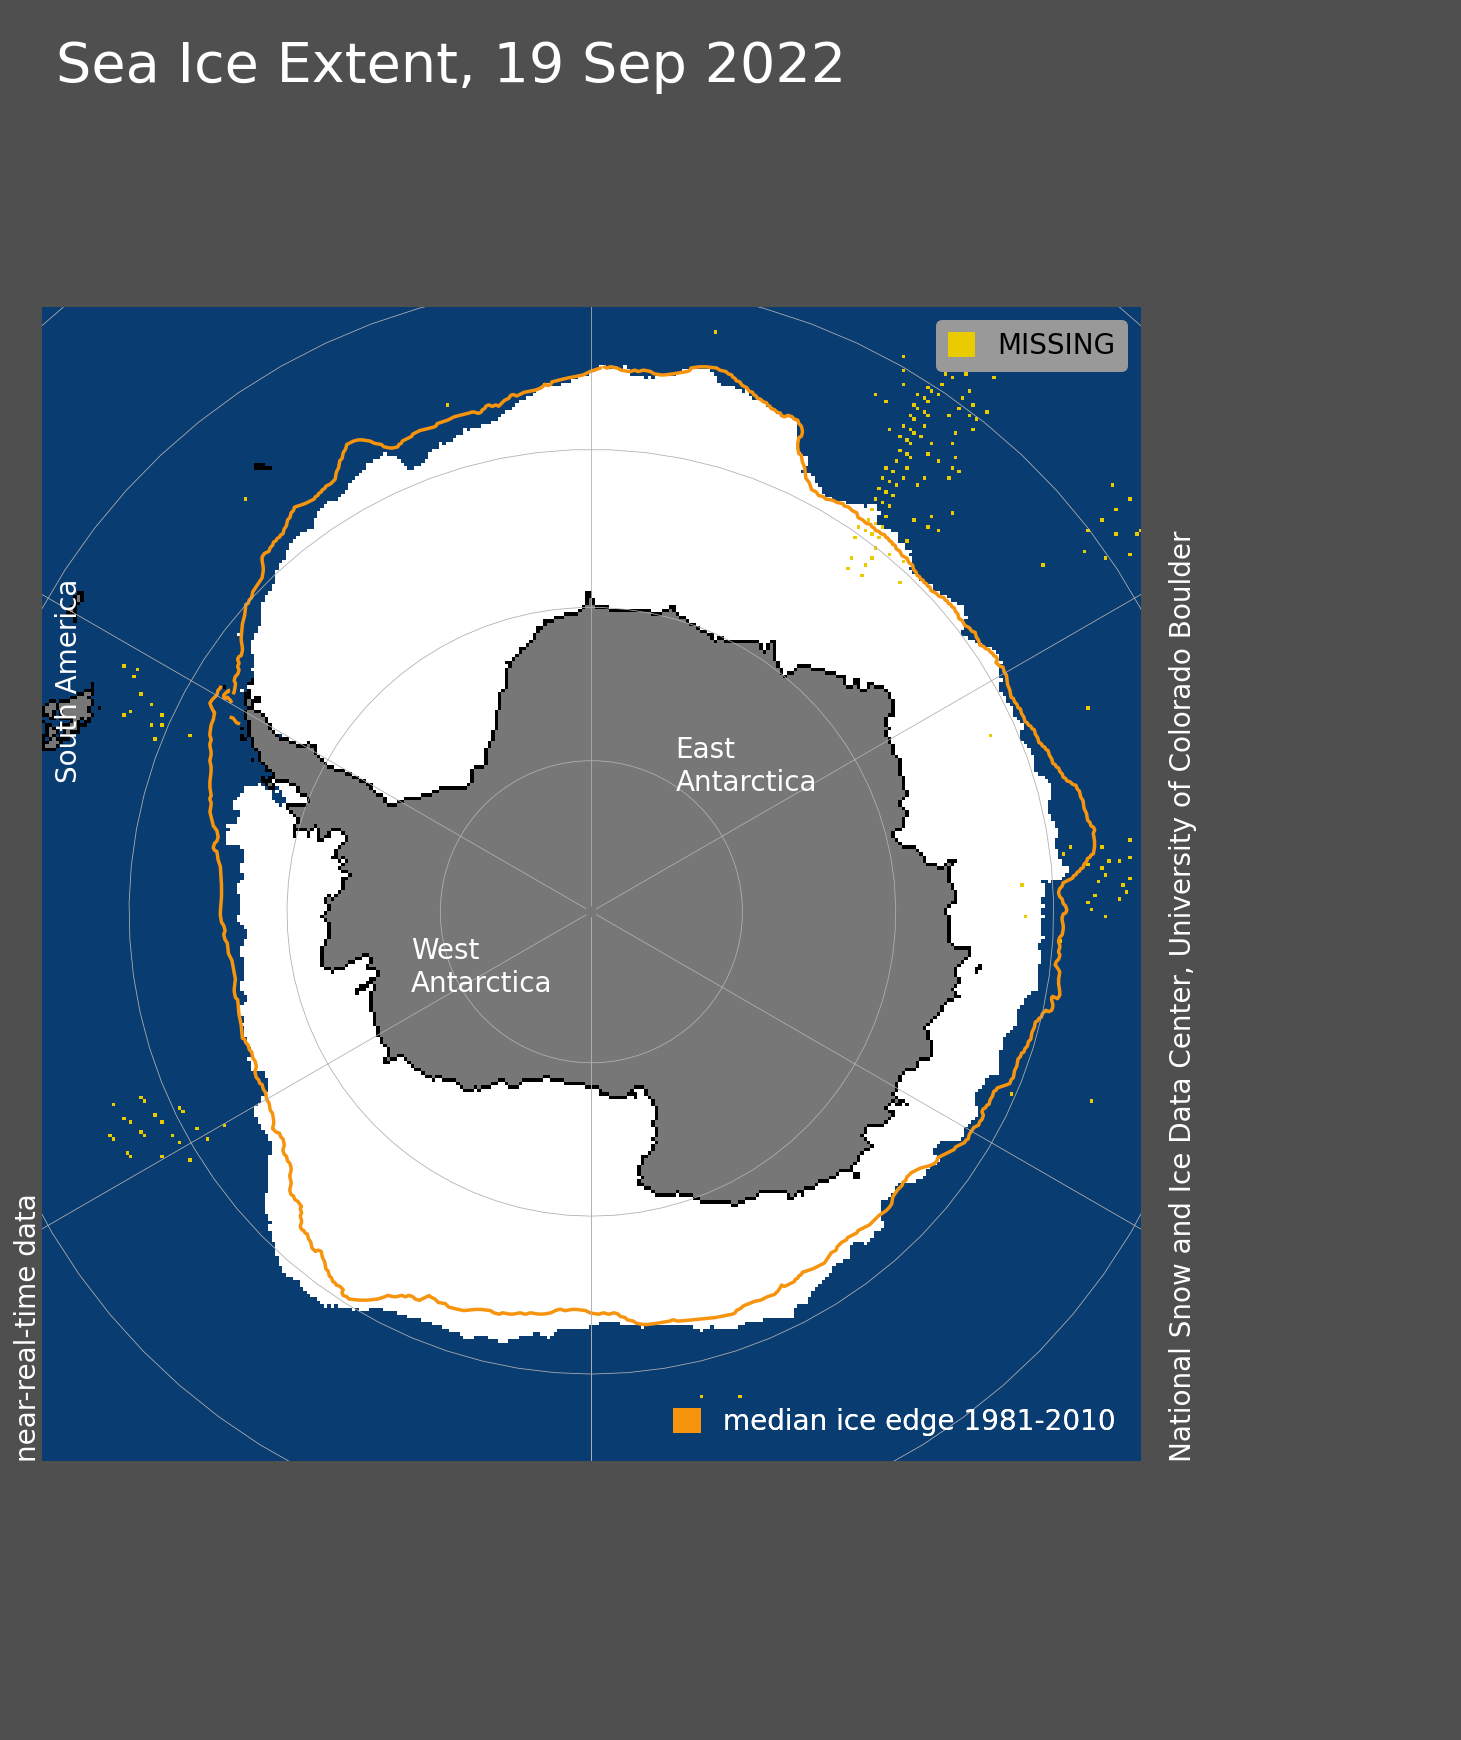
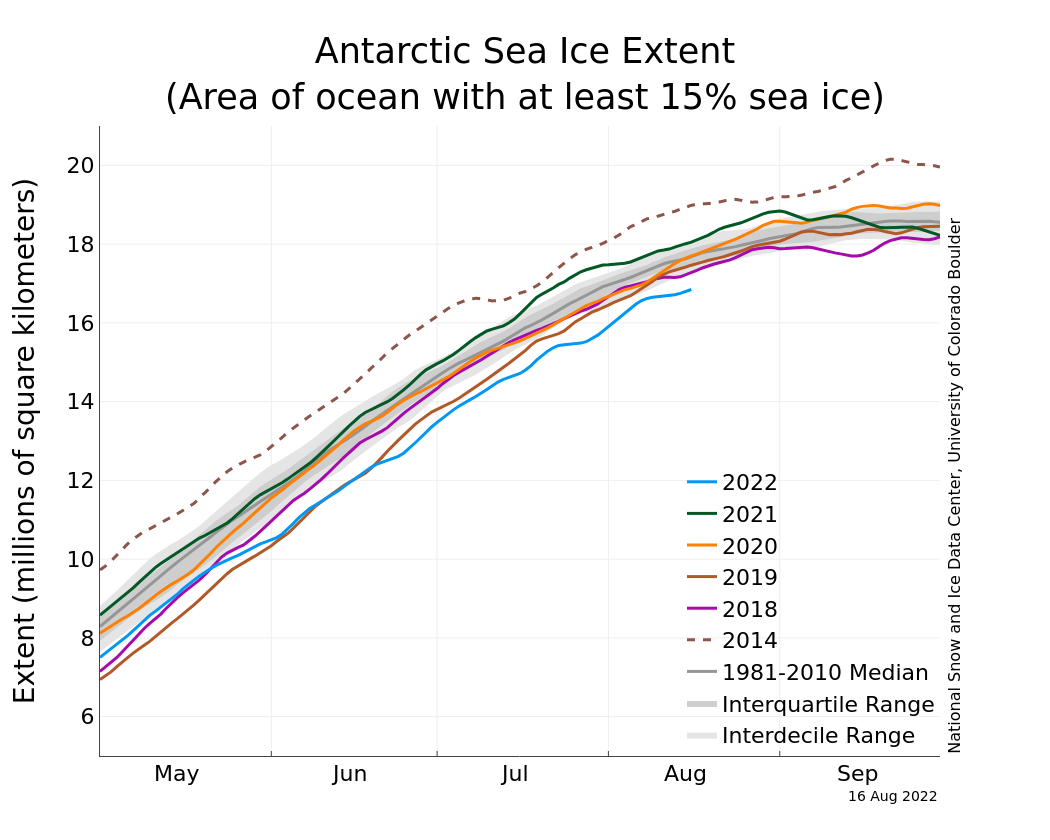
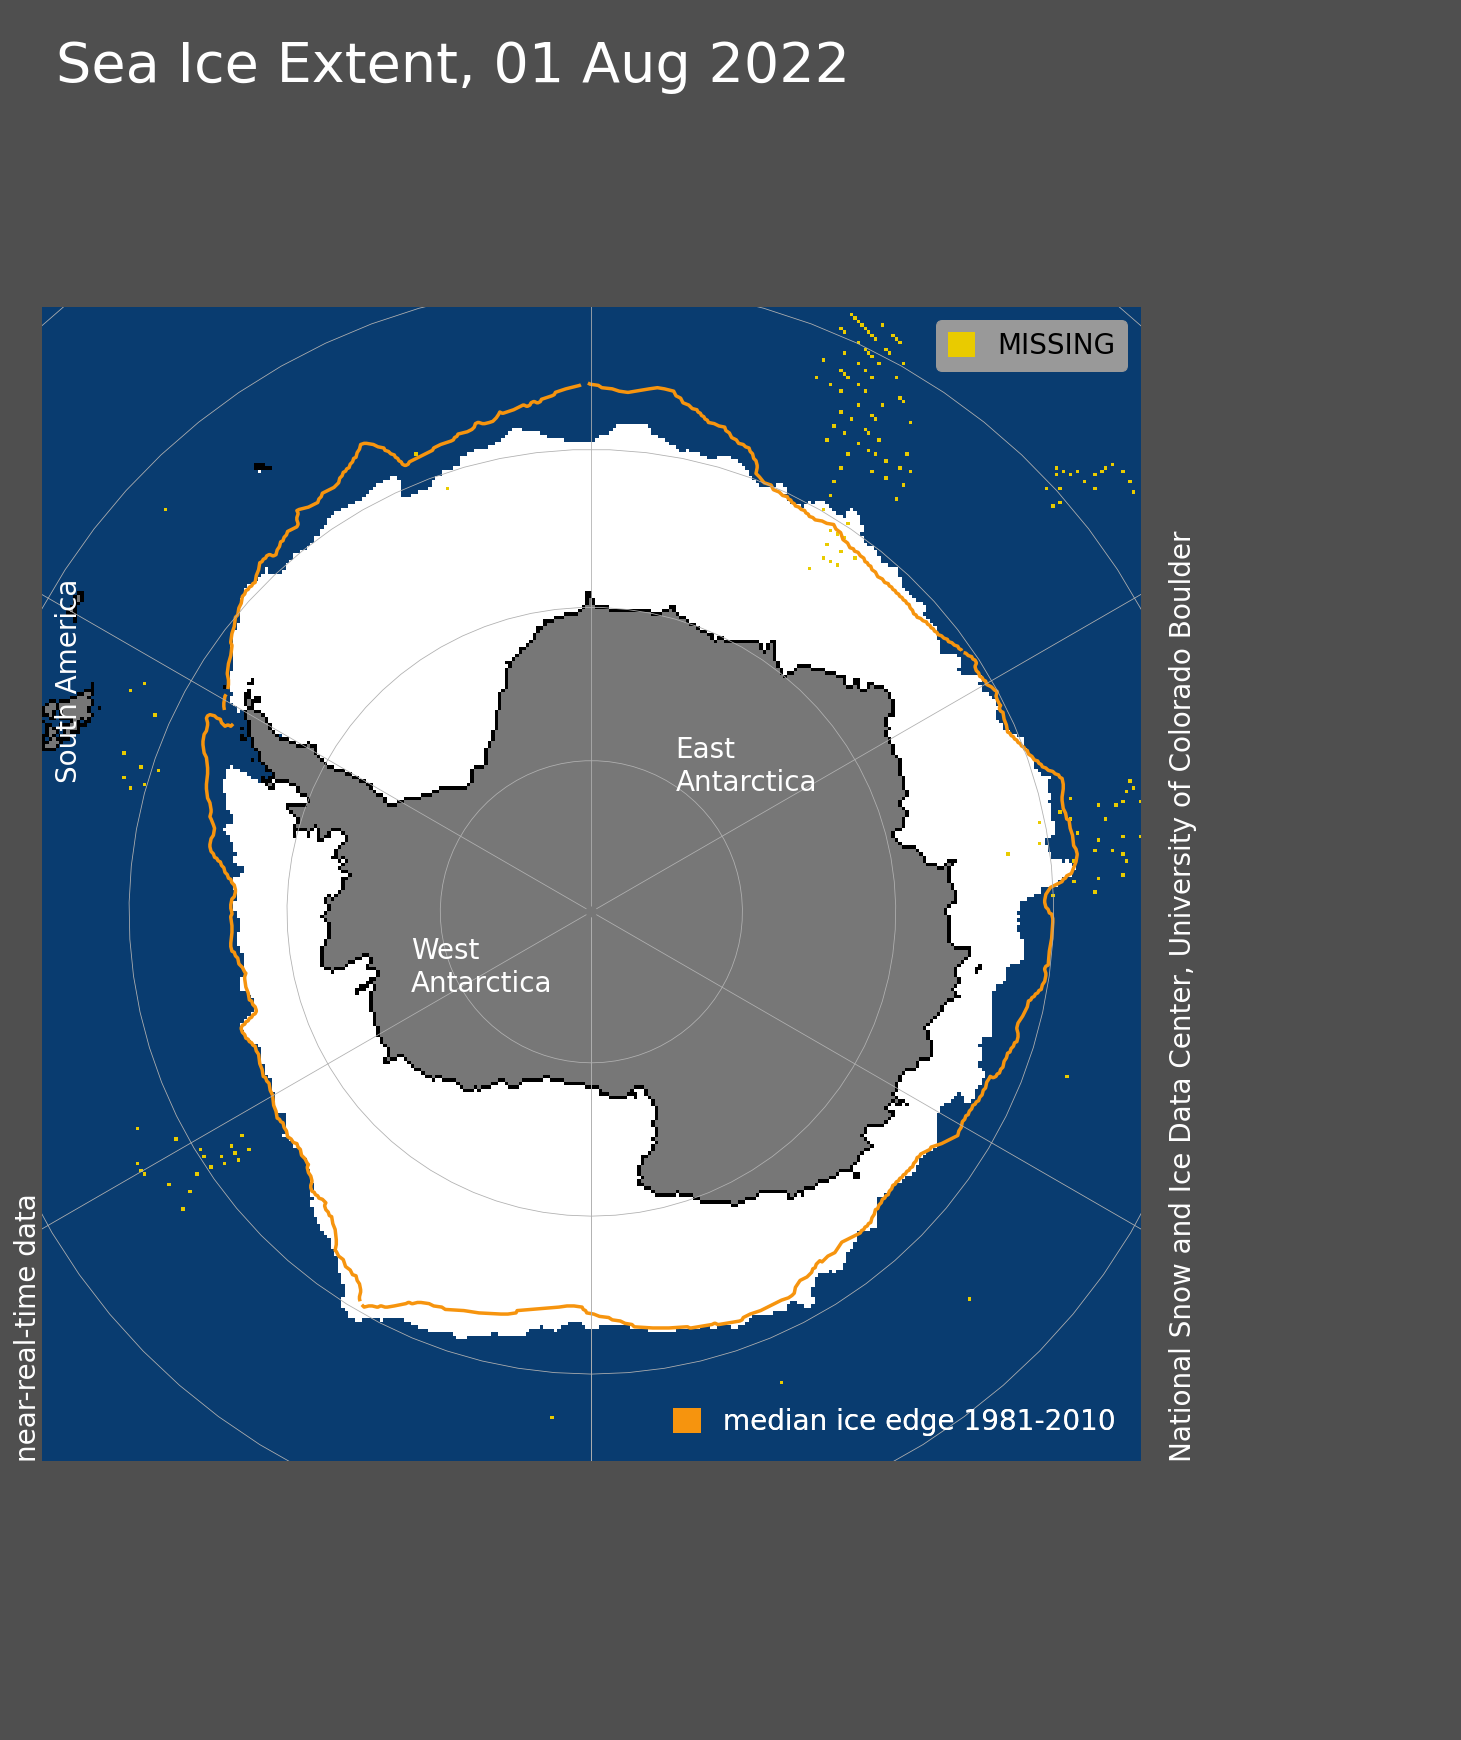
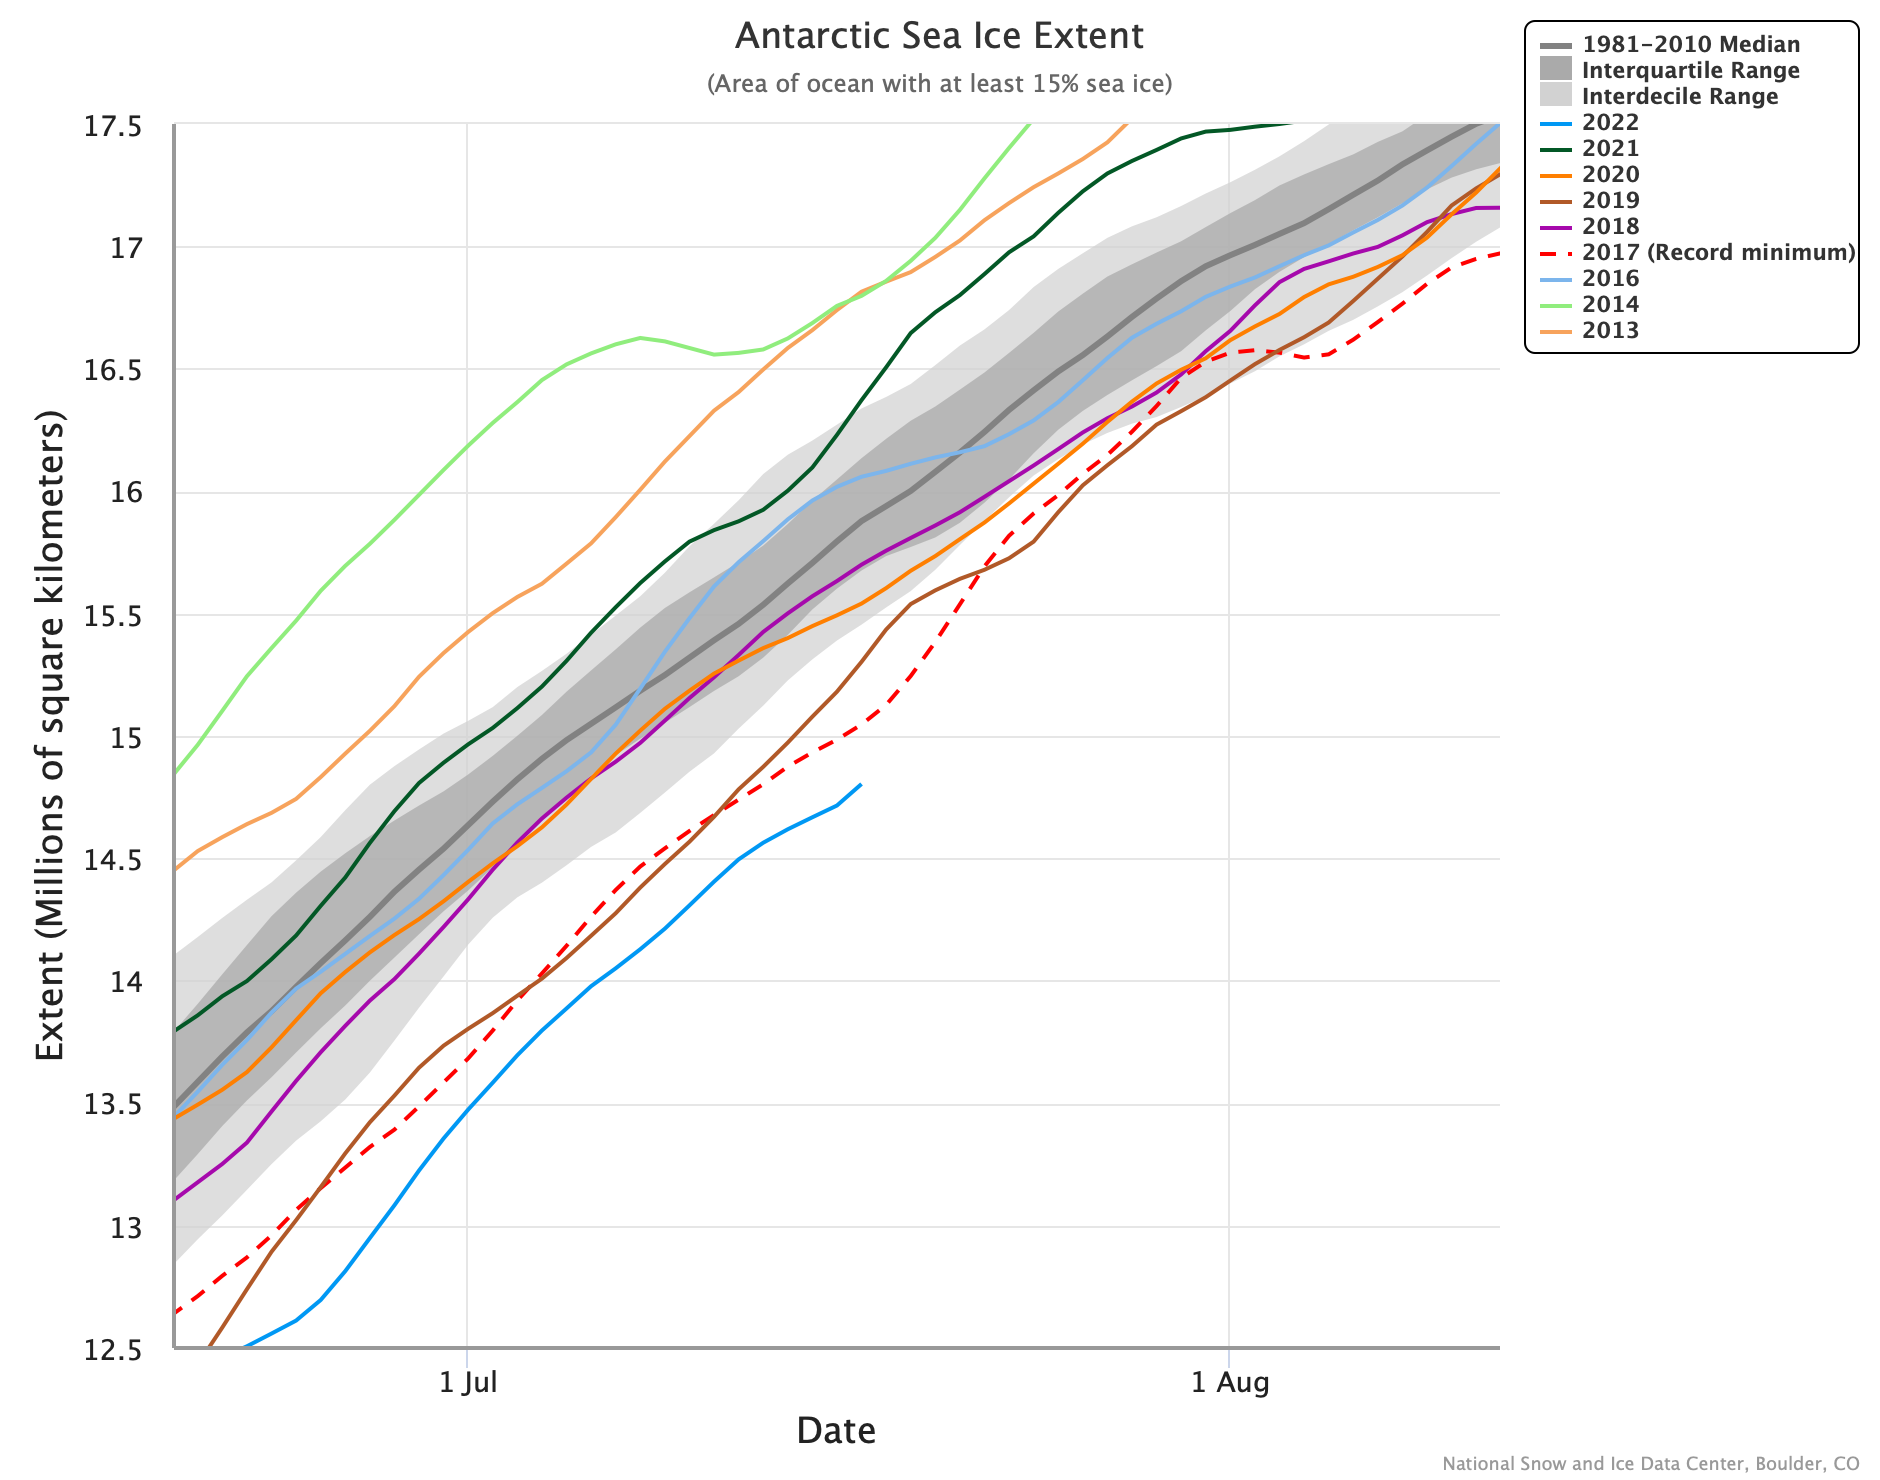
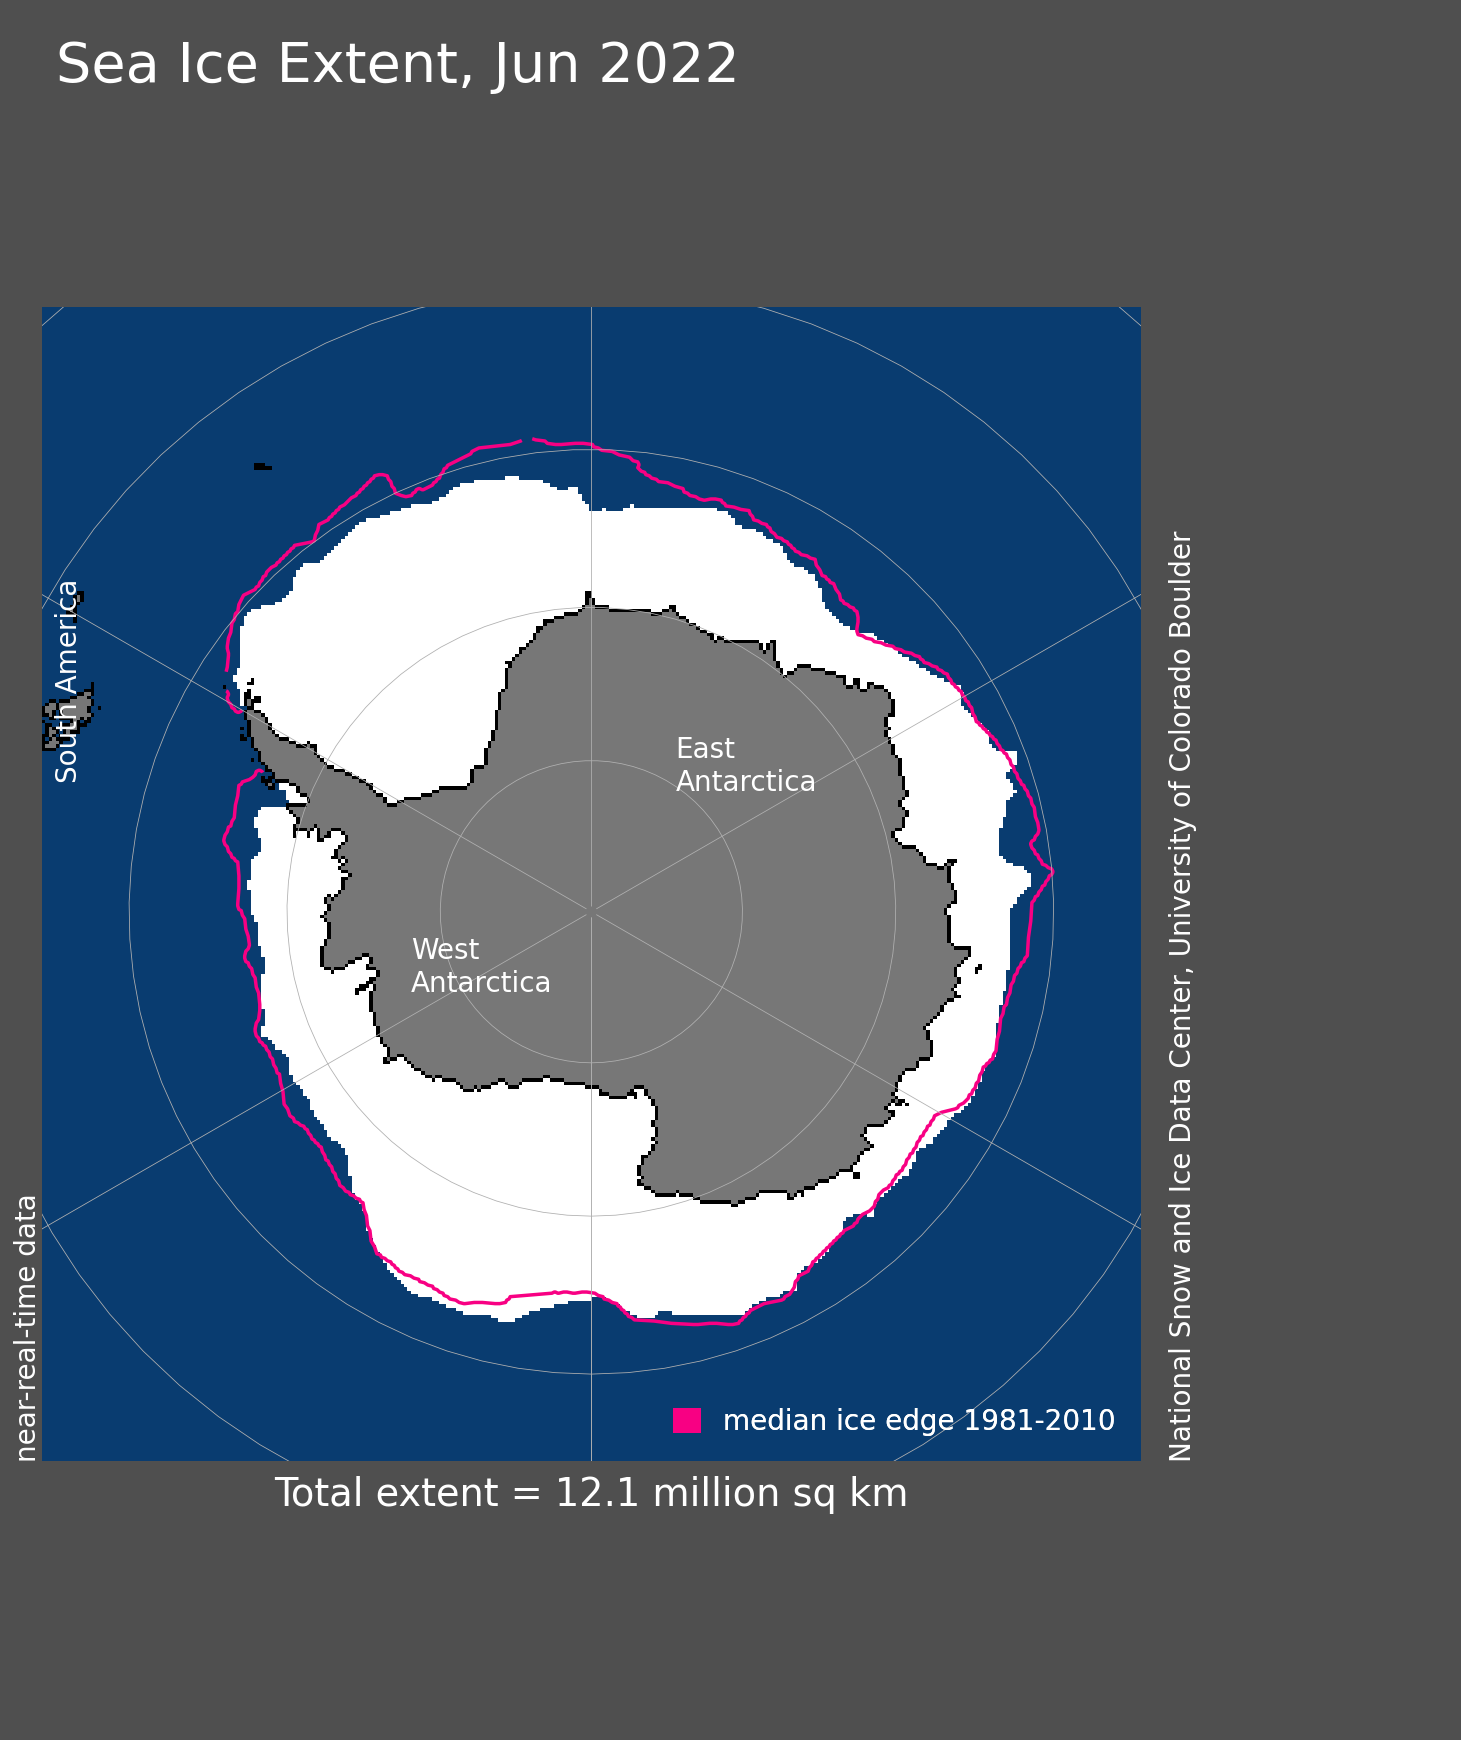
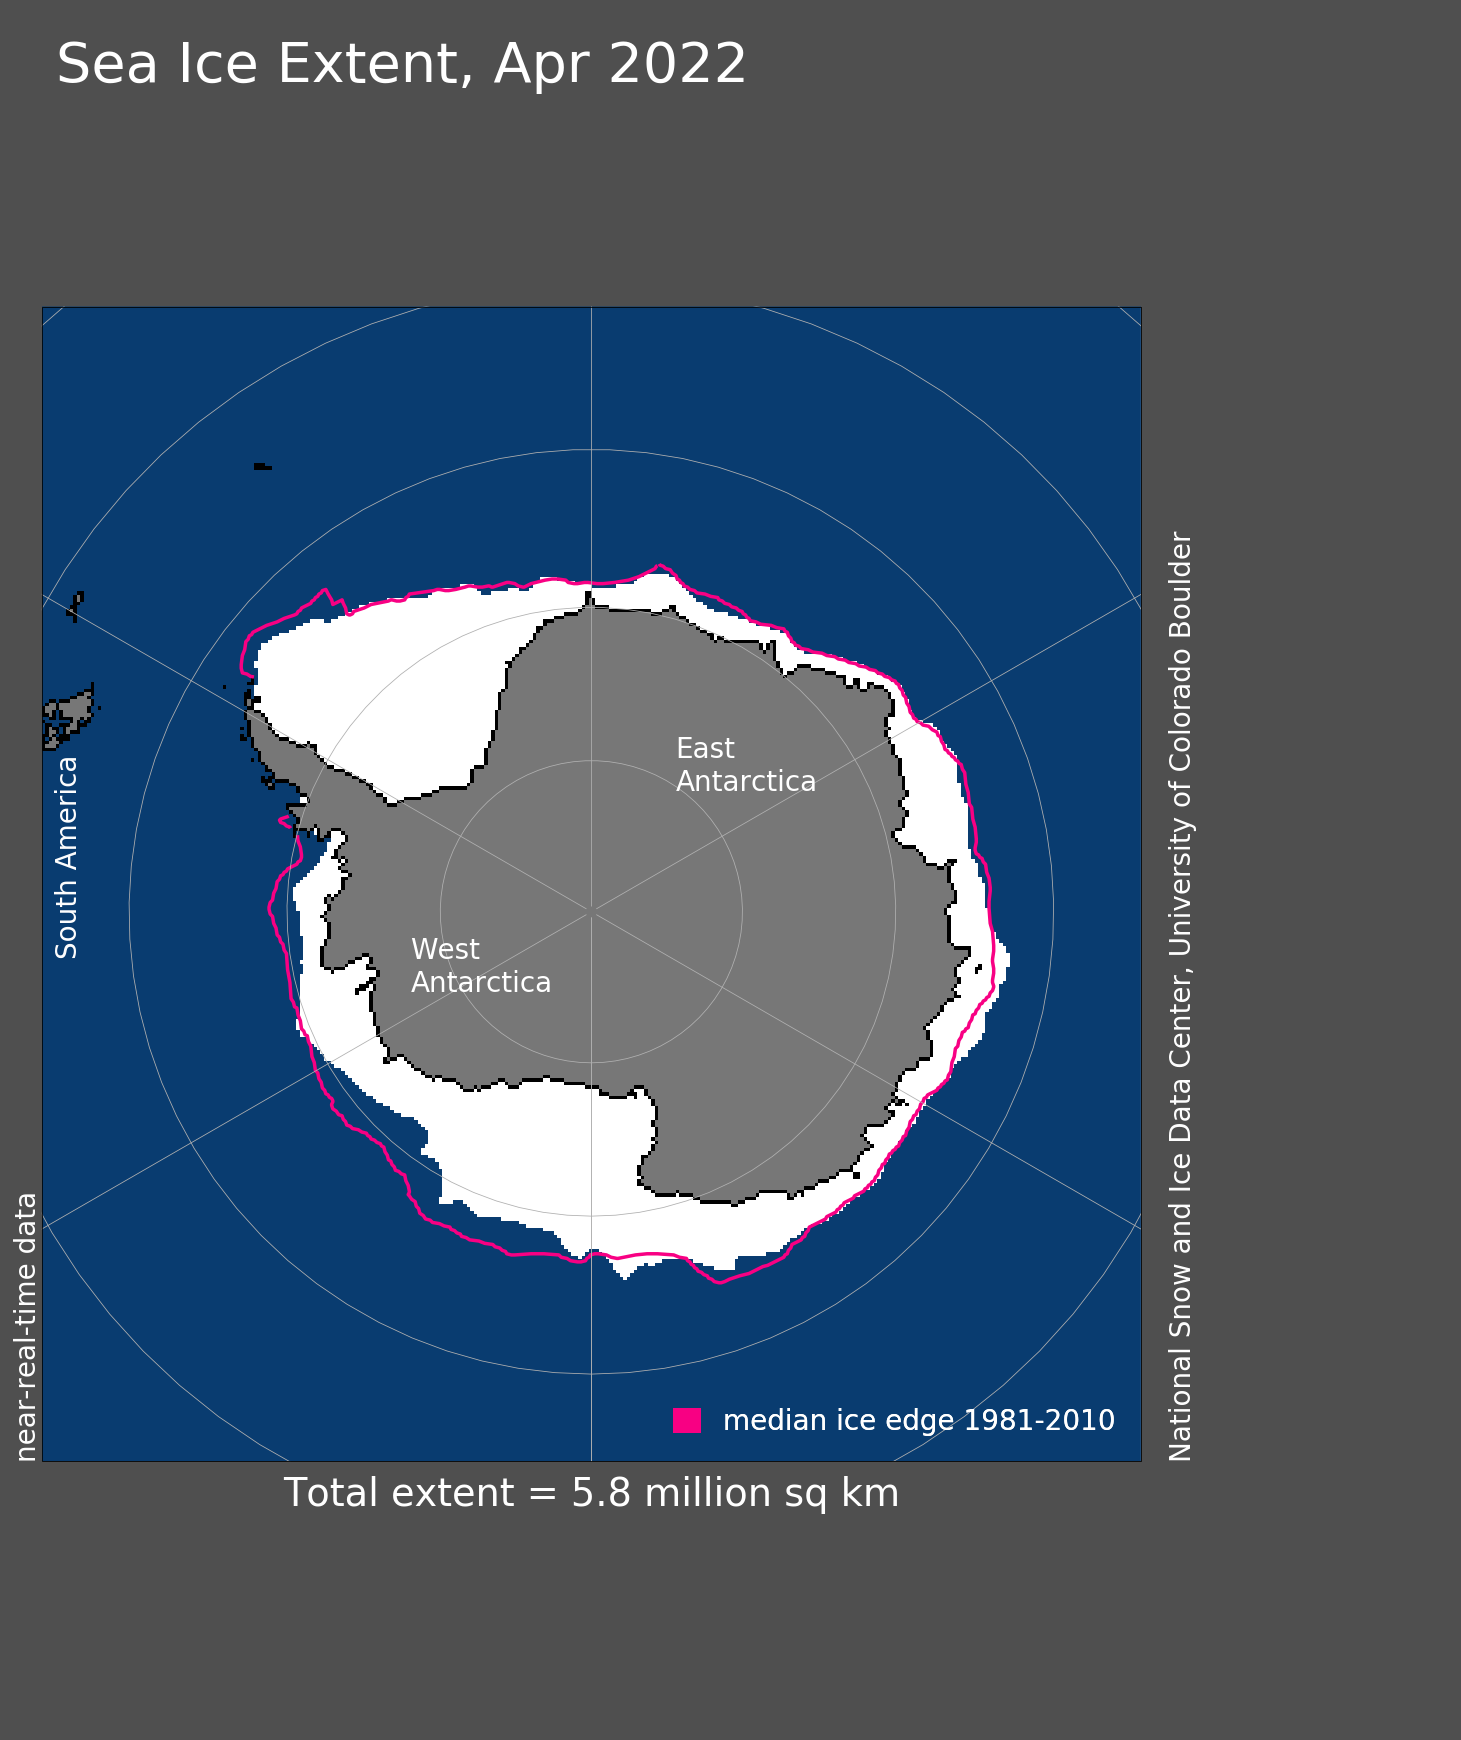
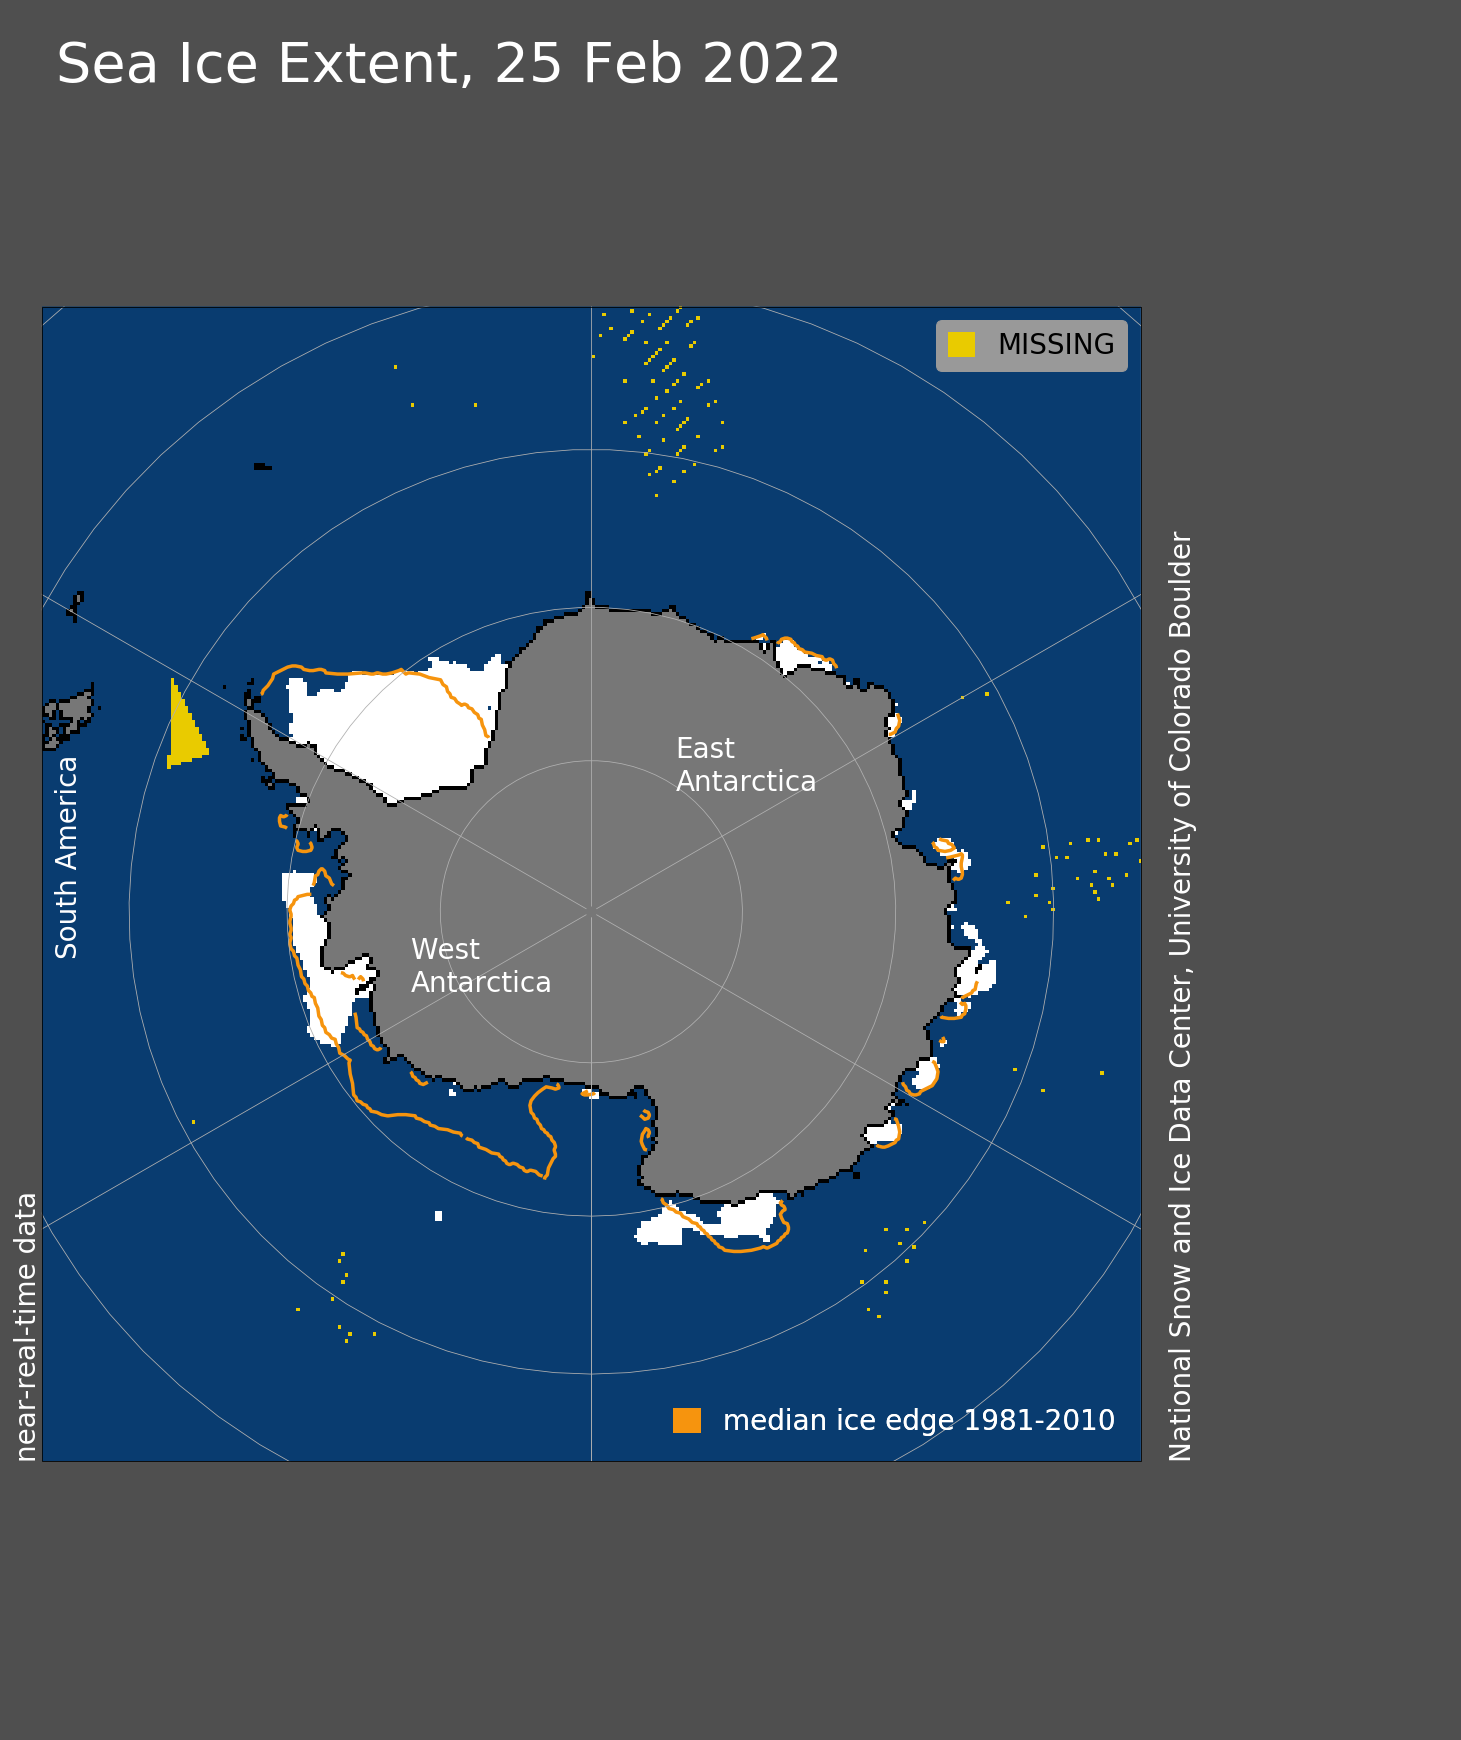
Figure 5. Antarctic sea ice extent for September 19, 2022 was 18.14 million square kilometers (7.00 million square miles). The orange line shows the 1981 to 2010 average extent for that day. Sea Ice Index data. About the data
Credit: National Snow and Ice Data Center
High-resolution image
Antarctic sea extent is nearing it seasonal maximum. While extent was tracking at record or near record lows since early June, there has been a recent spurt in growth, and extent has reached the tenth percentile for this time of year, still well below average but no longer near the record lowest maximum.
Further reading
Landy, J. C., G. J. Dawson, M. Tsamados, M. Bushuk, J. Stroeve, S. Howell, T. Krumpen, D. Babb, A. Komarov, H. Heorton, H. J. Belter, and Y. Aksenov. 2022. A year-round satellite sea-ice thickness record from CryoSat-2. Nature. doi:10.1038/s41586-022-05058-5.