Throughout February, Arctic sea ice extent tracked between second and fourth lowest in the satellite record while Antarctic sea ice extent tracked at record low extents. Antarctic sea ice has hit its minimum extent for the year, setting a new record low, and is now expanding.
Overview of conditions

Figure 1a. Arctic sea ice extent for February 2023 was 14.18 million square kilometers (5.47 million square miles). The magenta line shows the 1981 to 2010 average extent for that month. Sea Ice Index data. About the data
Credit: National Snow and Ice Data Center
High-resolution image
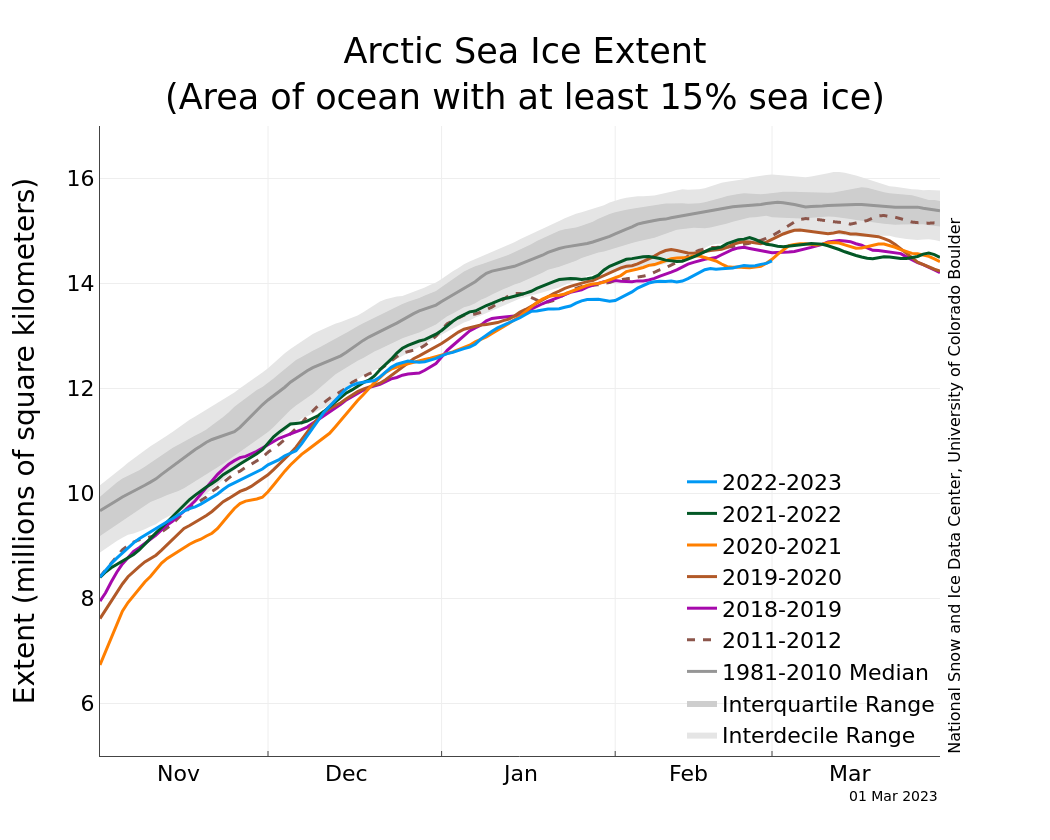
Figure 1b. The graph above shows Arctic sea ice extent as of March 1, 2023, along with daily ice extent data for four previous years and the record high year. 2022 to 2023 is shown in blue, 2021 to 2022 in green, 2020 to 2021 in orange, 2019 to 2020 in brown, 2018 to 2019 in magenta, and 2011 to 2012 in dashed brown. The 1981 to 2010 median is in dark gray. The gray areas around the median line show the interquartile and interdecile ranges of the data. Sea Ice Index data.
Credit: National Snow and Ice Data Center
High-resolution image
The February 2023 average Arctic sea ice extent was 14.18 million square kilometers (5.47 million square miles), the third lowest February in the satellite record (Figure 1a). February extent was 1.12 million square kilometers (432,000 square miles) below the 1981 to 2010 average of 15.30 million square kilometers (5.91 million square miles), but 210,000 square kilometers (81,000 square miles) above the record low set in February 2018.
The overall daily rate of increase in extent through the month was near average, but with periods of rapid increase at the start and the middle of the month, followed by periods of little change (Figure 1b). This is not uncommon for this time of year as ice growth slows and the ice edge is vulnerable to winds that either compress or expand the ice cover. Ice expansion slowed the last week of February and while the seasonal maximum does not appear to have been reached, it is likely not far away. The seasonal maximum has occurred as early as February 24 in 1987 and 1996 and as late as April 2 in 2010.
Overall, extent increased 724,000 square kilometers (280,000 square miles) during February 2023, compared to the 1981 to 2010 average February increase of 573,000 square kilometers (221,000 square miles). Regionally, extent remained below average in the Barents Sea, the Sea of Okhotsk, and the Gulf of St. Lawrence. In the Bering Sea, the ice extent was closer to average.
Conditions in context
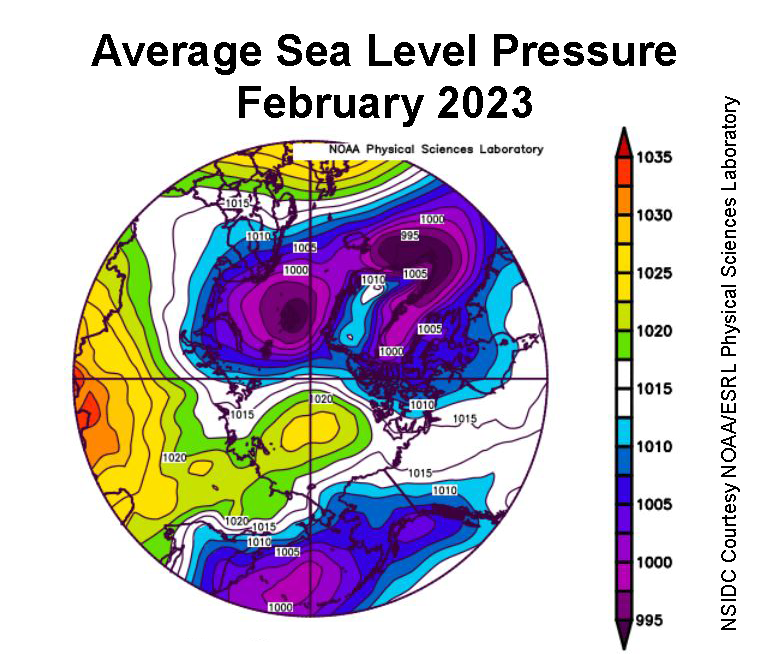
Figure 2a. This plot shows average sea level pressure in the Arctic in millibars for February 2023. Yellows and reds indicate high air pressure; blues and purples indicate low pressure.
Credit: NSIDC courtesy NOAA Earth System Research Laboratory Physical Sciences Laboratory
High-resolution image
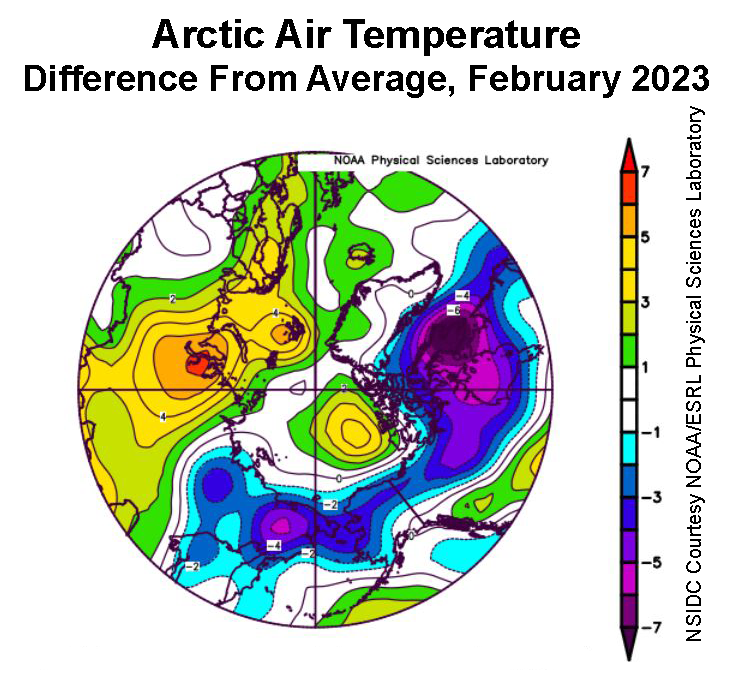
Figure 2b. This plot shows the departure from average air temperature in the Arctic at the 925 hPa level, in degrees Celsius, for February 2023. Yellows and reds indicate higher than average temperatures; blues and purples indicate lower than average temperatures.
Credit: NSIDC courtesy NOAA Earth System Research Laboratory Physical Sciences Laboratory
High-resolution image
During February, the Arctic Oscillation, a large-scale mode of Arctic climate variability, was in a strongly positive phase. When the Arctic Oscillation index is positive, the low sea level pressure over Svalbard strengthens, and the winds circulating around the North Pole are stronger, helping to keep cold air in the Arctic Ocean. The sea level pressure pattern for February featured unusually low sea level pressure over Svalbard coupled with high pressure over the central Arctic Ocean and Siberia (Figure 2a). The Siberian High and Beaufort Sea High are common features of winter, yet this February, the Beaufort Sea High shifted more towards the Pole. The combination of low pressure over Svalbard and high pressure over the central Arctic Ocean helped drive relatively warm air from the south across the North Atlantic and into the Barents Sea, and push cold Arctic air towards the Bering Sea. Cold Arctic air was also drawn westwards into eastern Canada. Air temperatures of up to 6 degrees Celsius (11 degrees Fahrenheit) below average were also found over Baffin Bay and Hudson Bay (Figure 2b).
Another noteworthy atmospheric event of February was a sudden stratospheric warming (SSW). These occur when atmospheric longwaves propagate into the stratosphere, weakening or even reversing the stratospheric polar vortex. The effects can then propagate downward into the troposphere, enabling cold Arctic air to spill into lower latitudes. Heading into February, it appears that the stratospheric vortex was already in a weakened state because of vertical wave propagation. This made it susceptible to further breakdown about 10 days later when the vortex center shifted from the pole toward Europe. Overall, SSW events generally lead to Arctic sea ice growth, though the exact response varies by region.
February 2023 compared to previous years
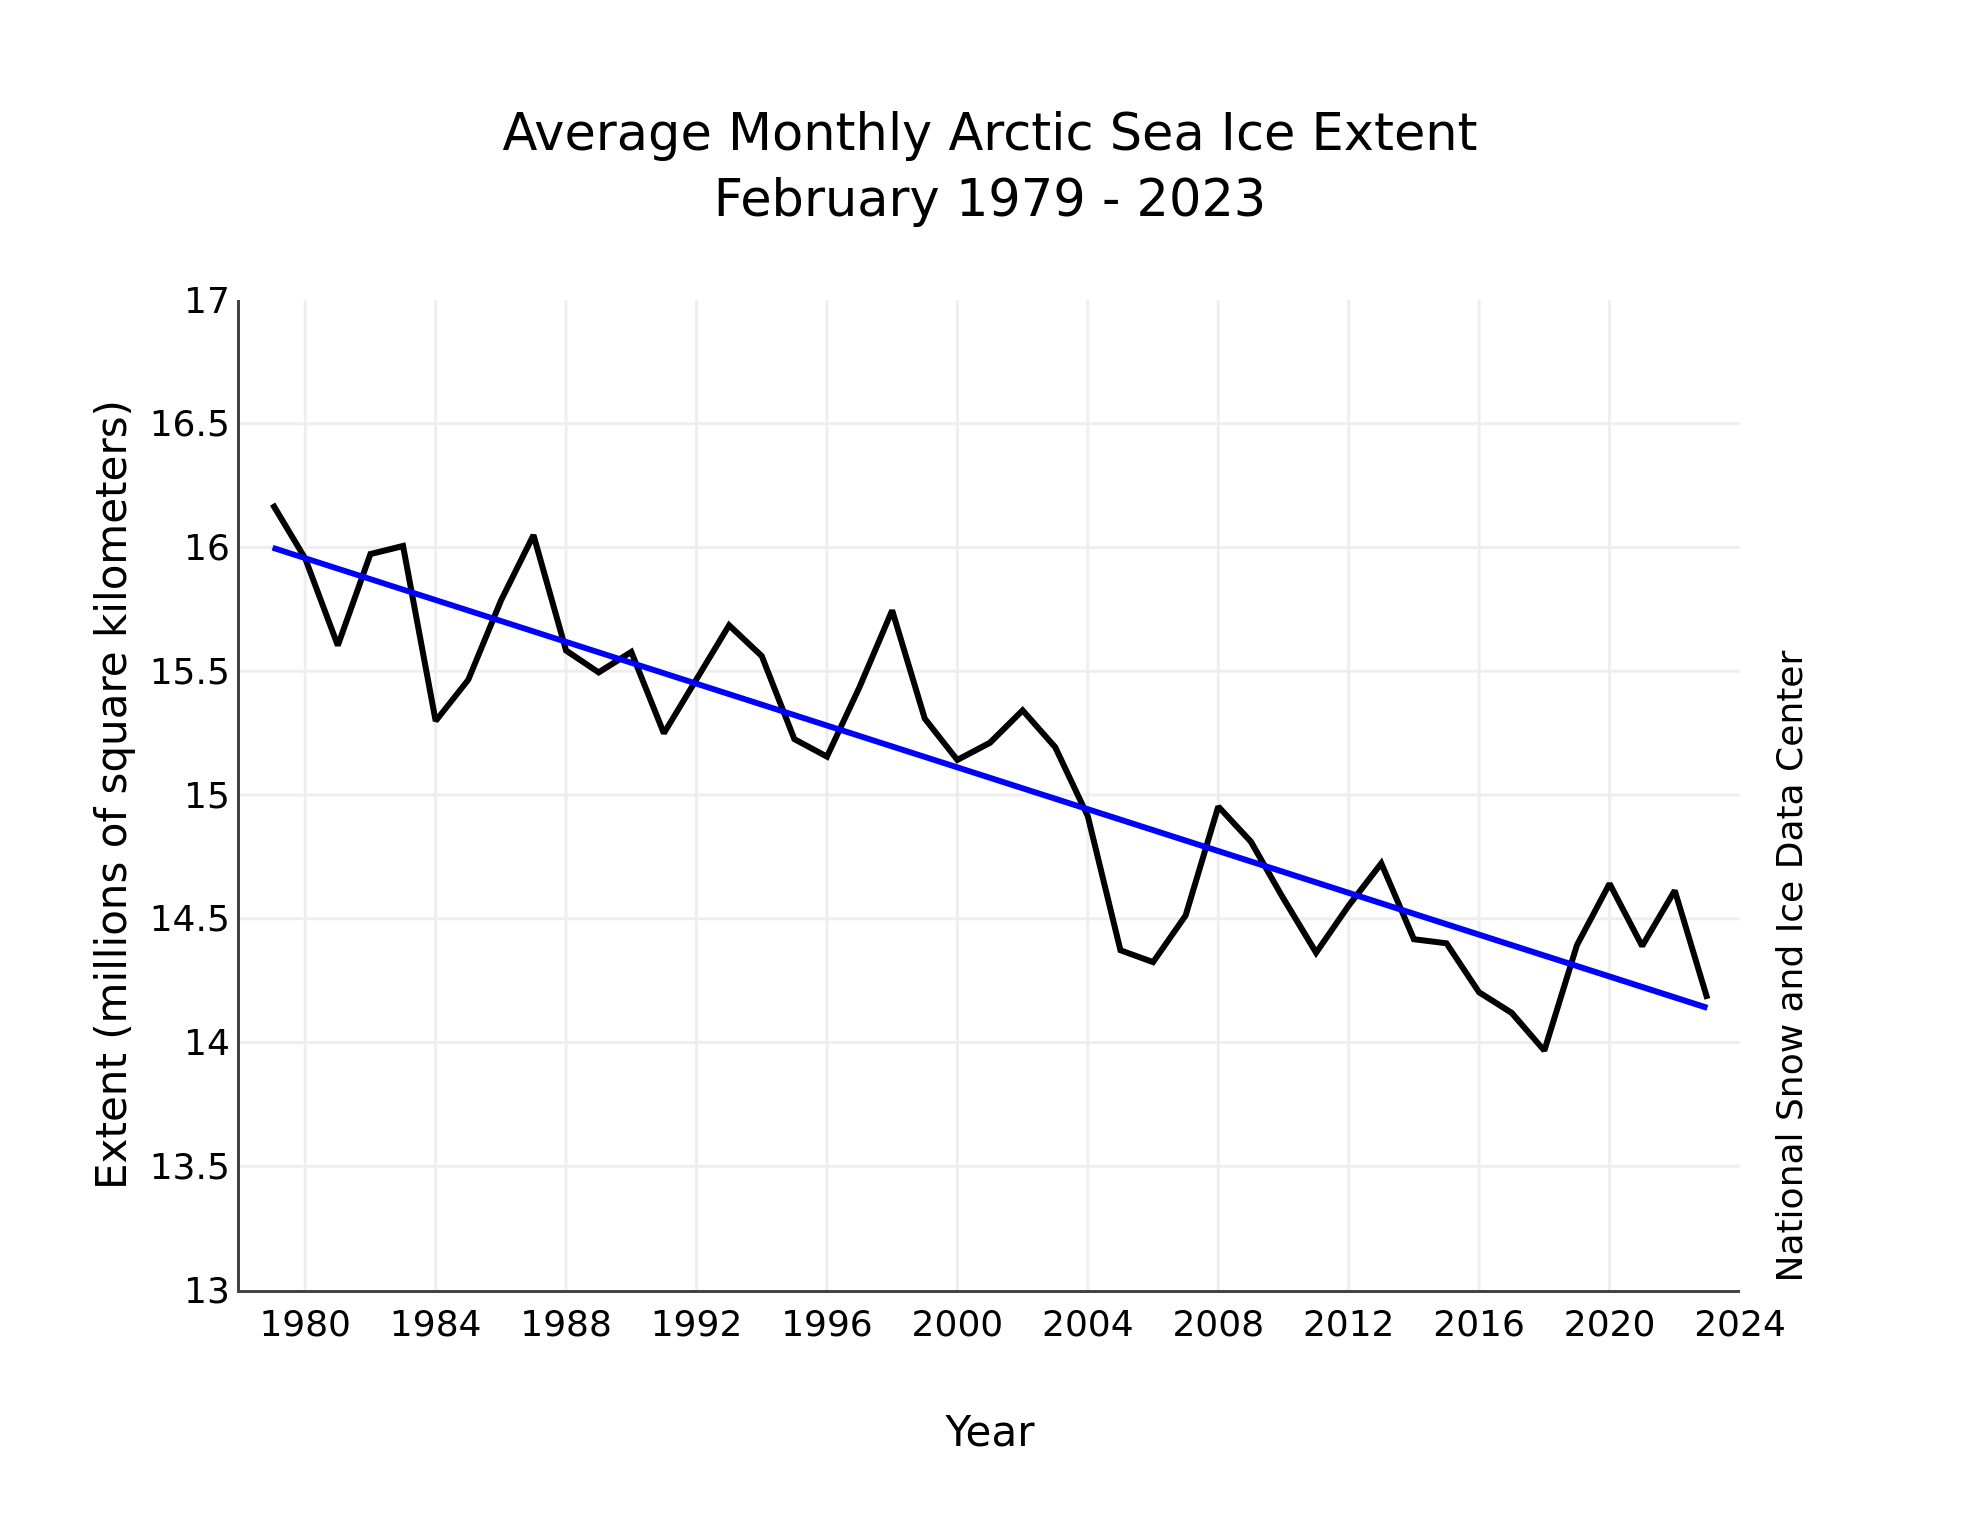
Figure 3. Monthly February ice extent for 1979 to 2023 shows a decline of 2.8 percent per decade.
Credit: National Snow and Ice Data Center
High-resolution image
The downward linear trend in February sea ice extent over the 45-year satellite record is 42,300 square kilometers (16,300 square miles) per year, or 2.8 percent per decade relative to the 1981 to 2010 average. Based on the linear trend, since 1979, February extent has lost 1.86 million square kilometers (718,000 square miles) of ice. This is equivalent to about seven times the size of Colorado or about five times the size of Germany.
The role of atmospheric rivers in keeping Arctic winter sea ice extent low
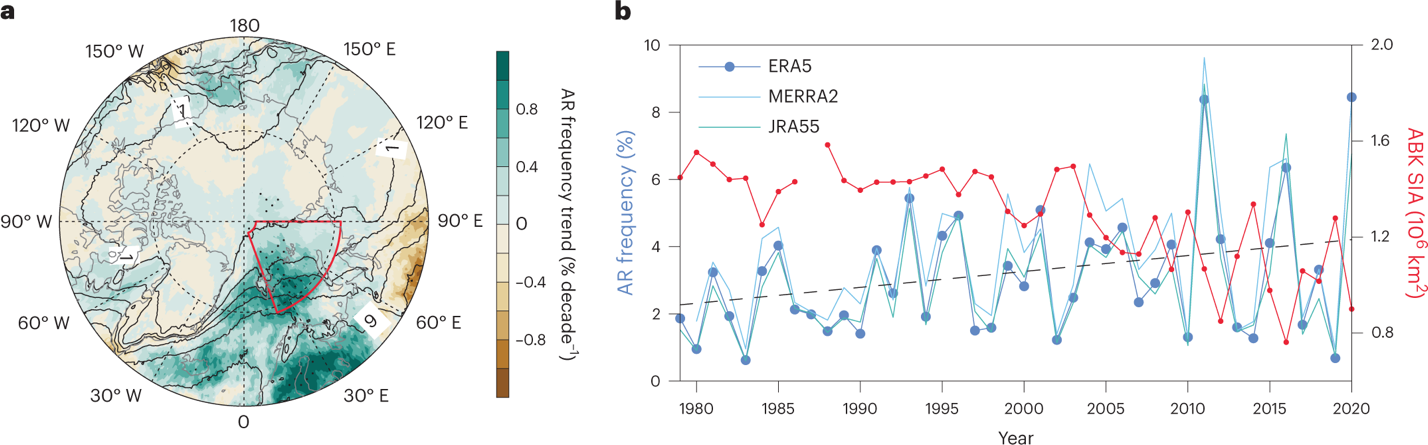
Figure 4. This figure shows November to January averaged trends in atmospheric river (AR) events. The Arctic map (a) shows AR frequency trend from the ERA5 model and two other climate re-analyses. The plot (b) shows a time series of ARs in the Barents and Kara Seas from three different atmospheric reanalysis data sets together with the sea ice area in that region. AR frequency refers to the number of atmospheric river events in the late-fall/early-winter period; ABK (Arctic-Barents-Kara) refers to the area outlined in red in the map, and SIA is sea ice area.
Credit: Zhang et al., 2023
High-resolution image
In recent years, low sea ice extent in the Barents and Kara Seas has driven the overall negative trend in winter Arctic sea ice. Previous studies attributed the low ice cover in this region to increased ocean heat transport from the North Atlantic. A new study is looking at the role of atmospheric rivers as a contributing process. Atmospheric rivers bring in warm moist air from the tropics and subtropics, increasing the downward longwave radiation to the surface. They can also bring heavy rainfall. Both processes can melt sea ice. According to the study, more atmospheric rivers are entering the Eurasian Arctic than previously, leading to reduced ice formation or melting of thin ice in November through January.
The Kivalliq polynya
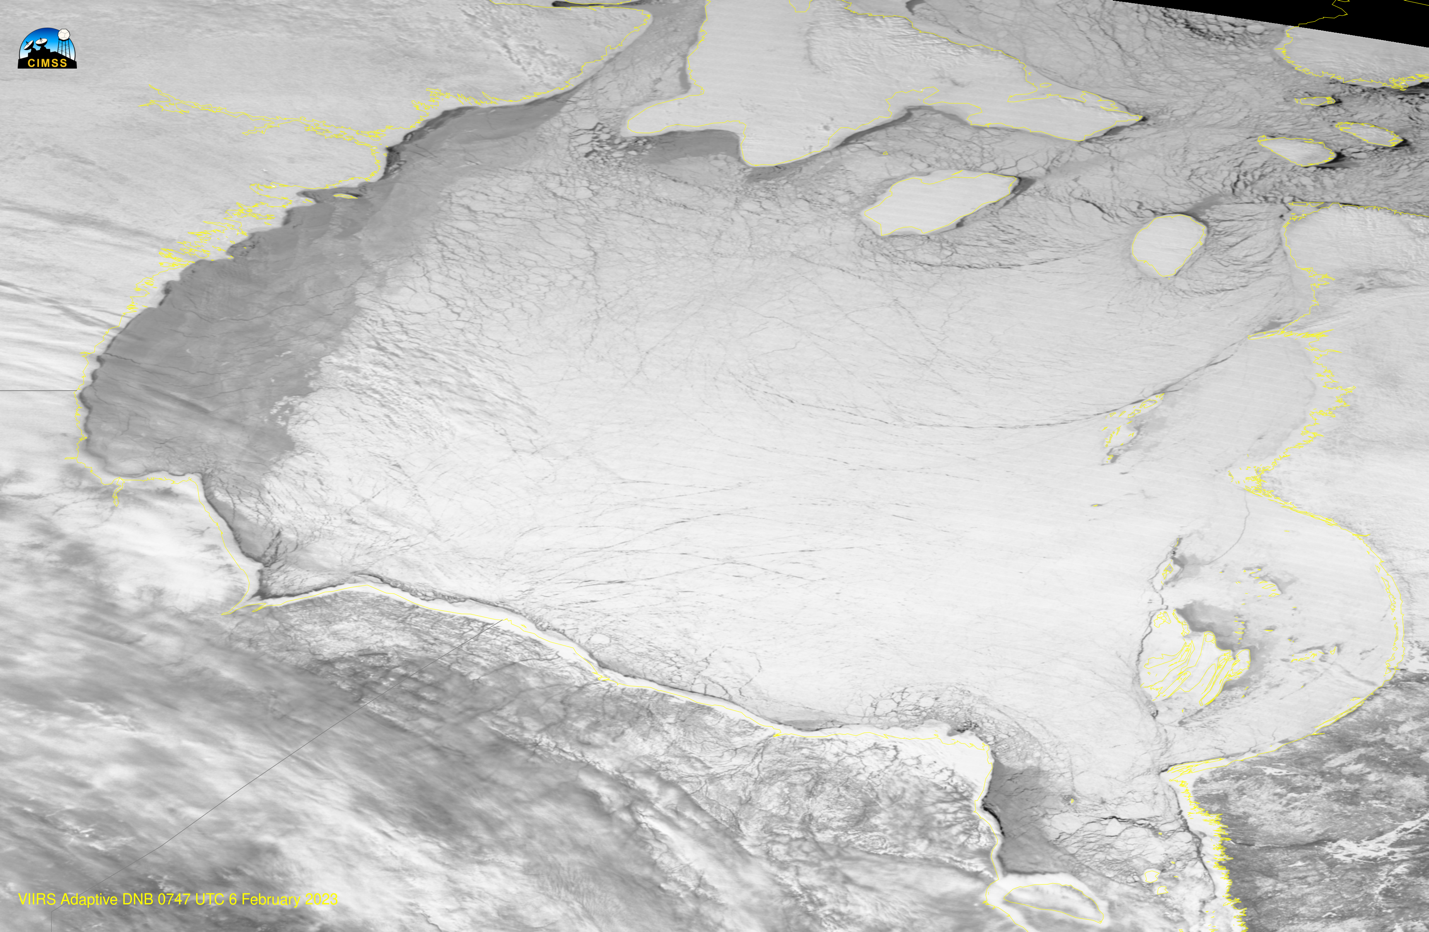
Figure 5. This NASA Visible Infrared Imaging Radiometer Suite (VIIRS) visible image was taken on February 6, 2023. The darker area on the western half of the Bay is newly formed sea ice where the polynya opened.
Credit: The National Oceanic and Atmospheric Administration Cooperative Institute for Meteorological Satellite Studies (CIMSS) at the University of Wisconsin-Madison Satellite Blog
High-resolution image
Hudson Bay is generally completely ice covered during the Arctic winter. However, as in other places, polynyas, regions of persistent open water, can occur under certain conditions. In western Hudson Bay, openings and closings of what is called the Kivalliq polynya are regular events related to strong winds. This polynya forms in winter as offshore winds push the ice away from the coast. As ice is pushed away, the open water left behind begins to freeze and new ice quickly forms. On average, about 182 cubic kilometers (43.7 cubic miles) of new ice is produced annually in this polynya, equivalent to about 20 percent of the winter ice volume of Hudson Bay, according to colleagues at the University of Manitoba. On January 21, the Kivalliq polynya once again opened and was soon covered by thin ice that was observed in visible and thermal satellite imagery. Synthetic Aperture Radar (SAR) and L-band passive microwave data from the Soil Moisture and Ocean Salinity (SMOS) satellite also captured the opening and closing of the polynya. Interestingly, the ice reflectance and the surface temperature in this region two weeks later was quite uniform, suggesting very uniform ice thickness (Figure 5). Polynyas such as this one not only facilitate ice production, they are also biologically important regions, fostering springtime phytoplankton blooms. They also play a large role in heat and moisture exchanges between the ocean and the colder atmosphere above it. Moreover, they lead to the production of dense, cold, and salty water as the sea ice freezes. Sea ice crystals are fresh ice and the formation of the crystals reject the salt brine, leading to dense descending water.
Antarctic sea ice may be reversing course
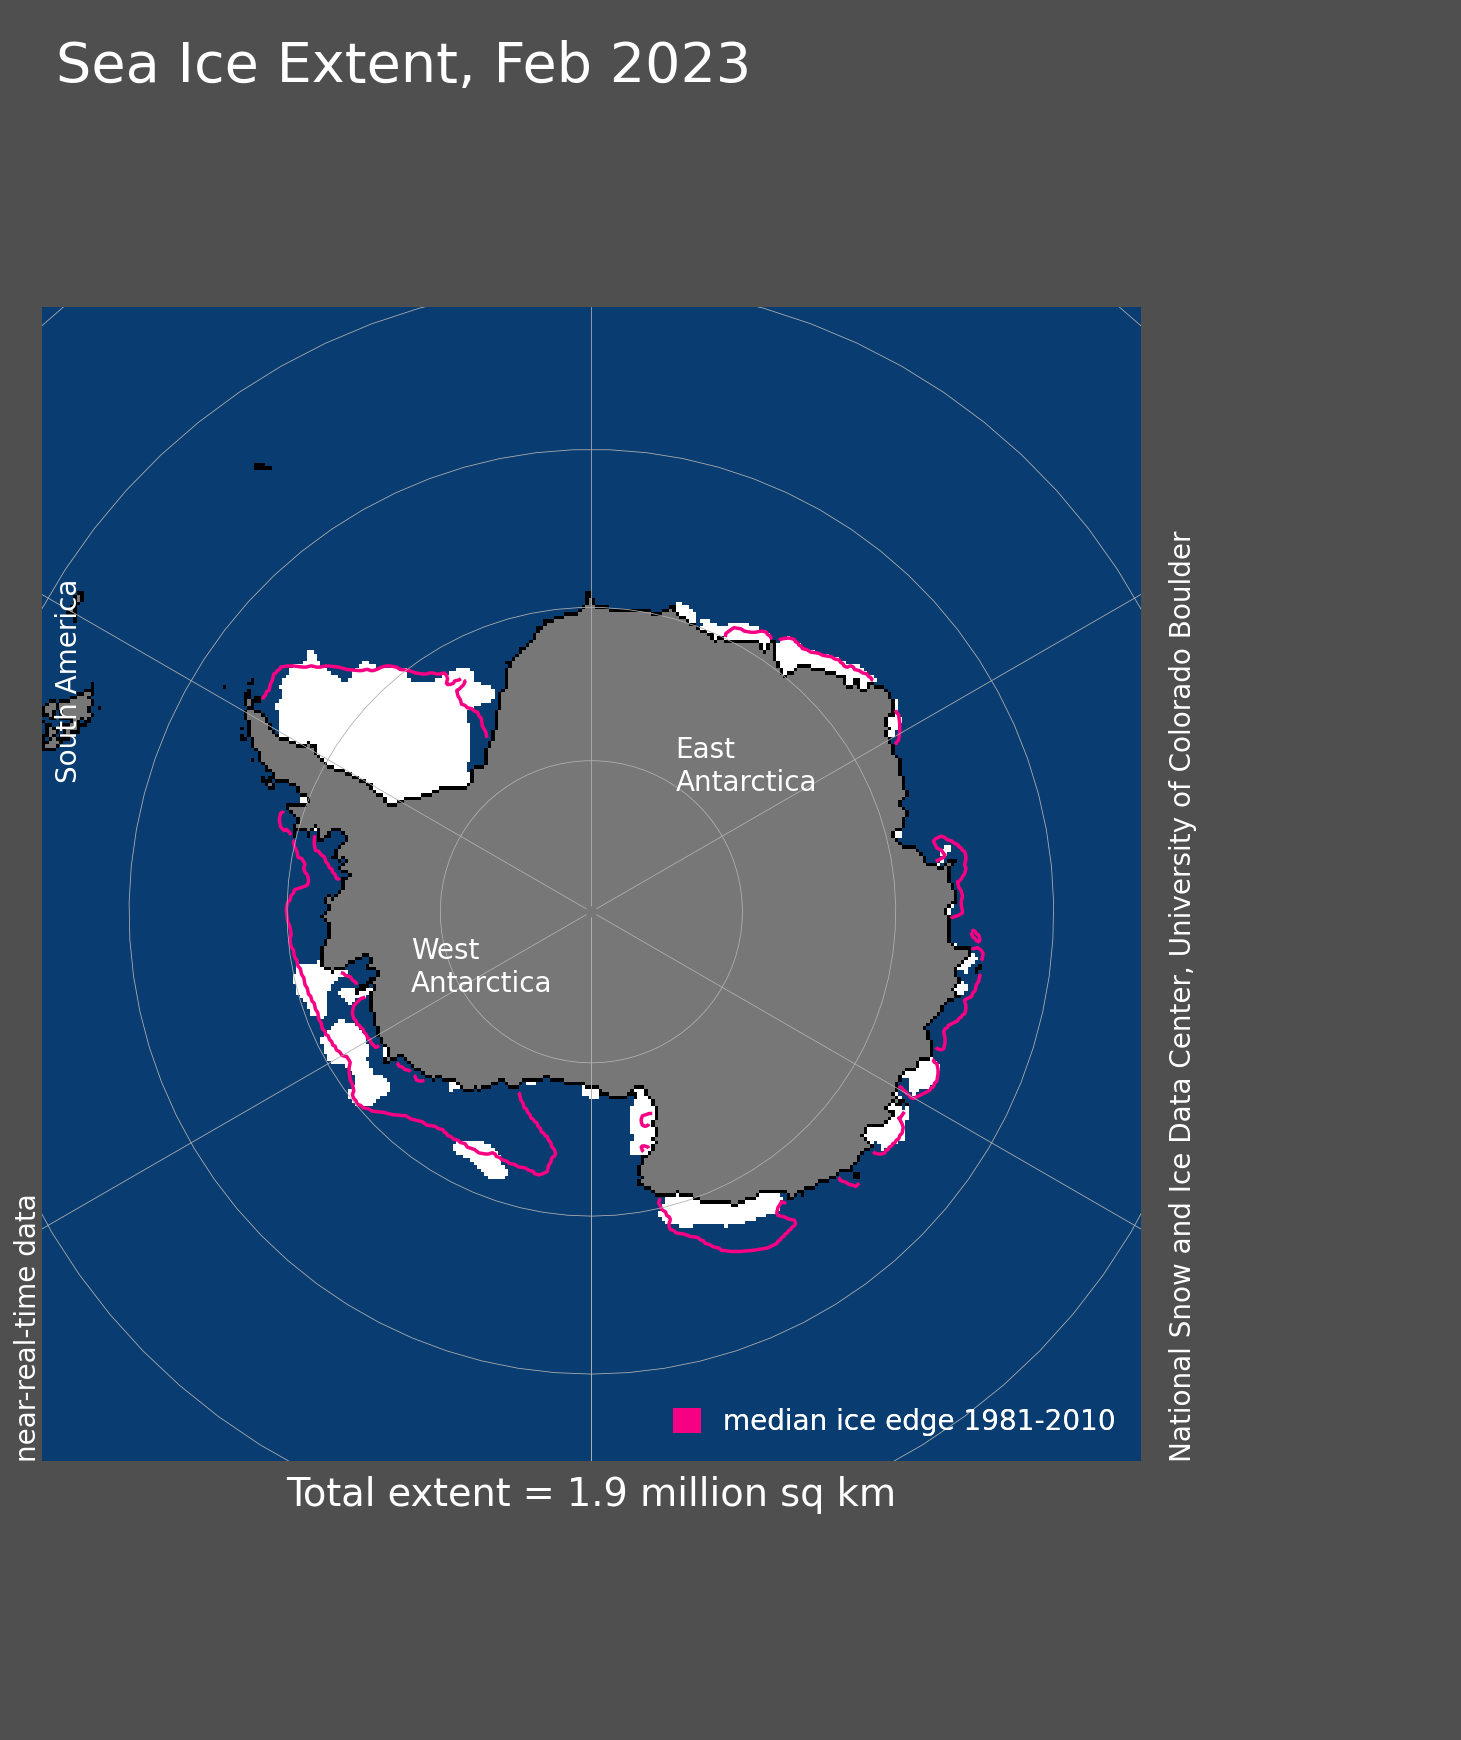
Figure 6a. Antarctic sea ice extent for February 2023 was 1.90 million square kilometers (734,000 square miles). The magenta line shows the 1981 to 2010 average extent for that month. Sea Ice Index data. About the data
Credit: National Snow and Ice Data Center
High-resolution image
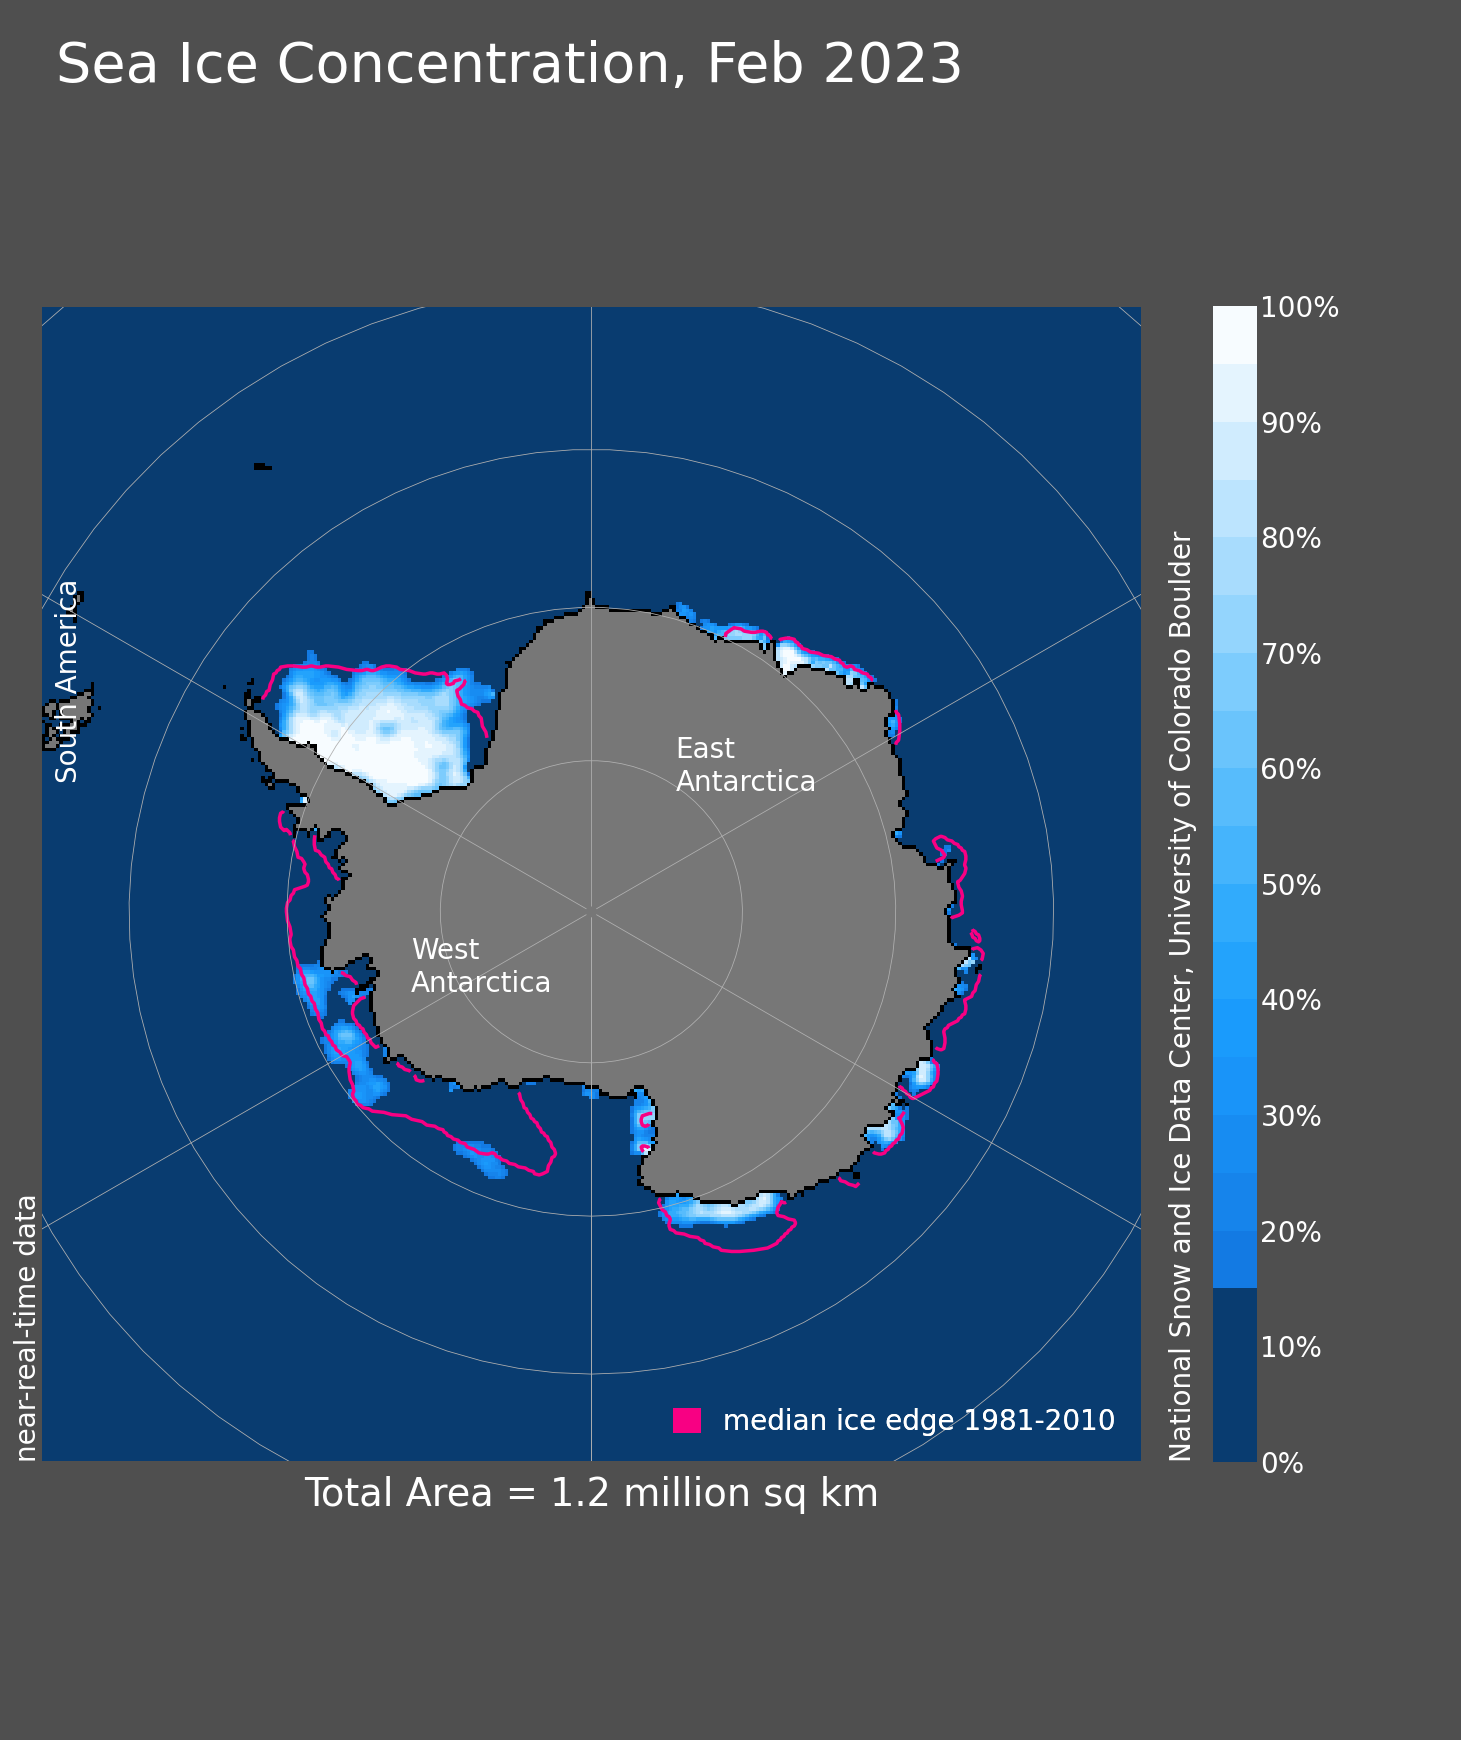
Figure 6b. Antarctic sea ice concentration for February 2023 was 1.20 million square kilometers (463,000 square miles). The magenta line shows the 1981 to 2010 average extent for that month. Sea Ice Index data. About the data
Credit: National Snow and Ice Data Center
High-resolution image
Antarctic sea ice extent continued to track at record lows for this time of year. By the end of February, extent was 1.83 million square kilometers (707,000 square miles). This is 93,000 square kilometers (35,900 square miles) below the record seasonal minimum that occurred on February 25, 2022. Extent remained particularly low in the Amundsen, Bellingshausen, and Ross Seas (Figure 6a). Most of the sea is ice gone from the Ross Sea, and what little ice remains in the Amundsen/Bellingshausen Seas is very low concentration (Figure 6b). In the Weddell Sea, the ice edge remains near average for this time of year.
Until recently, there was a weak overall upward trend in Antarctic sea ice extent, but with some parts of the Antarctic sea ice exhibiting strong positive trends in extent and other areas exhibiting strong negative trends. According to colleagues at Commonwealth Scientific and Industrial Research Organisation (CSIRO Australia), this pattern is changing. Over the past decade, there is less regional variability. Patterns of sea ice extent variations, high or low, have become more uniform around the continent. This has contributed to the lower Antarctic sea ice extents that have been observed since 2016.
References
Bruneau, J., D. Babb, W. Chan, S. Kirillov, J. Ehn, J. Hanesiak, and D. G. Barber. 2021. The ice factory of Hudson Bay: Spatiotemporal variability of the Kivalliq Polynya. Elementa: Science of the Anthropocene, 9, (1). doi:10.1525/elementa.2020.00168.
Schroeter, S., T. J. O’Kane, and P. A. Sandery. 2023. Antarctic sea ice regime shift associated with decreasing zonal symmetry in the Southern Annular Mode. The Cryosphere, 17, 701–717, doi:10.5194/tc-17-701-2023.
Smith, K. L., L. M. Polvani, and L. B. Tremblay, L. B. 2018. The Impact of Stratospheric Circulation Extremes on Minimum Arctic Sea Ice Extent. Journal of Climate, 31(18), 7169-7183. doi:10.1175/JCLI-D-17-0495.1.
Zhang, P., G. Chen, M. Ting, et al. 2023. More frequent atmospheric rivers slow the seasonal recovery of Arctic sea ice. Nature Climate Change. doi:10.1038/s41558-023-01599-3.

