Arctic sea ice extent rose at a slower than average rate through January, and continued to be below the lower interdecile range. By the end of the month, sea ice reached the second lowest extent in the satellite record. Meanwhile, Antarctic extent remained at record low levels. Combined, the two hemispheres set a record low for total global sea ice extent, yet this does not signify a trend necessarily and may be caused by weather-related variability.
Overview of conditions
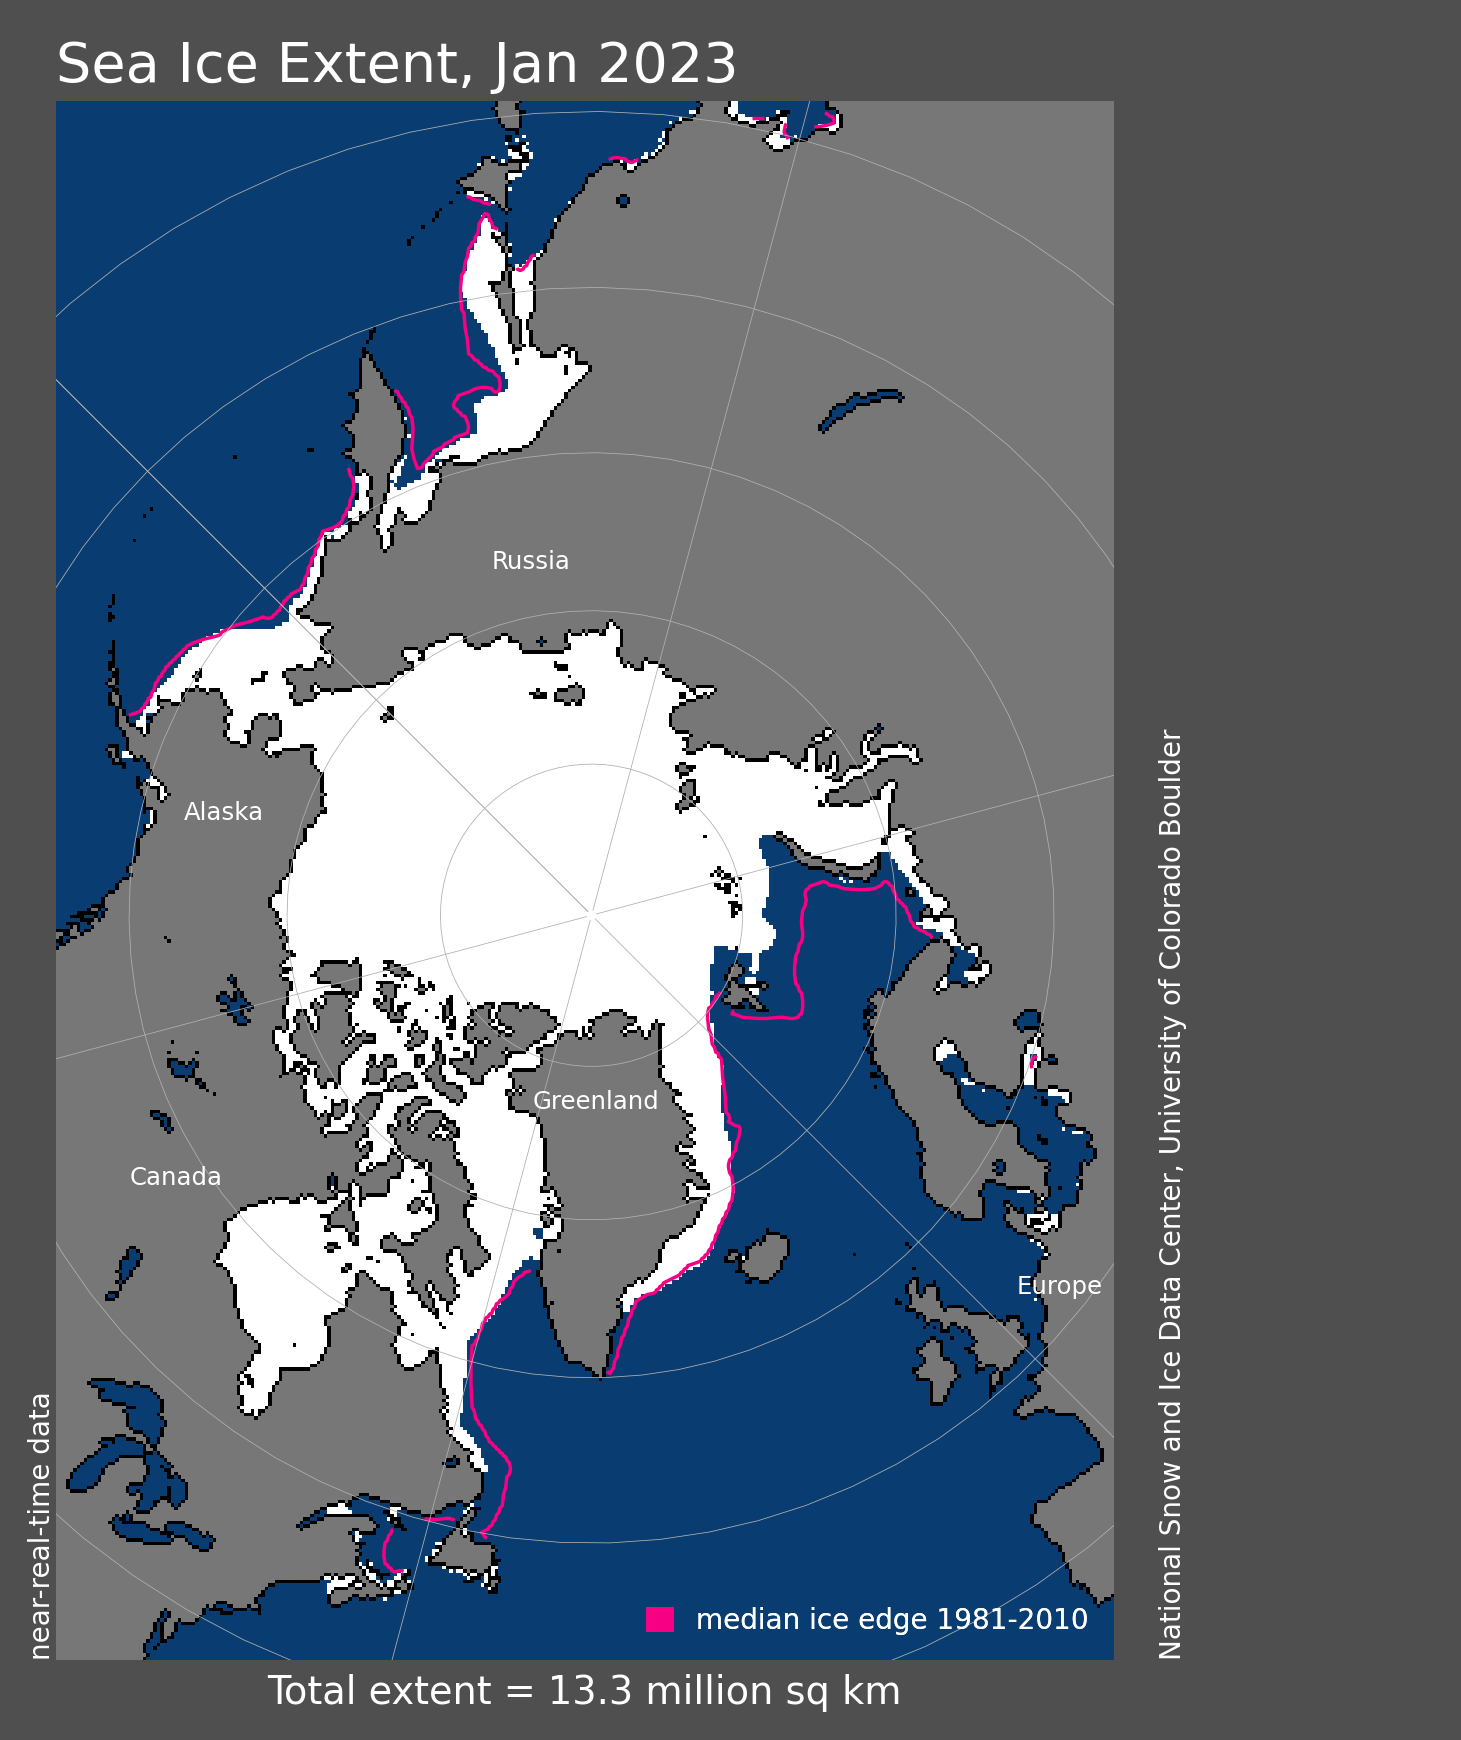
Figure 1a. Arctic sea ice extent for January 2023 was 13.35 million square kilometers (5.15 million square miles). The magenta line shows the 1981 to 2010 average extent for that month. Sea Ice Index data. About the data
Credit: National Snow and Ice Data Center
High-resolution image
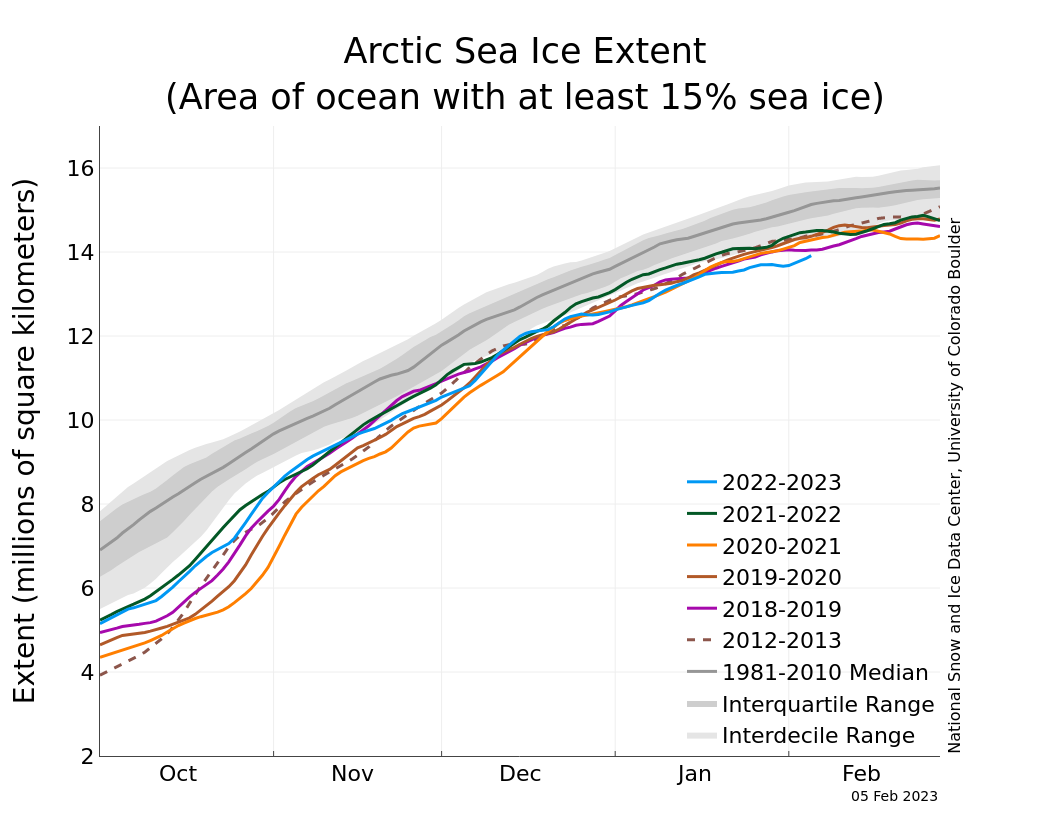
Figure 1b. The graph above shows Arctic sea ice extent as of February 5, 2023, along with daily ice extent data for four previous years and the record low year. 2022 to 2023 is shown in blue, 2021 to 2022 in green, 2020 to 2021 in orange, 2019 to 2020 in brown, 2018 to 2019 in magenta, and 2012 to 2013 in dashed brown. The 1981 to 2010 median is in dark gray. The gray areas around the median line show the interquartile and interdecile ranges of the data. Sea Ice Index data.
Credit: National Snow and Ice Data Center
High-resolution image
The January 2023 average Arctic sea ice extent was 13.35 million square kilometers (5.15 million square miles), the third lowest January in the satellite record (Figure 1a). January extent was 1.07 million square kilometers (413,000 square miles) below the 1981 to 2010 average of 14.42 million square kilometers (5.57 million square miles), but 270,000 square kilometers (104,000 square miles) above the record low set in January 2018.
The daily rate of increase in extent was near average through the first half of the month, but slowed during the second half, and extent slightly declined near the end of the month (Figure 1b). Such short-term declines are not unusual in winter and typically reflect responses to weather patterns. Nevertheless, by the end of the month, the overall daily extent tracked at second lowest in the satellite data record. Overall, extent increased 1.09 million square kilometers (421,000 square miles) during January 2023, compared to the 1981 to 2010 average January increase of 1.33 million square kilometers (514,000 square miles).
Regionally, extent remained particularly low in the Barents Sea, and below average extent was also found in the Sea of Okhotsk, the Bering Sea, and the Gulf of St. Lawrence.
Conditions in context
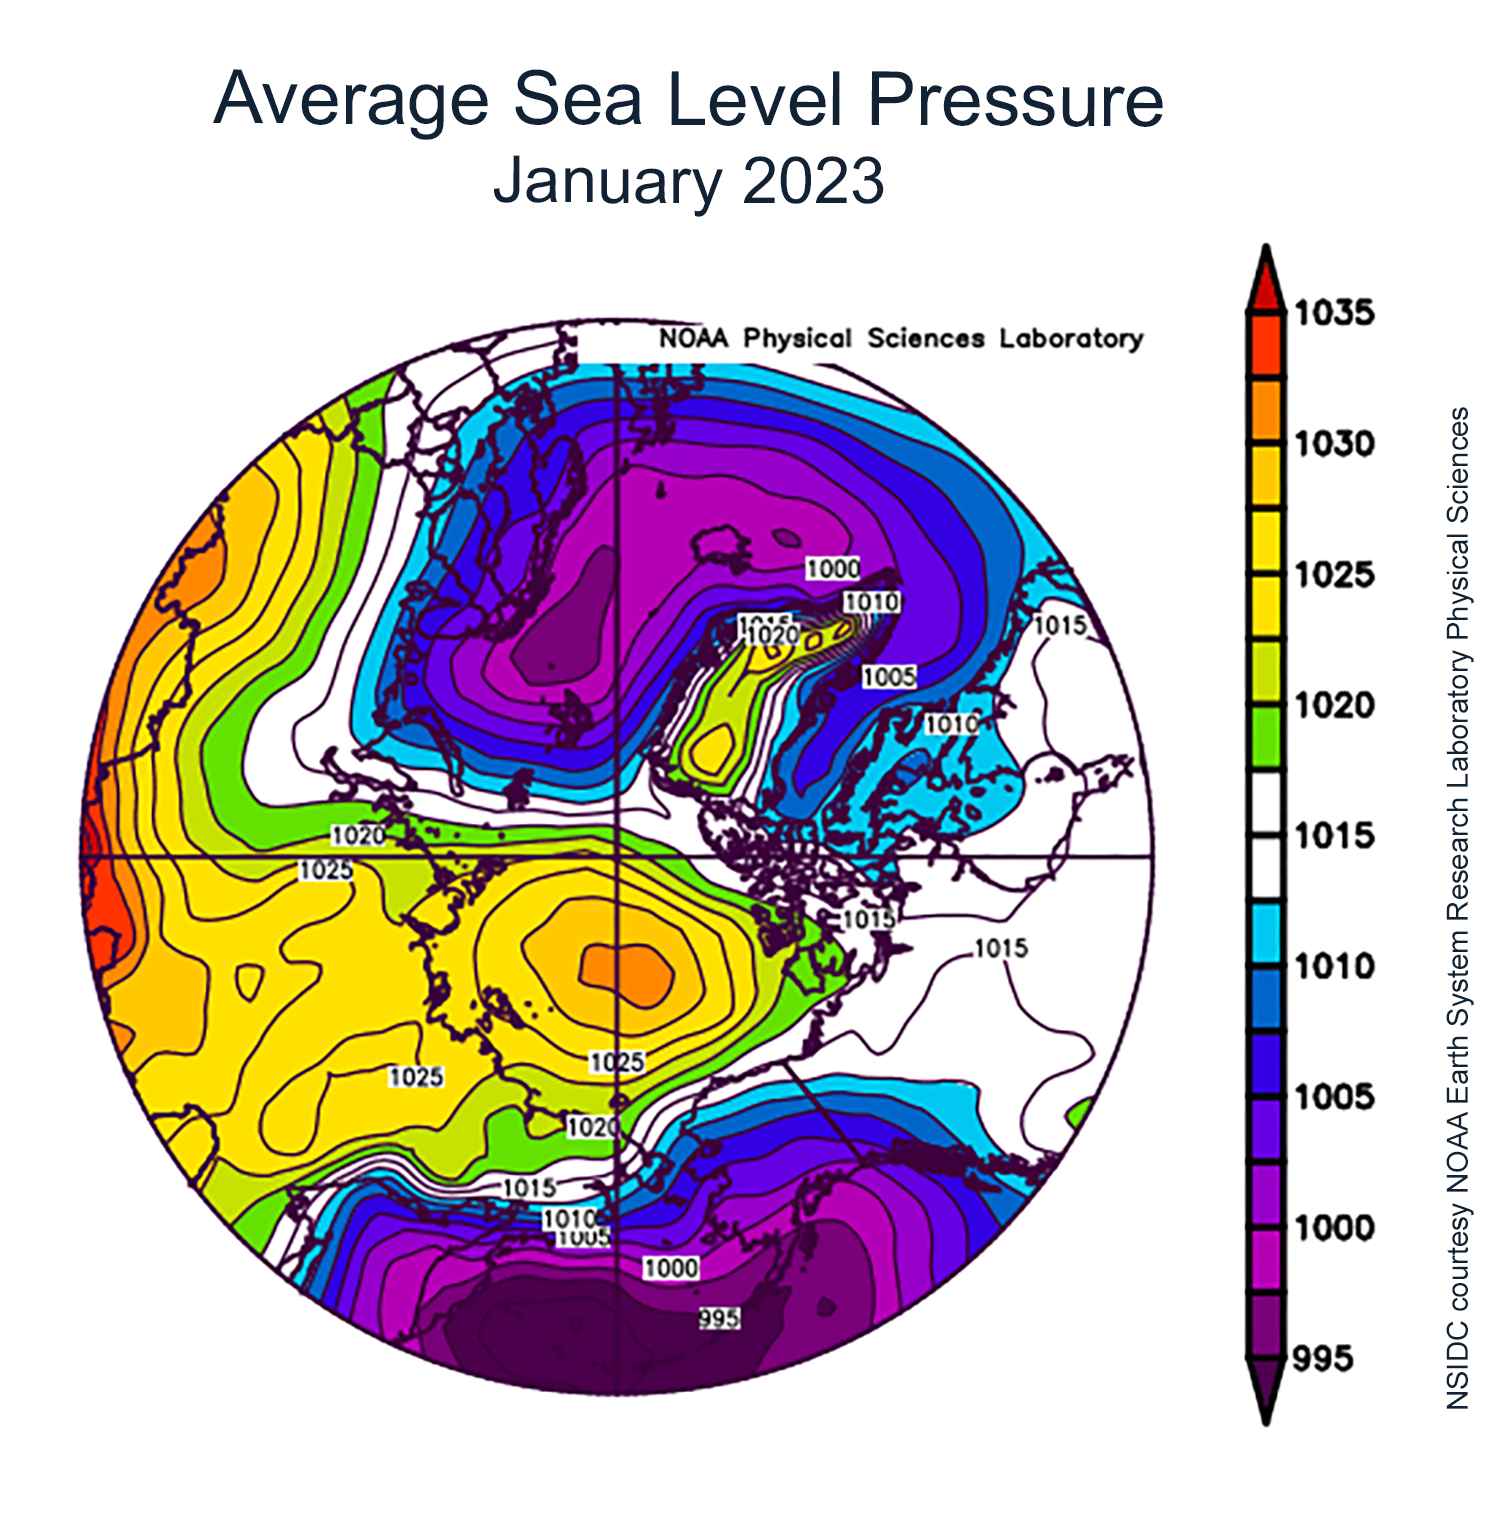
Figure 2a. This plot shows average sea level pressure in the Arctic in millibars for January 2023. Yellows and reds indicate high air pressure; blues and purples indicate low pressure.
Credit: NSIDC courtesy NOAA Earth System Research Laboratory Physical Sciences Laboratory
High-resolution image

Figure 2b. This plot shows the departure from average air temperature in the Arctic at the 925 hPa level, in degrees Celsius, for January 2023. Yellows and reds indicate higher than average temperatures; blues and purples indicate lower than average temperatures.
Credit: NSIDC courtesy NOAA Earth System Research Laboratory Physical Sciences Laboratory
High-resolution image
The sea level pressure pattern for January featured high pressure over the Pacific sector of the Arctic Ocean (Figure 2a). This feature is known as the Beaufort High and is common in winter and spring. The location of the high varies, but on average it is centered over the Beaufort Sea and drives the Beaufort Gyre, which brings ice from north of Greenland and the Canadian Arctic Archipelago through the Beaufort and into the Chukchi Sea. By contrast, over on the Atlantic side of the Arctic, low pressure dominated in the Barents Sea region. As a result, relatively warm air from the south moved into the Barents Sea region, leading to air temperatures at the 925 millibar level (approximately 2,500 feet above the surface) more than 6 degrees Celsius (11 degrees Fahrenheit) above average near Svalbard (Figure 2b). The lack of sea ice in the Barents Sea likely also contributed to above average air temperatures. Elsewhere, air temperatures were above average over most of the Arctic Ocean, with departures from average ranging from 1 degree Celsius (2 degrees Fahrenheit) to 5 degrees Celsius (9 degrees Fahrenheit).
January 2023 compared to previous years

Figure 3. Monthly January ice extent for 1979 to 2023 shows a decline of 3.0 percent per decade.
Credit: National Snow and Ice Data Center
High-resolution image
The downward linear trend in January sea ice extent over the 44-year satellite record is 42,500 square kilometers (16,400 square miles) per year, or 3.0 percent per decade relative to the 1981 to 2010 average. Based on the linear trend, since 1979, January has lost 1.89 million square kilometers (730,000 square miles). This is equivalent to about seven times the size of Colorado or about twice the size of Germany.
Antarctic sea ice at record lows for January
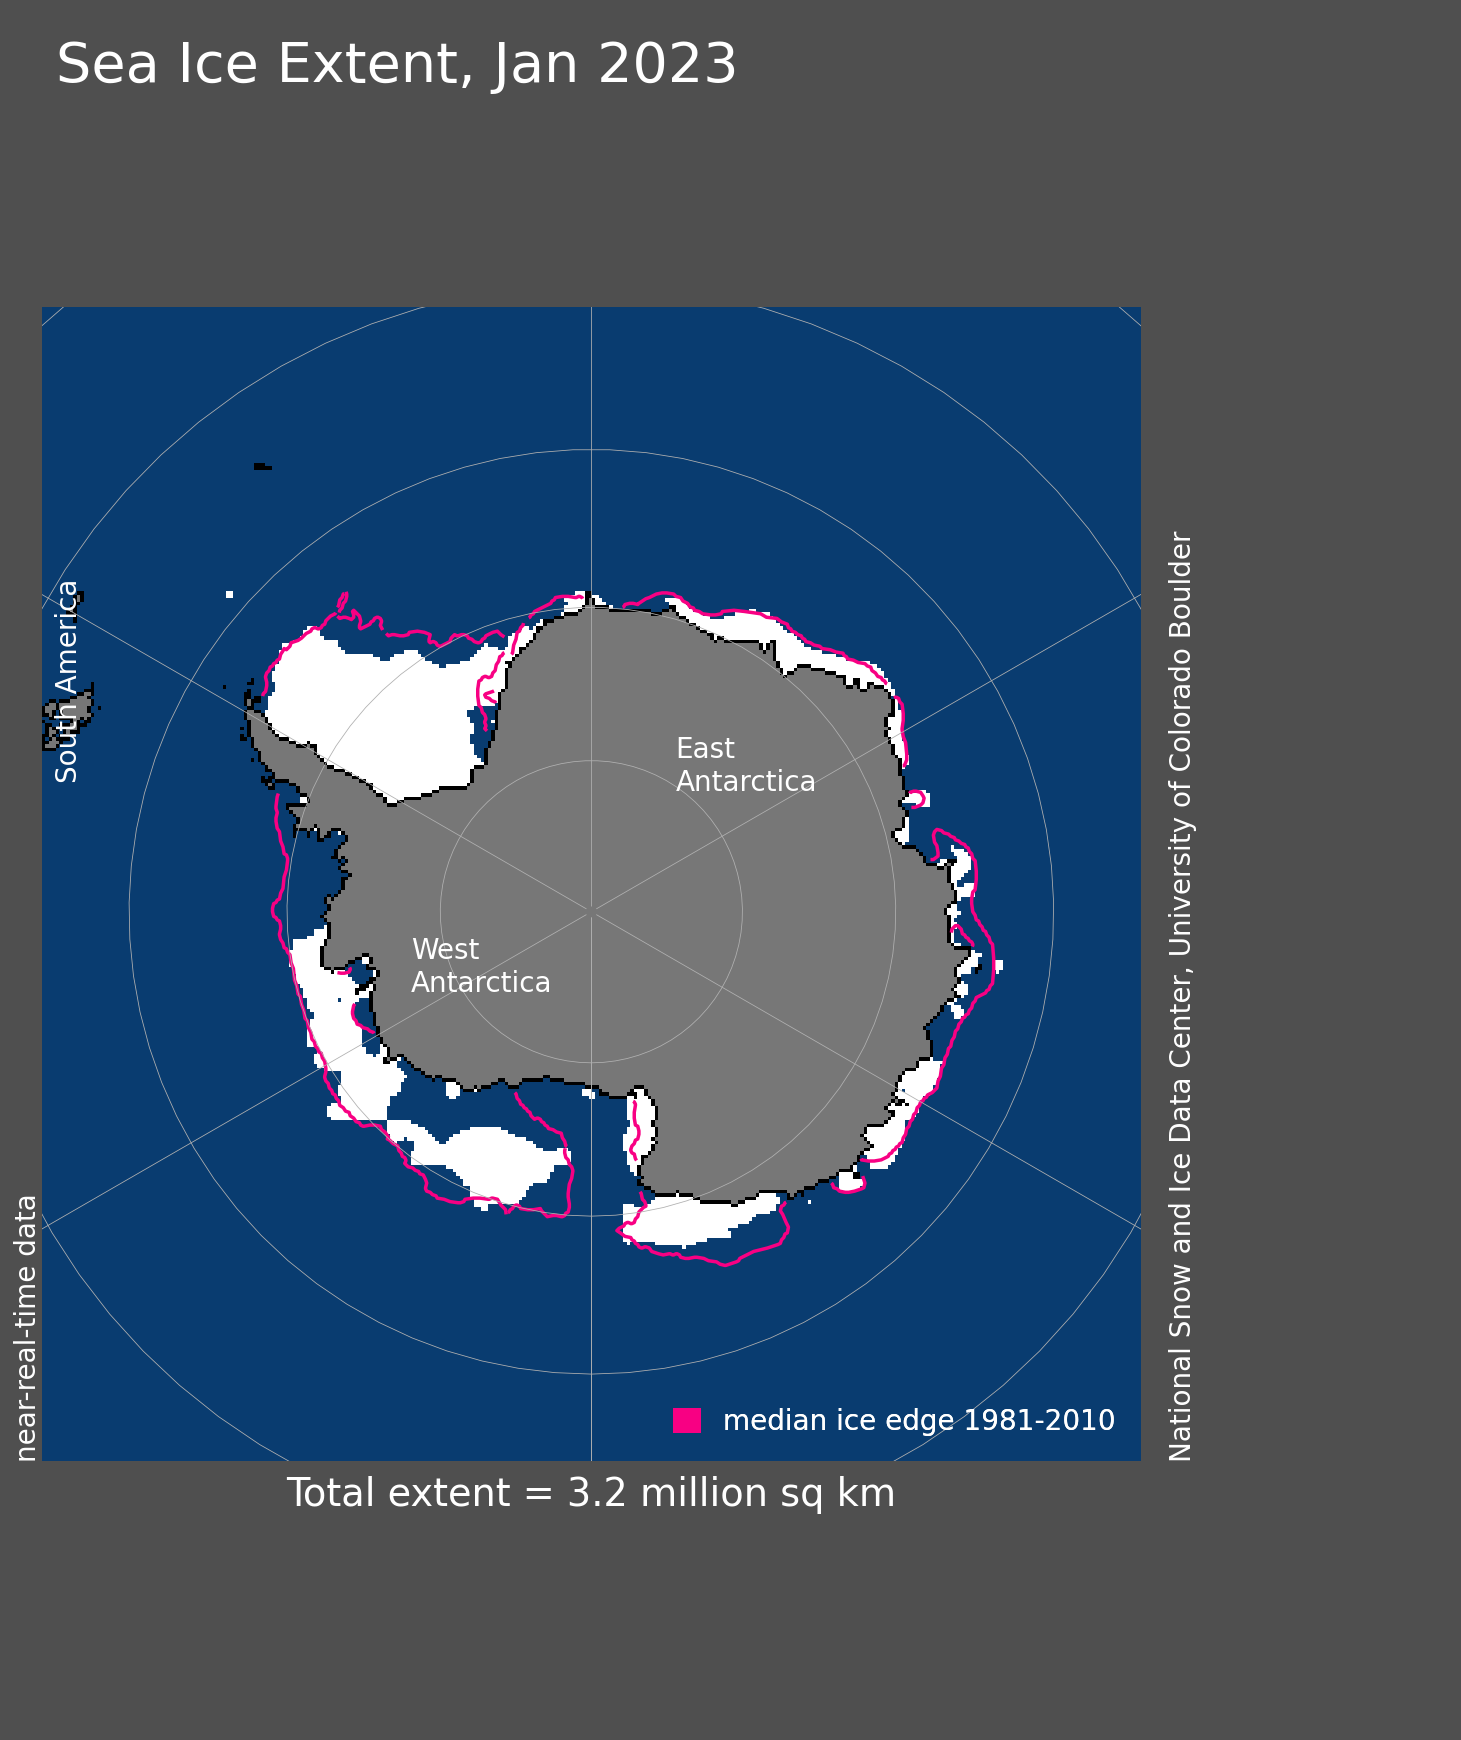
Figure 4a. Antarctic sea ice extent for January 2023 was 3.23 million square kilometers (1.25 million square miles). The magenta line shows the 1981 to 2010 average extent for that month. Sea Ice Index data. About the data
Credit: National Snow and Ice Data Center
High-resolution image

Figure 4b. This maps shows Antarctic sea ice concentration for January 2023. The magenta line shows the 1981 to 2010 average extent for that month. Sea Ice Index data. About the data
Credit: National Snow and Ice Data Center
High-resolution image
Antarctic sea ice extent maintained record lows for this time of year. On February 1, 2023, the extent was 2.26 million square kilometers (873,000 square miles). This is 270,000 square kilometers (104,000 square miles) below the previous February 1 record low in 2017, and 310,000 square kilometers (120,000 square miles) above the record seasonal minimum in extent that occurred on February 25, 2022. Regionally, extent was particularly low in the Amundsen, Bellingshausen, and Ross Seas (Figure 4a). Typically, sea ice is still present along most of the coastline from the eastern Ross Sea to the Antarctic Peninsula, but this year, most of that coast is largely ice free. Extent is also below average along the Wilkes Land coast in East Antarctica, but near average elsewhere around the continent. Large areas of low concentration sea ice are in the Weddell, Ross, and Amundsen Sea ices (Figure 4b). These areas are likely to melt out before the minimum for 2023 is reached, which is expected to occur late this month or in early March.
Weather conditions around Antarctica have been characterized by stronger-than-average westerly winds (a positive Southern Annular Mode index) and a strong and eastward-positioned Amundsen Sea Low. Air temperatures at the 925 millibar level (about 2,500 feet above sea level) have been 1 to 2 degrees Celsius (2 to 4 degrees Fahrenheit) above average since November in a broad area of the coast stretching clockwise from the eastern Wilkes Land through the Ross and Amundsen Sea, and over most of the Weddell Sea. However, warm ocean waters just below the surface layer are also thought to be playing a role in the general downward trend of Antarctic sea ice since 2016 (Zhang et al., 2022).
The January 2023 average Antarctic extent of 3.23 million square kilometers (1.25 million square miles) is the lowest January extent in the satellite record, below the previous January record low of 3.78 million square kilometers (1.46 million square miles) set in 2017. The downward linear trend in January sea ice extent is 6,400 square kilometers (2,500 square kilometers) per year or 1.3 percent per decade relative to the 1981 to 2010 average.
Arctic freeze/thaw from above and below
A key component in the seasonal and interannual evolution of Arctic sea ice is the timing of melt onset and freeze up. Surface melt and freeze up can be obtained from satellite passive microwave observations but satellite observations do not provide information about what is happening under the ice. The length of the melt season is much longer underneath sea ice as a result of ocean heat. A recent study evaluated data collected from sea ice mass balance buoys (IMBs) and upward looking sonar (ULS) instruments to gain insights on the seasonality of ice melt and freeze up below the ice. Over the period from 2001 to 2018, Lin and colleagues found that in the Beaufort Sea, the bottom melt onset began 17 days before the surface melt. By contrast, in the central Arctic the timing of the melt onset of the top and bottom of the ice was similar. The freeze up of the bottom of the ice began about three weeks after the surface started to freeze. The researchers also found that bottom melt onset occurred about a week earlier during the 2010 to 2018 period compared to the 2001 to 2009 period, because of rising ocean temperatures. Bottom freeze up began one to two weeks earlier in the later period compared to the earlier period because thinner ice allowed faster heat loss from the ocean.
References
Bliss, A. C., M. Anderson, and S. Drobot. 2022. Snow Melt Onset Over Arctic Sea Ice from SMMR and SSM/I-SSMIS Brightness Temperatures, Version 5 [Data Set]. Boulder, Colorado USA. NASA National Snow and Ice Data Center Distributed Active Archive Center. doi:10.5067/TRGWQ0ONTQG5.
Lin, L., R. Lei, M. Hoppmann, D. K. Perovich, and H. 2022. Changes in the annual sea ice freeze–thaw cycle in the Arctic Ocean from 2001 to 2018. The Cryosphere, 16, 4779–4796, doi:10.5194/tc-16-4779-2022.
Steele, M., A. C. Bliss, G. Peng, W. N. Meier, and S. Dickinson. 2019. Arctic Sea Ice Seasonal Change and Melt/Freeze Climate Indicators from Satellite Data, Version 1 [Data Set]. Boulder, Colorado USA. NASA National Snow and Ice Data Center Distributed Active Archive Center. doi:10.5067/KINANQKEZI4T.
Zhang, L., T. L. Delworth, X. Yang, et al. 2022. The relative role of the subsurface Southern Ocean in driving negative Antarctic Sea ice extent anomalies in 2016–2021. Communications Earth and Environment 3, 302. doi:10.1038/s43247-022-00624-1.

