ABOUT THESE IMAGES
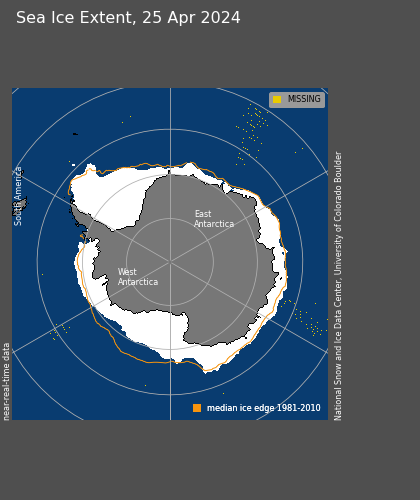
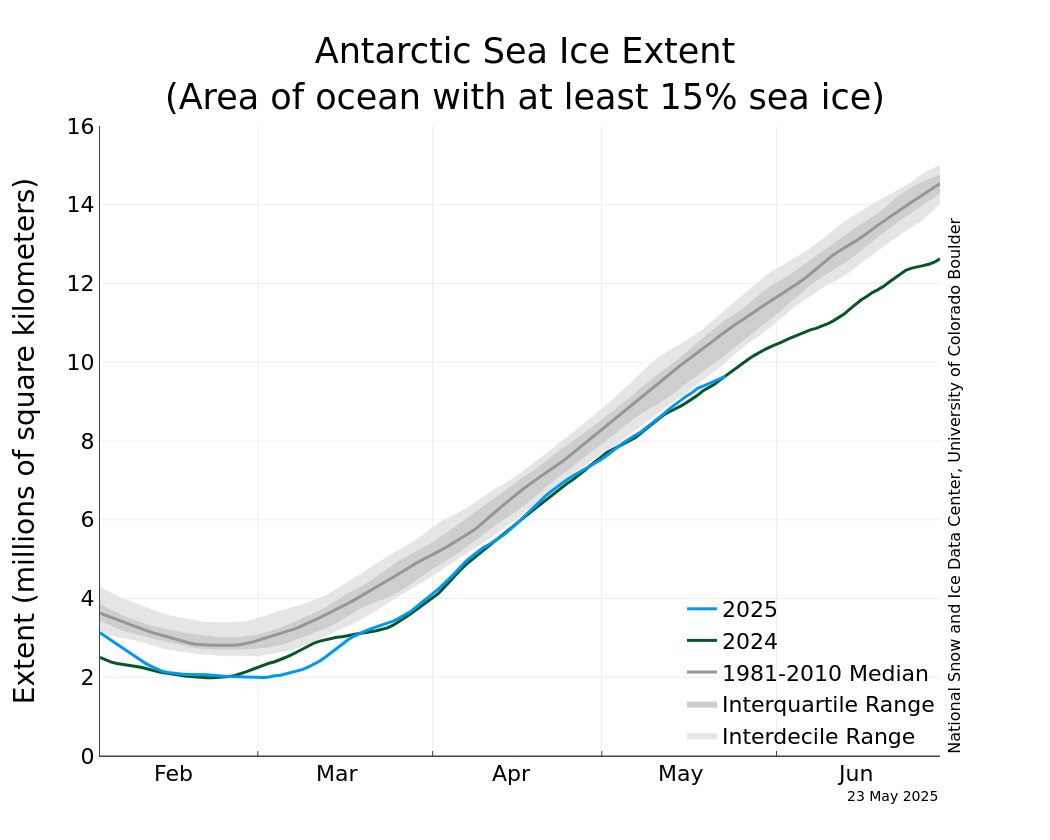
Southern Hemisphere sea ice data updated daily, with one-day lag. Orange line in extent image (left) and gray line in time series (right) indicate 1981 to 2010 average extent for the day shown. The graph also includes lines for selected earlier years, for comparison. Learn about update delays and other problems which occasionally occur in near-real-time data. Read about the data.


