On February 21, Antarctic sea ice likely reached its annual minimum extent of 1.79 million square kilometers (691,000 square miles). This the lowest sea ice extent in the 1979 to 2023 sea ice record, setting a record low for the second straight year.
Please note that this is a preliminary announcement. Changing winds or late-season melt could still reduce the Antarctic ice extent. NSIDC scientists will release a full analysis of the Antarctic and Arctic February conditions in early March.
Overview of conditions
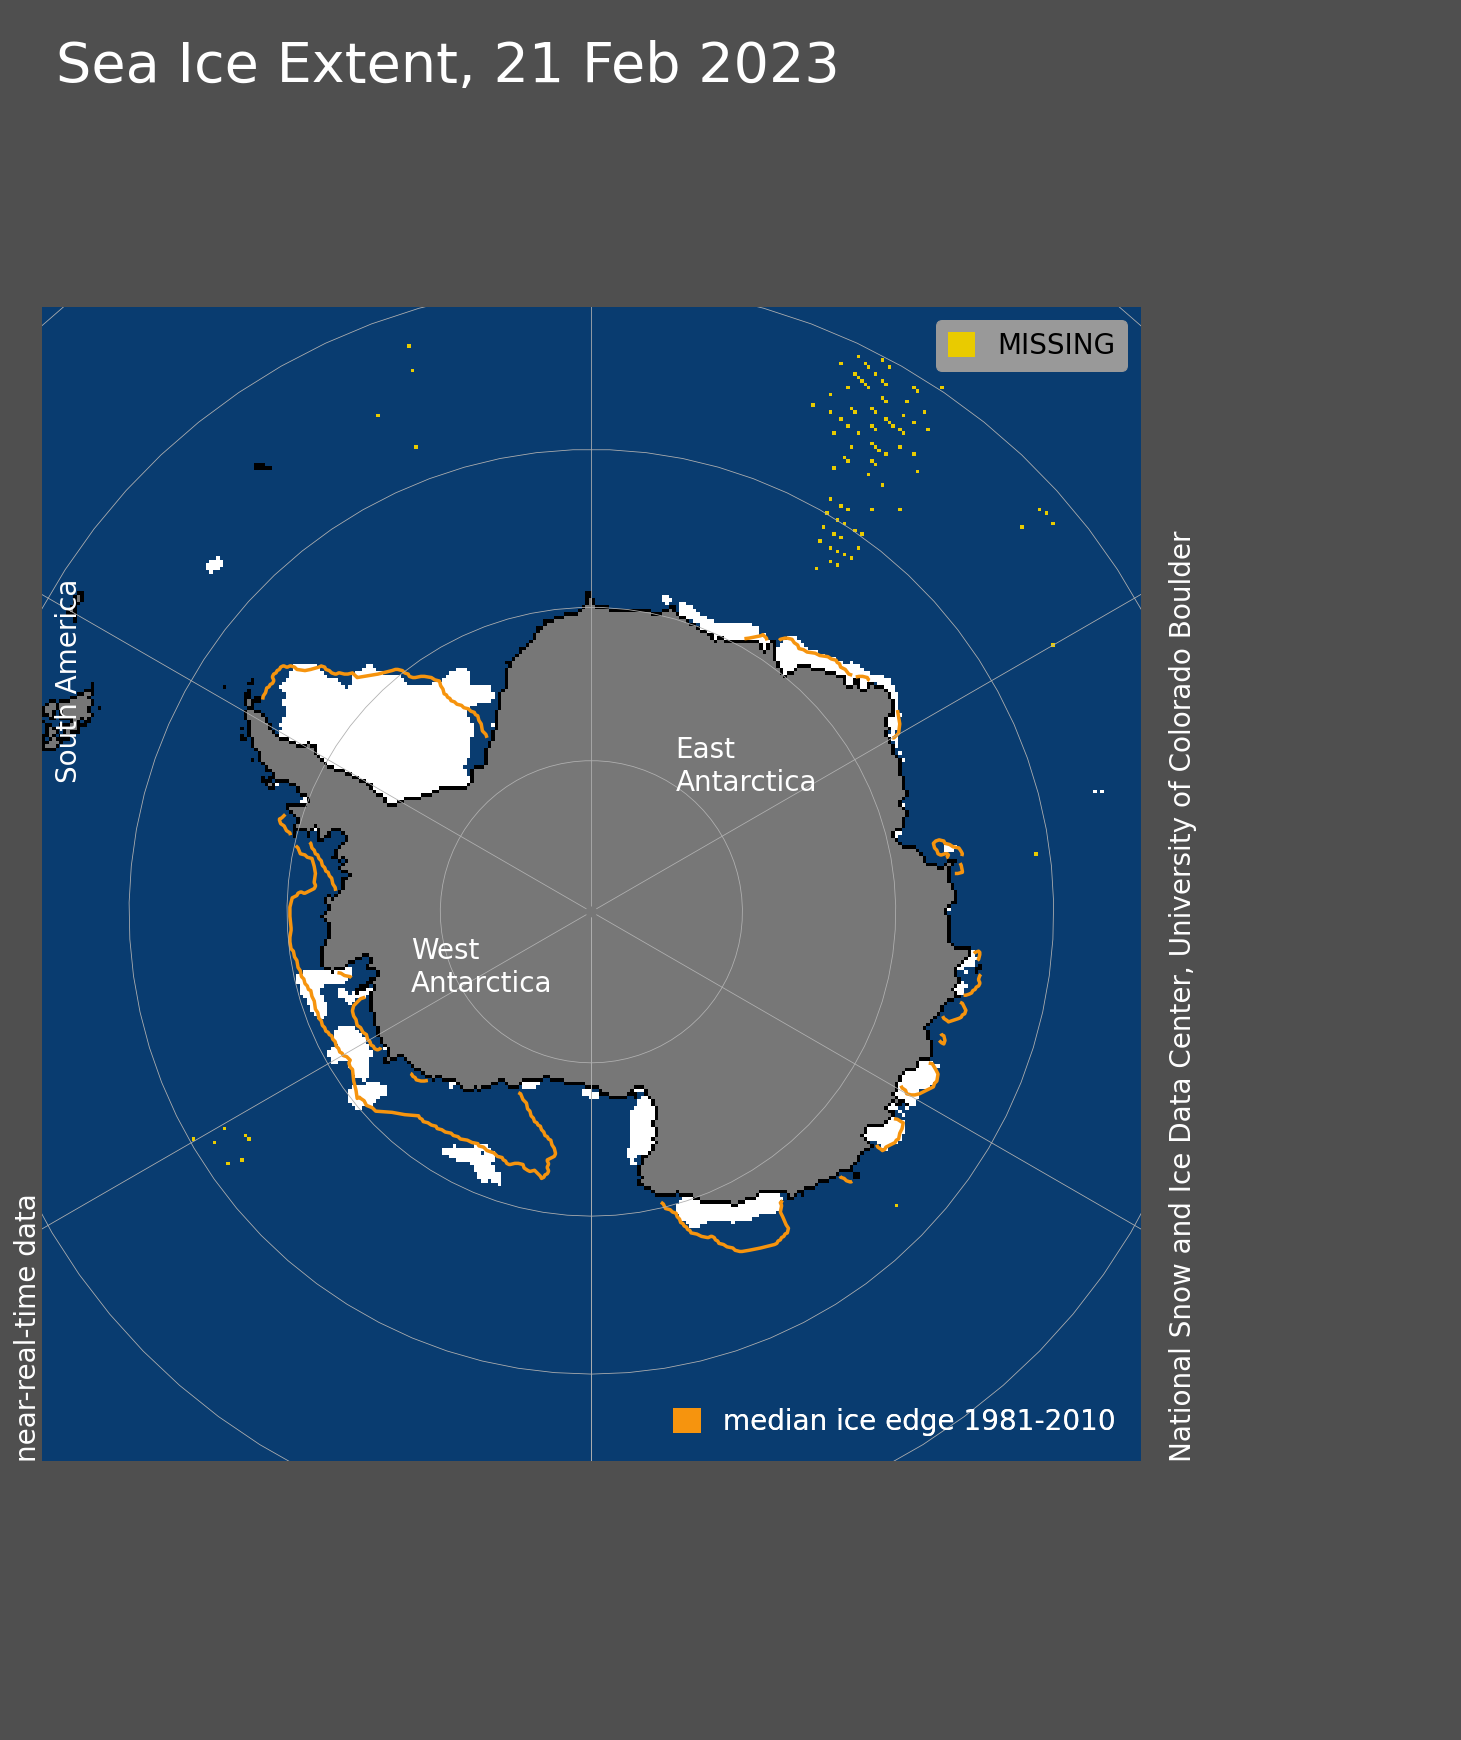
Figure 1. Antarctic sea ice extent for February 21, 2023, was 1.79 million square kilometers (691,000 square miles). The orange line shows the 1981 to 2010 average extent for that day. Sea Ice Index data. About the data
Credit: National Snow and Ice Data Center
High-resolution image
On February 21, 2023, sea ice in the Antarctic reached an annual minimum extent of 1.79 million square kilometers (691,000 square miles), setting a record low in the satellite record that began in 1979. This year’s minimum is 1.05 million square kilometers (405,000 square miles) below the 1981 to 2010 average Antarctic minimum extent. It is 136,000 square kilometers (52,500 square miles) below the previous record low from February 25, 2022. Nearly all of the remaining ice is in the Weddell Sea, with isolated patches along the coasts of Princess Astrid and Princess Ragnild and regions of eastern Wilkes Land and the Pine Island Bay.
The Antarctic minimum extent was reached three days earlier than the 1981 to 2010 median date of February 24. The interquartile range for the date of the Antarctic minimum is February 20 to February 27.
Conditions in context
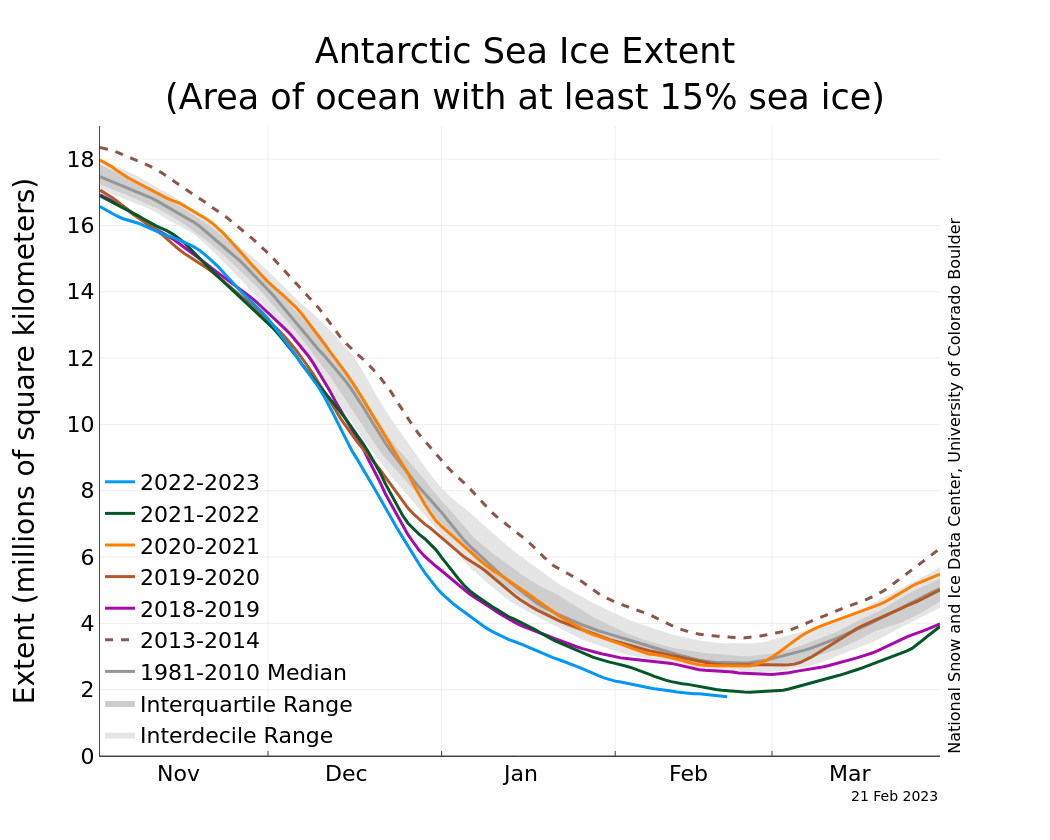
Figure 2a. The graph above shows Antarctic sea ice extent as of February 21, 2023, along with daily ice extent data for four previous years and the record high year. 2022 to 2023 is shown in blue, 2021 to 2022 in green, 2020 to 2021 in orange, 2019 to 2020 in brown, 2018 to 2019 in magenta, and 2013 to 2014 in dashed brown. The 1981 to 2010 median is in dark gray. The gray areas around the median line show the interquartile and interdecile ranges of the data. Sea Ice Index data.
Credit: National Snow and Ice Data Center
High-resolution image
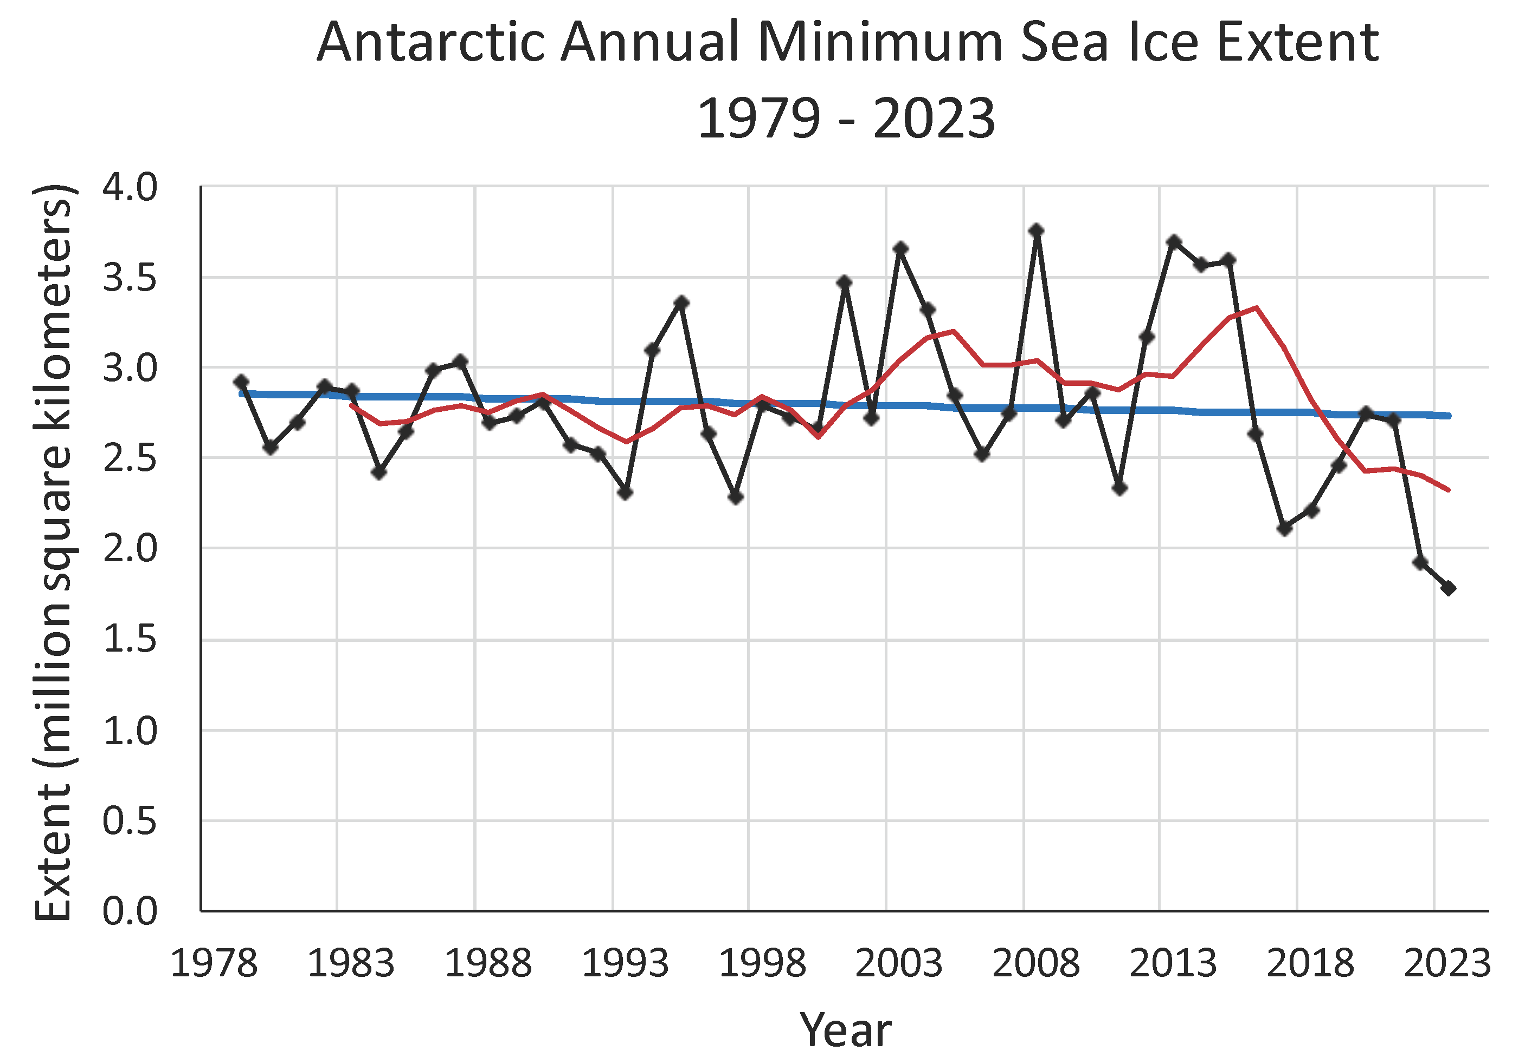
Figure 2b. This graph shows Antarctic annual sea ice minimum extent, depicted as black diamonds, from 1979 to 2023, based on a 5-day running average of daily extent. The linear trend line is in blue with a 1.0 percent per decade downward trend, which is not statistically significant. A five-year running average is shown in red.
Credit: W. Meier, NSIDC
High-resolution image
This year marks a second consecutive record low in Antarctic sea ice extent (Figure 2a). In recent years, 2017 and 2018 also reached very low extents, third and fourth lowest, respectively. With this series of low years, it is natural to speculate if there is now a downward trend. However, a trend computed over such a short time period is not especially meaningful. Note in this respect that 2013 through 2015 saw near record high minimum extents.
Overall, the downward trend in the annual Antarctic sea ice minimum extent computed over the complete satellite record is 2,800 square kilometers (1,100 square miles) per year, or 1.0 percent per decade relative to the 1981 to 2010 average. This trend is not statistically significant (Figure 2b). This is in stark contrast to the Arctic where the trend in the sea ice minimum is larger in magnitude and has strong statistical significance.

