Arctic sea ice has likely reached its maximum extent for the year, at 14.62 million square kilometers (5.64 million square miles) on March 6. The 2023 maximum is the fifth lowest in the 45-year satellite record. NSIDC scientists will present a detailed analysis of the 2022 to 2023 winter sea ice conditions in the regular monthly post in early April.
Overview of conditions
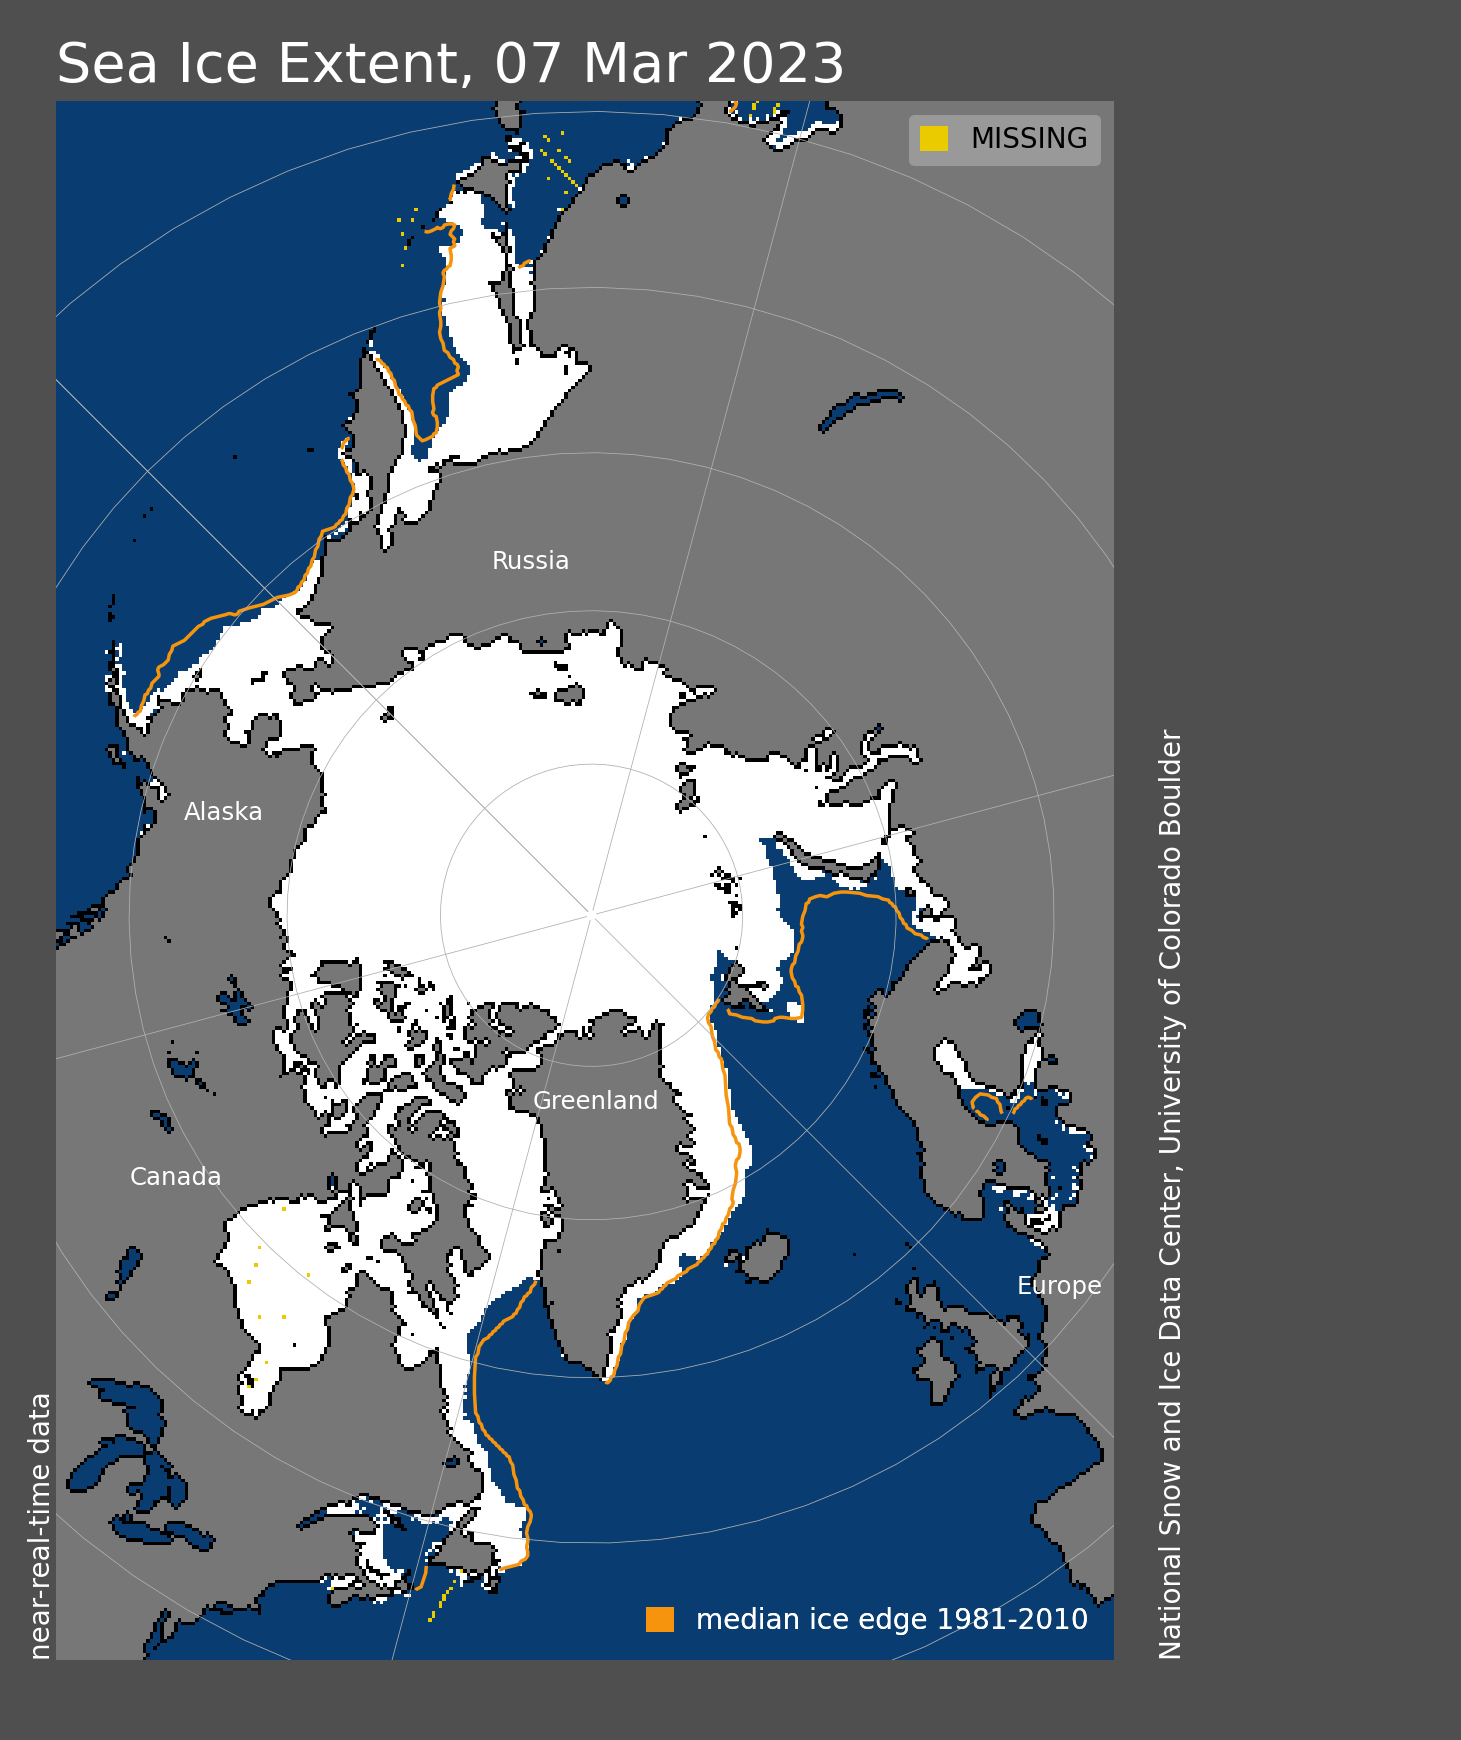
Figure 1. This image shows Arctic sea ice extent on March 7, 2023, which was 14.62 million square kilometers (5.64 million square miles) like the extent on March 6, 2023. The March 7 image is being used because of missing data on the prior day’s map. The orange line shows the 1981 to 2010 average extent for that day. Sea Ice Index data. About the data
Credit: National Snow and Ice Data Center
High-resolution image
On March 6, 2023, Arctic sea ice likely reached its maximum extent for the year, at 14.62 million square kilometers (5.64 million square miles), the fifth lowest extent in the satellite record. This year’s maximum extent is 1.03 million square kilometers (398,000 square miles) below the 1981 to 2010 average maximum of 15.65 million square kilometers (6.04 million square miles) and 210,000 square kilometers (81,000 square miles) above the lowest maximum of 14.41 million square kilometers (5.56 million square miles) set on March 7, 2017.
The date of the maximum this year, March 6, was six days earlier than the 1981 to 2010 average date of March 12.
Conditions in context
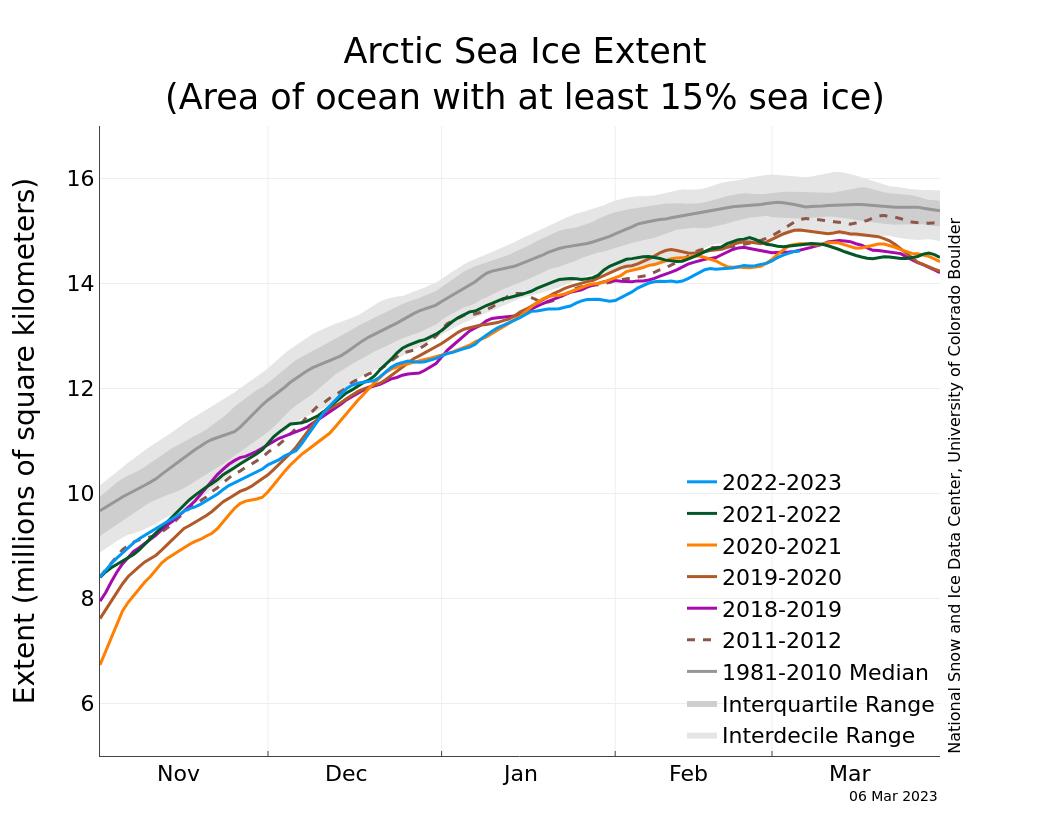
Figure 2. The graph above shows Arctic sea ice extent as of March 6, 2023, along with daily ice extent data for four previous years and the record low year. 2022 to 2023 is shown in blue, 2021 to 2022 in green, 2020 to 2021 in orange, 2019 to 2020 in brown, 2018 to 2019 in magenta, and 2011 to 2012 in dashed brown. The 1981 to 2010 median is in dark gray. The gray areas around the median line show the interquartile and interdecile ranges of the data. Sea Ice Index data.
Credit: National Snow and Ice Data Center
High-resolution image
The ice growth season ended with below average sea ice extent in the Bering Sea, Sea of Okhotsk, Barents Sea, and Labrador Sea. Above average extent was in the Greenland Sea. Extent was well below average in the Gulf of St. Lawrence for a second year in row.
Since the maximum on March 6, extent has dropped about 200,000 square kilometers (77,000 square miles), with losses primarily in Labrador Sea, Gulf of St. Lawrence, and the Barents Sea.
Table 1. Ten lowest maximum Arctic sea ice extents (satellite record, 1979 to present)
| Rank | Year | In millions of square kilometers | In millions of square miles | Date |
| 1 | 2017 | 14.41 | 5.56 | March 7 |
| 2 | 2018 | 14.47 | 5.59 | March 17 |
| 3 | 2016 2015 |
14.51 14.52 |
5.60 5.61 |
March 23 February 25 |
| 5 | 2023 | 14.62 | 5.64 | March 6 |
| 6 | 2011 2006 |
14.67 14.68 |
5.66 5.67 |
March 9 March 12 |
| 8 | 2007 2021 |
14.77 14.78 |
5.70 5.71 |
March 12 March 12 |
| 10 | 2019 | 14.82 | 5.72 | March 13 |
For the Arctic maximum, which typically occurs in March, the uncertainty range is ~34,000 square kilometers (13,000 square miles), meaning that extents within this range must be considered effectively equal.

